


Introduction
At the very beginning, I would like to express my sincere gratitude to element14 for selecting me as one of the official challengers and providing the opportunity to develop and share this project. I also thank the kit sponsors for supporting the project by providing the hardware and resources needed for its development. Their support encourages me to explore practical engineering solutions to real-world problems and share my work with the electronics and maker community.
Access to healthcare remains a challenge for many people living in rural communities in my country, Bangladesh. In many areas, people need to travel a considerable distance to visit a doctor or receive basic medical services. This can be difficult when someone needs to check their health condition but cannot immediately reach a healthcare facility. To address this problem, I developed HealthGuard, a portable and lightweight health monitoring device that helps rural people perform preliminary health checks easily.
With HealthGuard, I can measure four important health parameters: body temperature, heart rate, blood oxygen saturation (SpO₂), and a three-lead electrocardiogram (ECG). I use different electronic sensors to collect these measurements and display the results directly on the device's screen. I also interface the device with LabVIEW so that I can monitor the collected data on a computer through a graphical user interface. This allows users or caregivers to observe the measurements more conveniently and view the ECG signal as a graph in real time.
I designed a compact, lightweight enclosure using 3D printing to house the electronic components and make the device easy to carry. By combining sensors, an embedded controller, a display, and a computer-based monitoring interface, I aim to make basic health monitoring more accessible to people who live far from healthcare facilities.
I developed HealthGuard as a preliminary health monitoring project, not as a replacement for professional medical services. It can help users observe basic health measurements and identify situations where further medical assessment may be necessary. I hope this project will demonstrate how affordable electronics and embedded systems can support accessible healthcare, particularly in rural and underserved communities.
Hardware Components used in the project
The following hardware components are used in this project.
1. ESP32-Based CYD Module
The main component of my HealthGuard project is the ESP32-based CYD (Cheap Yellow Display) module. I use this module as the central controller to collect data from the connected health sensors, process the measurements, and display the results on its built-in color TFT display. I selected this module because it combines a microcontroller and a display in a single, compact board, which helps me reduce the number of additional components and keep the device lightweight. The ESP32 provides sufficient processing capability to handle sensor readings and update the display while communicating with a computer through its USB serial connection. I use this serial communication to send temperature, heart rate, SpO₂, and ECG data to LabVIEW, where I can monitor the measurements and visualize the ECG signal in real time. The module is also affordable, easy to program using the Arduino IDE, and well-suited for developing a portable embedded health monitoring device.
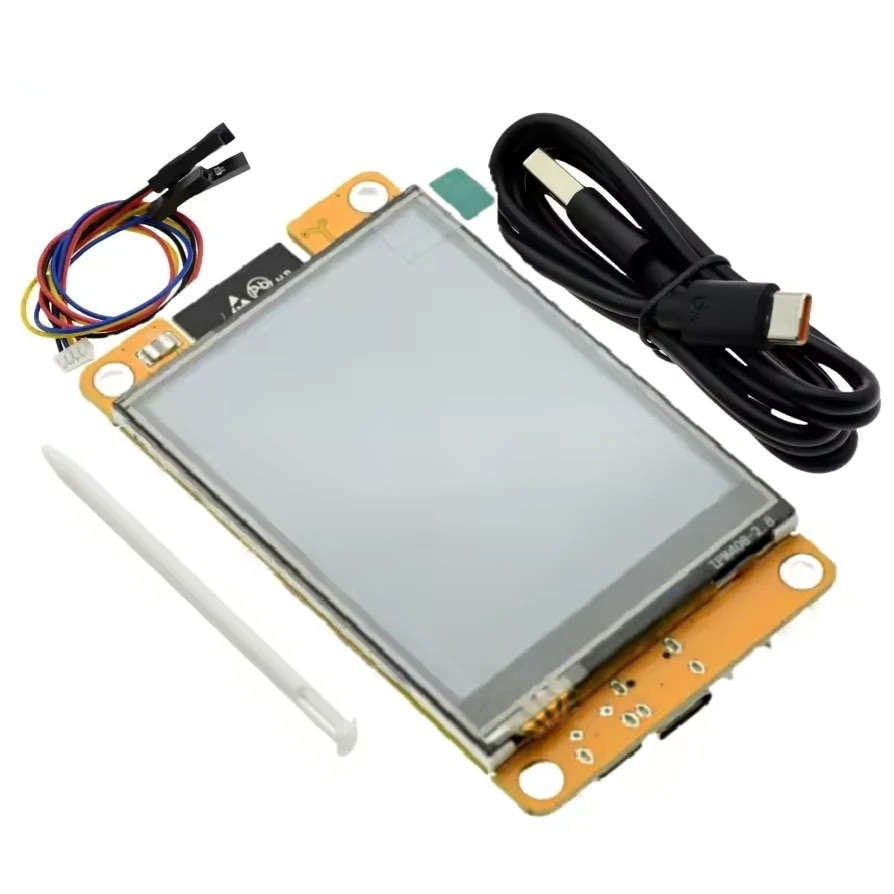
Fig 1. ESP32 Based CYD Module
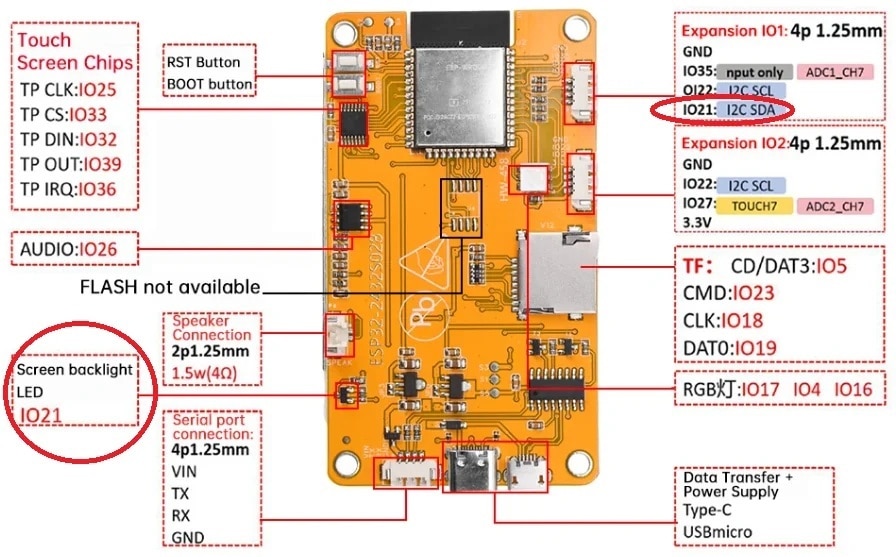
Fig. 2. CYD Module Peripherals
The details of the module, with all the design files and example code, are available at this GitHub link: https://github.com/witnessmenow/ESP32-Cheap-Yellow-Display
2. The Analog Devices MAX30208EVSYS Evaluation Kit
I use the Analog Devices MAX30208EVSYS Evaluation Kit to measure body temperature in my HealthGuard project. This kit is designed to evaluate the MAX30208 digital temperature sensor, which offers high measurement accuracy of up to ±0.1°C under specified operating conditions. The sensor is suitable for applications such as human body digital thermometers, healthcare patches, sports watches, and wearable thermometers. I selected this kit because accurate temperature measurement is an important part of preliminary health monitoring. The sensor communicates with the ESP32-based CYD module through the I²C communication protocol, allowing the controller to collect temperature readings and display them on the screen. I can power the sensor board from a compatible 3.3 V supply, making it suitable for interfacing with the ESP32. This evaluation kit was included in the sponsor kit, which helped me integrate body temperature measurement into HealthGuard.

Fig. 3. Analog Devices MAX30208EVSYS Evaluation Kit
Details of the Kit are available at this official link: https://www.analog.com/en/resources/evaluation-hardware-and-software/evaluation-boards-kits/max30208evsys.html#eb-overview
My blog on Experimenting with MAX30208EVSYS is available at the link: https://community.element14.com/challenges-projects/design-challenges/smart-home-healthcare-challenge/f/forum/57295/healthguard-1---experimenting-with-max30208evsys
3. Analog Devices MAXREFDES117 optical heart-rate module
This is a Tiny Optical Heart-Rate Sensor with integrated red and IR LEDs, making it an ideal choice for developers and enthusiasts alike. The MAXREFDES117 optical heart rate module is a compact, low-power sensor designed specifically for wearable health monitoring projects. This tiny board, perfect for wearable projects, can be placed on a finger or earlobe to accurately detect heart rate. This versatile module works with both Arduino and mbed platforms for quick testing, development, and system integration. Measuring just 12.7mm x 12.7mm, this MAXREFDES117 sensor module can accurately detect heart rate and blood oxygen saturation (SpO2) levels when placed on a finger or earlobe.
The MAXREFDES117 optical heart rate module utilises a sophisticated two-sided PCB design with strategic component placement for maximum space efficiency, featuring the main heart rate/SpO₂ sensor on one side and a level translator IC, along with a step-down converter, on the other.
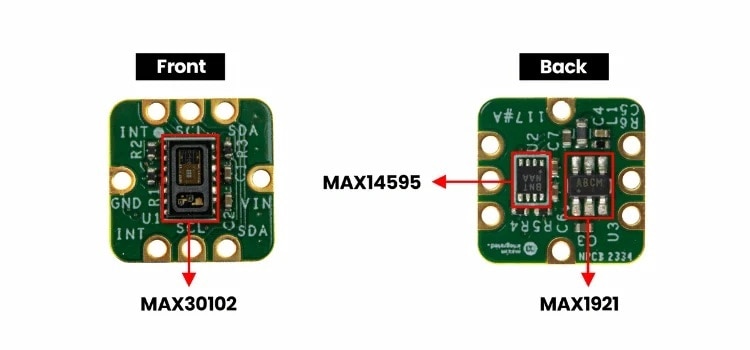
Fig. 4. MAXREFDES117 optical heart-rate module
Official documentation of the sensor is here: https://www.analog.com/en/resources/reference-designs/maxrefdes117.html#rd-overview
You can find a good tutorial on the sensor here: https://circuitdigest.com/review/understanding-maxrefdes117-a-tiny-optical-heart-rate-sensor
My experiment blog on this sensor is here: https://community.element14.com/challenges-projects/design-challenges/smart-home-healthcare-challenge/f/forum/57327/healthguard-2---experimenting-with-maxrefdes117-reference-design-board
4. AD8232 SparkFun Single Lead Heart Rate & ECG Monitor
The AD8232 SparkFun Single Lead Heart Rate Monitor is a cost-effective board used to measure the electrical activity of the heart. This electrical activity can be charted as an ECG or Electrocardiogram and output as an analog reading. ECGs can be extremely noisy, the AD8232 Single Lead Heart Rate Monitor acts as an op amp to help obtain a clear signal from the PR and QT Intervals easily.
The AD8232 is an integrated signal conditioning block for ECG and other biopotential measurement applications. It is designed to extract, amplify, and filter small biopotential signals in the presence of noisy conditions, such as those created by motion or remote electrode placement.
The AD8232 Heart Rate Monitor breaks out nine connections from the IC that you can solder pins, wires, or other connectors to. SDN, LO+, LO-, OUTPUT, 3.3V, GND provide essential pins for operating this monitor with an Arduino or other development board. Also provided on this board are RA (Right Arm), LA (Left Arm), and RL (Right Leg) pins to attach and use your own custom sensors. Additionally, there is an LED indicator light that will pulsate to the rhythm of a heart beat.
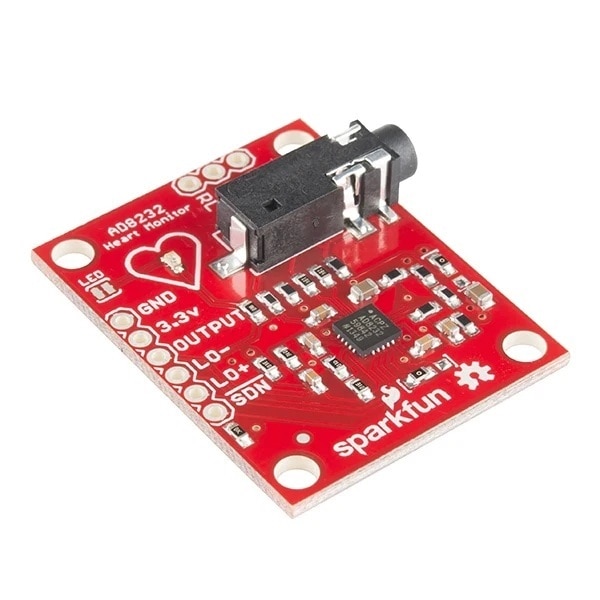
Fig. 5. AD8232 Heart Rate and ECG Sensor
This module works at 3.3V supply which make it competible to ESP32.
Details of the sensor are available here: https://learn.sparkfun.com/tutorials/ad8232-heart-rate-monitor-hookup-guide
5. Sensor Cable - Electrode Pads (3-connector)
This is your simple three conductor sensor cable with electrode pad leads. These cables are 24" long and feature a 3.5mm audio jack connector on one end with snap style receptacles for biomedical sensor pads. Electrodes act as the interface between the human body and the ECG sensor. They detect the tiny electrical signals generated by the heart whenever it beats and transfer these signals to the SparkFun AD8232 module.
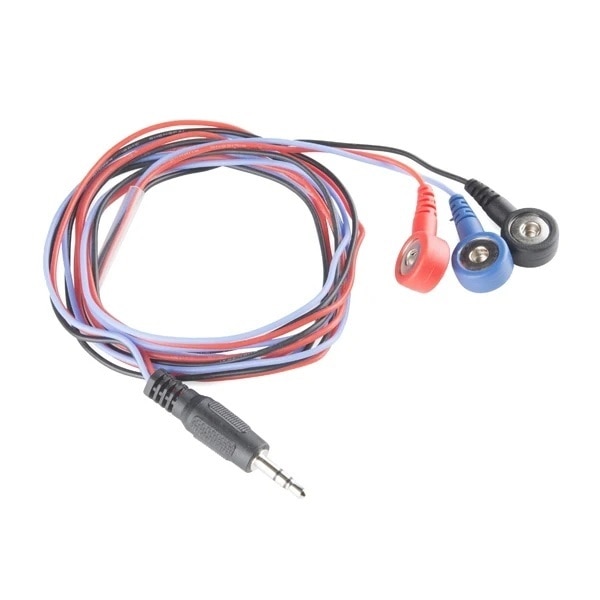
Fig. 6. 3-lead electrode
Details are available here: https://www.sparkfun.com/sensor-cable-electrode-pads-3-connector.html#content-overview
6. Biomedical Sensor Pads
These pads stick to the skin and contain a conductive gel or conductive surface that helps detect the heart's tiny electrical signals. I connect three electrode pads to the three-lead ECG cable and place them at appropriate positions on the body. The pads help maintain stable skin contact, reduce signal interference caused by poor contact, and improve the quality of the ECG waveform.
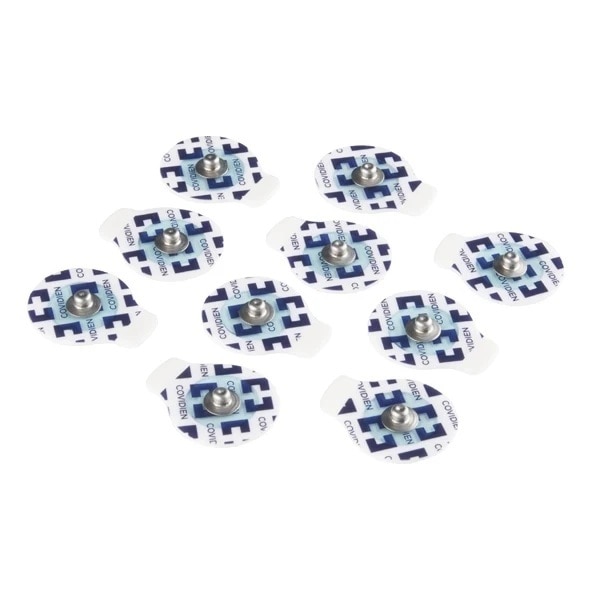
Fig. 7. Sensor pad
7. 3M EM25TP-0050 EMI Absorber (optional)
The EM25TP is a thin, flexible magnetic composite material designed to redirect magnetic fields and absorb electromagnetic interference (EMI). The ESP32, its display, USB connection, and switching power circuitry can produce electrical noise. The AD8232 measures very small electrical signals from the heart, so interference can affect the ECG waveform. I could test whether EM25TP reduces unwanted noise.
8. 3M 1/2-5-8810. Thermally Conductive Tape (optional)
I use 3M 8810 thermally conductive tape to mount the MAX30208 temperature sensor assembly inside the 3D-printed enclosure of my HealthGuard project. The tape provides an adhesive bond that helps secure the sensor in its intended position without requiring additional mechanical fasteners. Its thermal conductivity allows heat to pass through the tape, which can be beneficial when the sensor needs thermal contact with a designated measurement surface.
Fig. 8. Thermal conductive tape
Technical datasheet for this: https://www.farnell.com/datasheets/2162773.pdf
Software Tools
1. Arduino IDE
I use the Arduino IDE to develop and upload the firmware to the ESP32-based CYD module in my HealthGuard project. I selected this development environment because it is easy to use, supports ESP32 programming, and provides a wide range of libraries for interfacing with sensors such as the MAX30208 and MAX30102. The Arduino IDE also simplifies debugging and serial communication, allowing me to send real-time health measurements to LabVIEW for monitoring and visualization. Its extensive community support and open-source ecosystem make it a practical choice for developing and testing my embedded health monitoring system.
2. Emerson NI LabVIEW
I use LabVIEW to develop a computer-based graphical interface for monitoring the health data collected by my HealthGuard device. I selected LabVIEW because it provides an intuitive environment for displaying real-time sensor readings and visualizing signals. The ESP32 sends body temperature, heart rate, SpO₂, and ECG data to the computer through serial communication using the VISA protocol. LabVIEW receives and separates these comma-separated values, displays the measurements using numerical and meter indicators, and plots the ECG signal on a real-time chart. This interface makes it easier to observe the collected data, monitor changes in the ECG waveform, and demonstrate the operation of HealthGuard on a computer.
Find details of LabVIEW on the NI official page: https://www.ni.com/en.html
Connecting all the hardware components
The Schematic
The following schematic illustrates the connections between the components used in my HealthGuard project. I connect the MAX30102 SpO₂ sensor and the MAX30208 body temperature sensor to the same I²C bus, allowing the ESP32-based CYD module to communicate with both sensors through a shared interface. The AD8232 ECG sensor requires three GPIO connections: one analog input to read the ECG signal and two digital inputs to detect lead-off conditions. The CYD module provides GPIO35, which supports analog input and is accessible for external connections. However, I could not find suitable external connection points for the two digital signals required by the AD8232 module. Therefore, I directly soldered these two connections to GPIO16 and GPIO17 on the ESP32 module. Although these GPIOs are associated with the onboard RGB LED circuitry, they worked correctly when configured as digital inputs for ECG lead-off detection. This arrangement allowed me to integrate all three sensors without changing the CYD module's existing display interface.
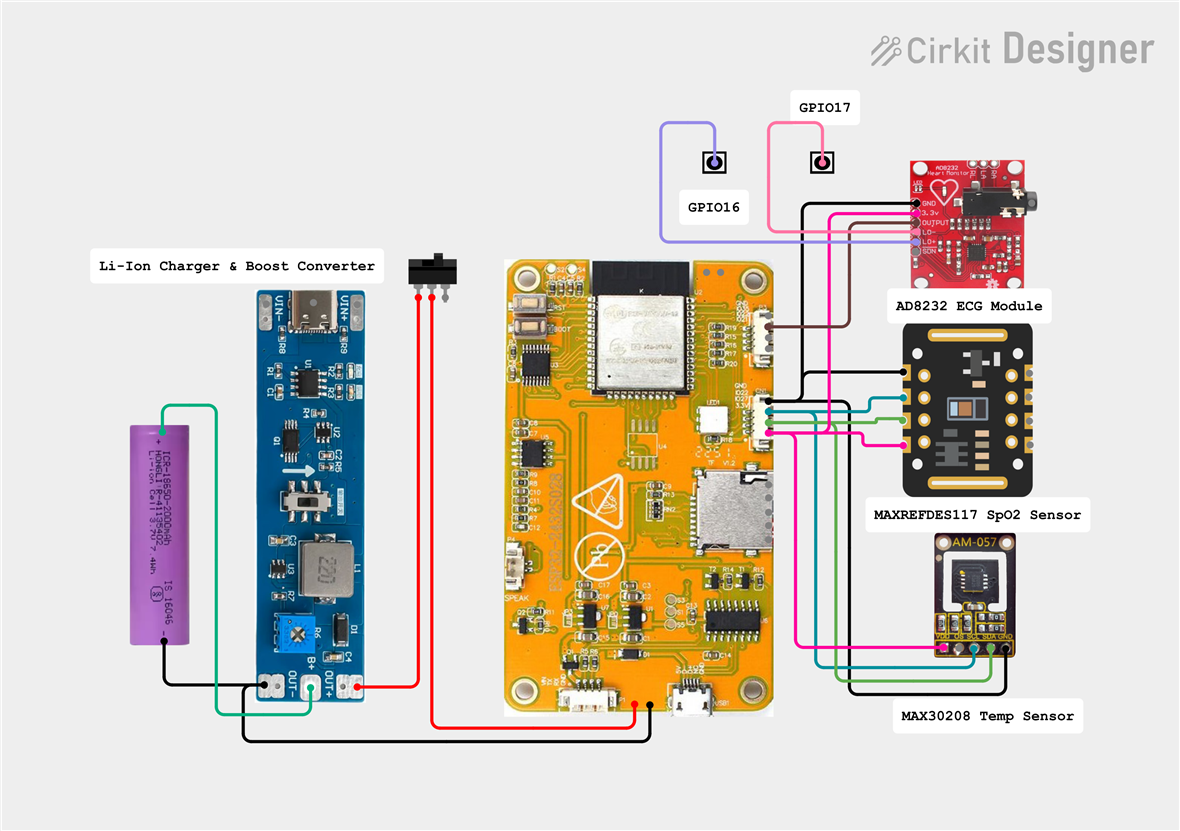
The above circuit is directly accessible from the link: https://app.cirkitdesigner.com/project/cf3ced21-6233-4237-b0b8-2dacfe510735
Making the Connections
Following the schematic, I soldered the sensors to the CYD module one by one. First, I soldered four thin jumper wires to the MAXREFDES117 SpO₂ sensor module to establish the required connections. I then connected the other ends of the wires to a small piece of perfboard, where I also planned to connect the MAX30208 body temperature sensor to the same I²C bus. Using a small piece of perfboard helped me organize the wiring, keep the connections secure, and reduce the risk of accidental short circuits. Finally, I soldered the jumper connector supplied with the CYD module to the perfboard to plug the sensors with the main controller.
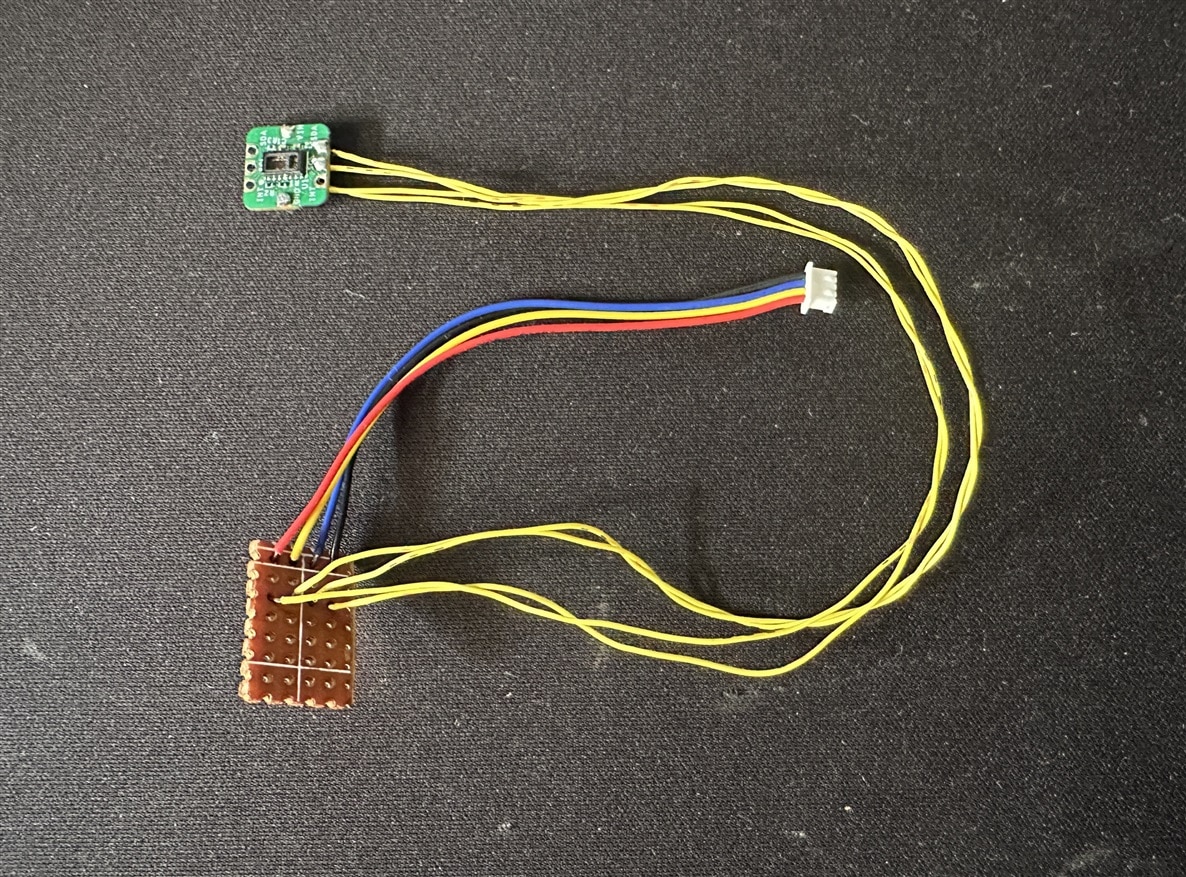
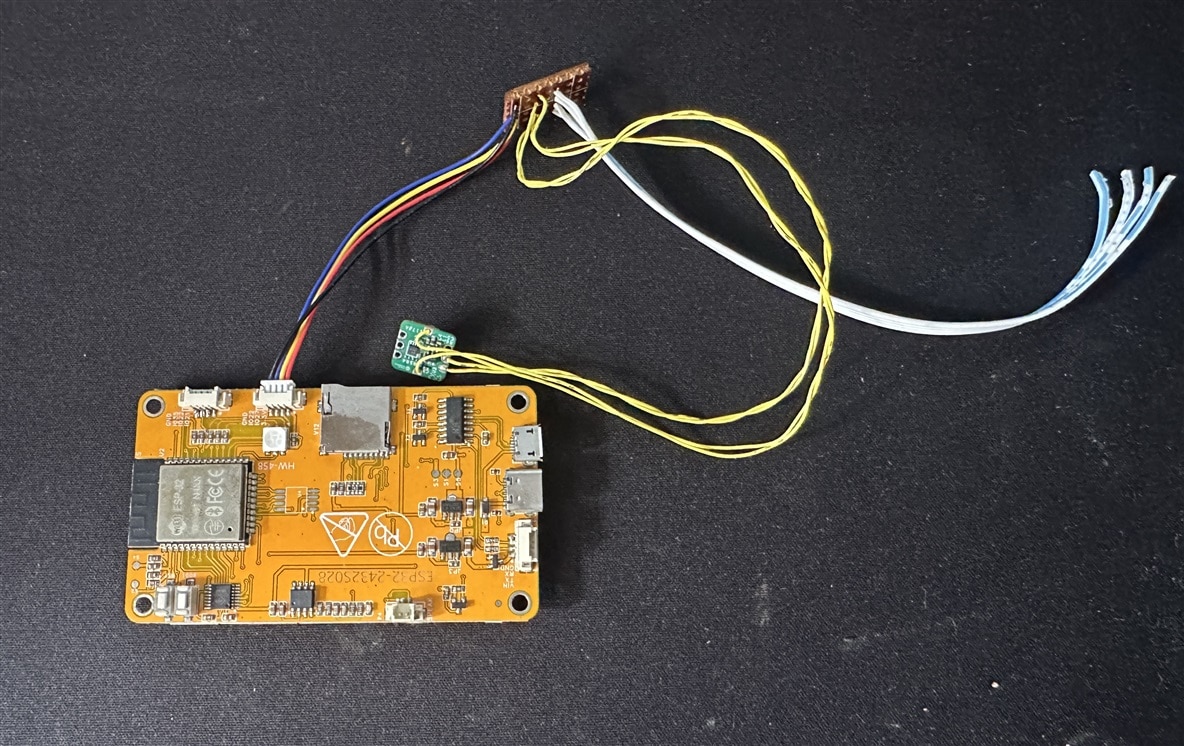
The following photo shows the jumper connections to the main controller. I also soldered four additional jumper wires to the perfboard, which I will use to connect the MAX30208EVSYS# Evaluation Kit through its screw terminal. This arrangement allows me to connect the body temperature sensor easily while keeping the wiring organized and secure.
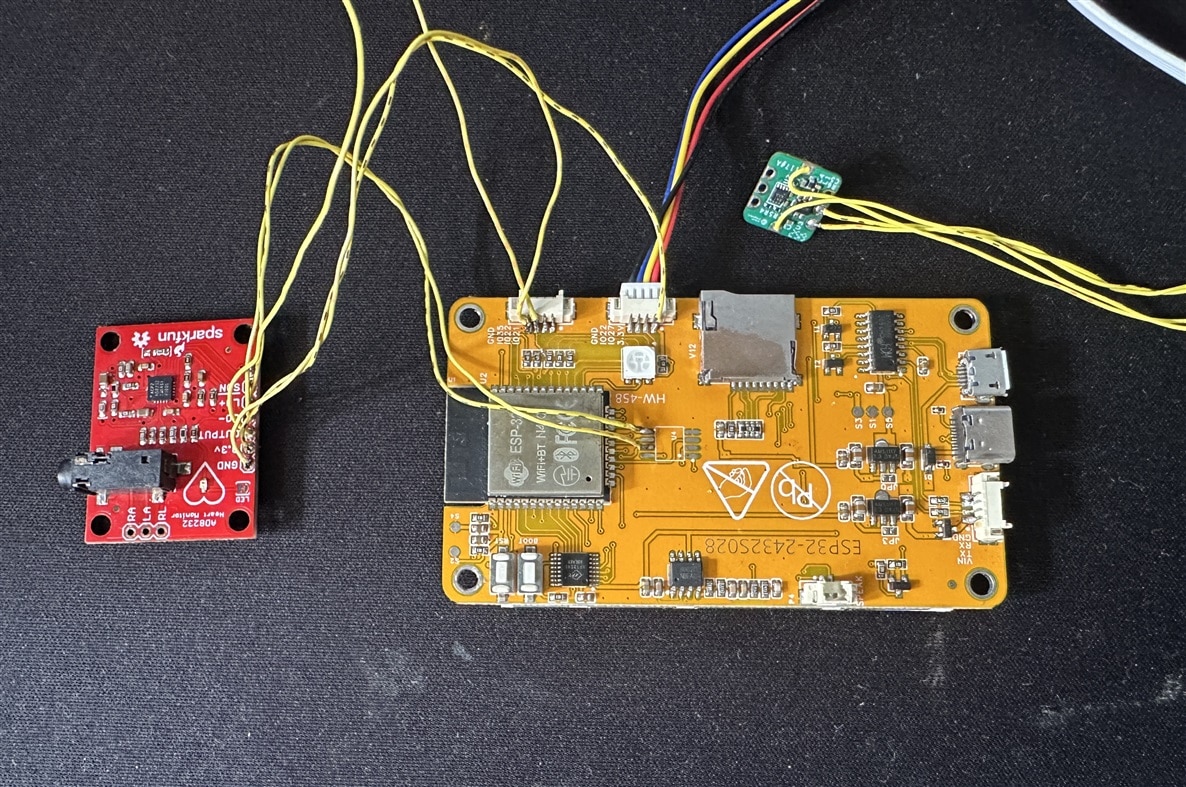
The following photo shows my first attempt to connect the AD8232 ECG sensor module to the ESP32-based CYD module. I needed two digital GPIO pins to connect the lead-off detection outputs of the AD8232. As I could not find suitable external connection points, I decided to use the U4 pads on the CYD board. These pads are intended for an external flash memory chip, but the chip was not installed on my board. I thought I could use these unpopulated pads for the ECG sensor because the memory chip was absent. Therefore, I soldered the two lead-off detection wires to these pads and then programmed the ESP32 to test the connections. However, after uploading the code, I realized that these pins were not suitable for my intended use. The pads were associated with the ESP32's flash memory interface, so using them as general-purpose input/output (GPIO) pins could interfere with the board's normal operation. This first attempt helped me understand the board's pin limitations, and I decided to find another solution for connecting the AD8232 lead-off detection signals.
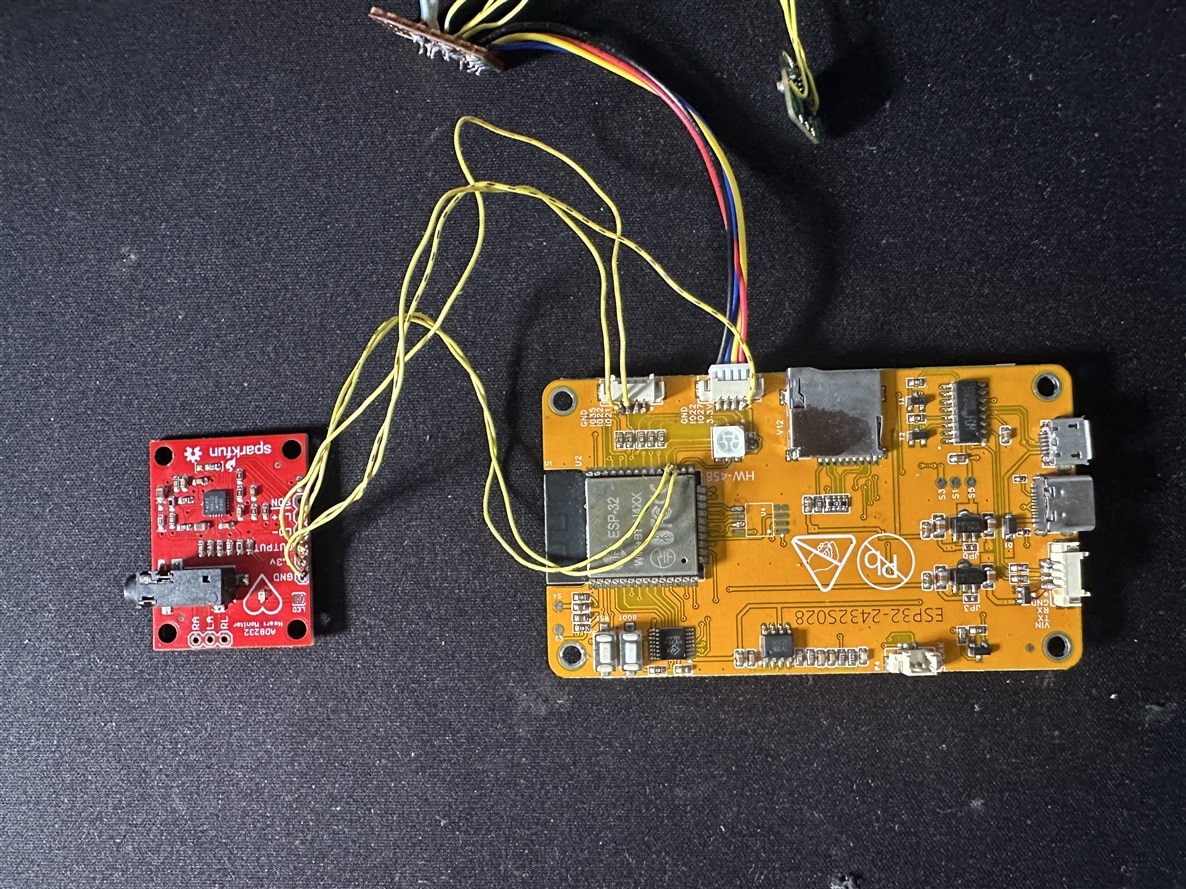
After doing some research, I decided to try using the GPIO pins connected to the onboard RGB LED because I did not need the LED for my HealthGuard project. I located the corresponding GPIO pins on the main ESP32 chip and soldered the two lead-off detection wires from the AD8232 ECG sensor module to GPIO16 and GPIO17. Initially, I was concerned that the onboard LED circuitry might interfere with the input signals. I therefore planned to remove the resistors associated with the LED if I encountered any problems. However, after connecting the wires and configuring both GPIO pins as digital inputs in my program, everything worked without any issues. This solution allowed me to connect the AD8232 lead-off detection signals without modifying the existing LED circuitry or changing the CYD module's display interface.
Uploading the Test Program
Before connecting the sensors, I uploaded a test program to configure the display and design the user interface for HealthGuard. I wanted to make sure that the display was working properly and that I could arrange all the health parameters clearly on the screen. After uploading the initial program and making several modifications, I was able to organize the interface according to my requirements. At this stage, I used randomly generated values to simulate the sensor readings and test how the data appeared on the display. This allowed me to adjust the layout and verify the display operation before integrating the actual sensors.
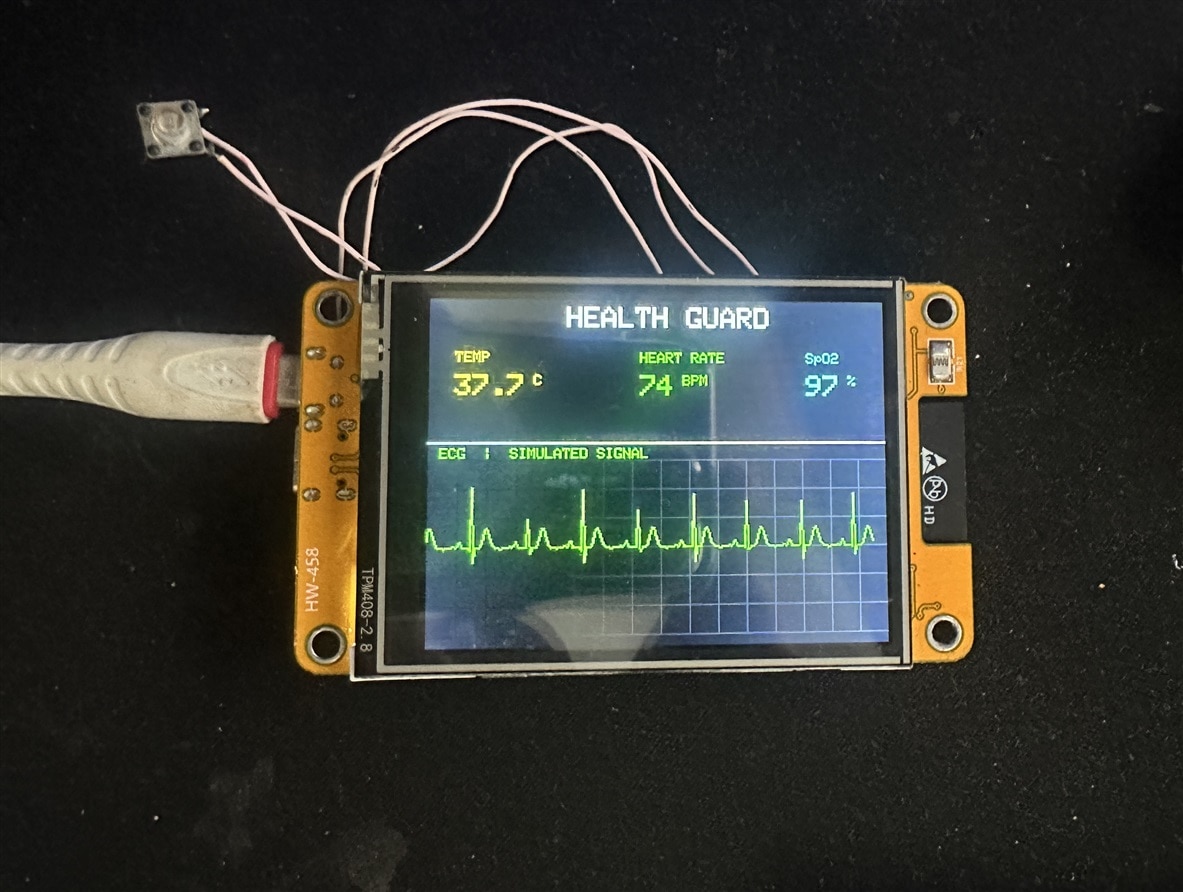
After testing the display, finalizing the layout, and connecting all the sensors, I developed the final code to interface with the sensors and display real-time measurement data. I tested several libraries for the MAX30208 body temperature sensor before finding one that worked correctly with my setup. For the MAX30102 SpO₂ sensor, I used the SparkFun sensor library to collect the readings. After making the necessary adjustments and testing each sensor, I successfully integrated all the components. Finally, I verified that the sensors were working as expected and finalized the code for my HealthGuard project.
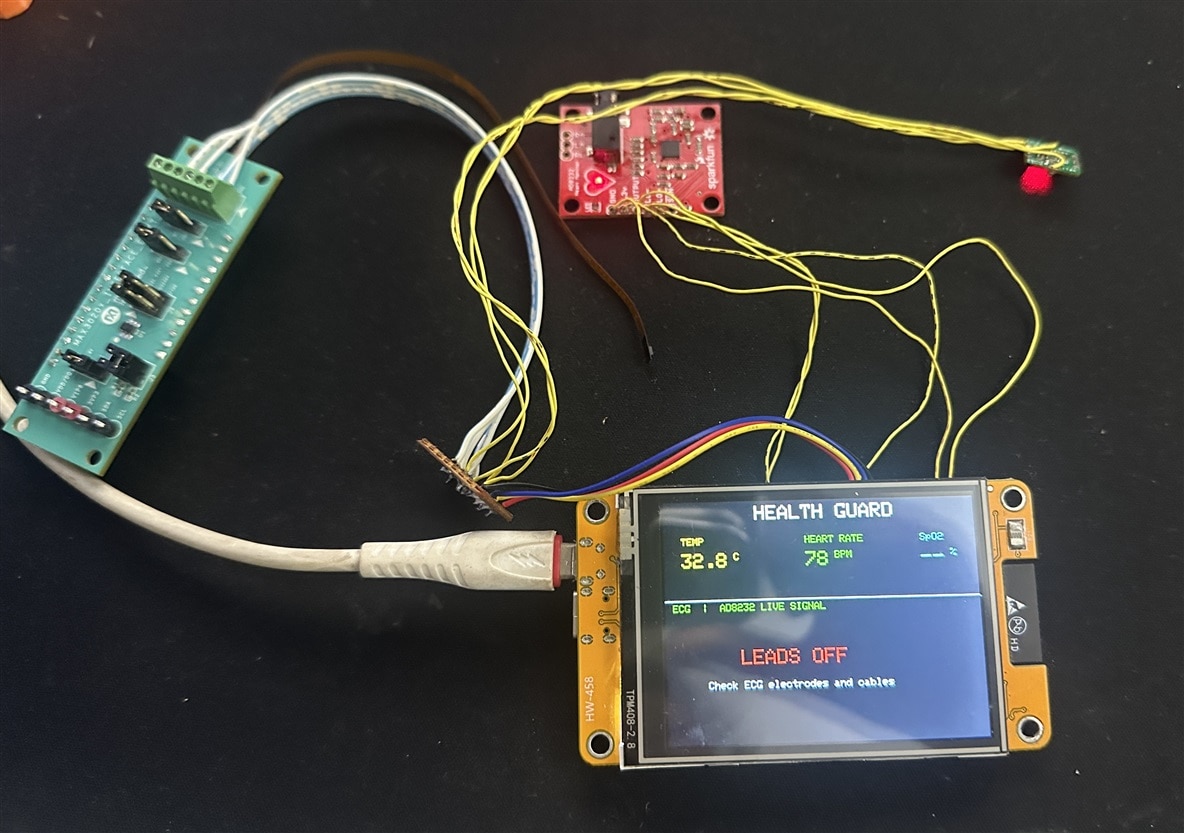
The Final Code
I divided the CYD module's display into two main sections to present the health measurements clearly. The upper section displays three sensor readings: body temperature, heart rate, and blood oxygen saturation (SpO₂). I arranged these values so that users can quickly check the measurements on the screen. The lower section is dedicated to displaying the ECG waveform in real time, allowing users to observe changes in the heart's electrical activity. This layout makes efficient use of the available display area and keeps the sensor readings and ECG graph visible on a single screen. Before integrating the sensors, I tested and adjusted the display layout to ensure that the information was presented clearly and updated as expected.
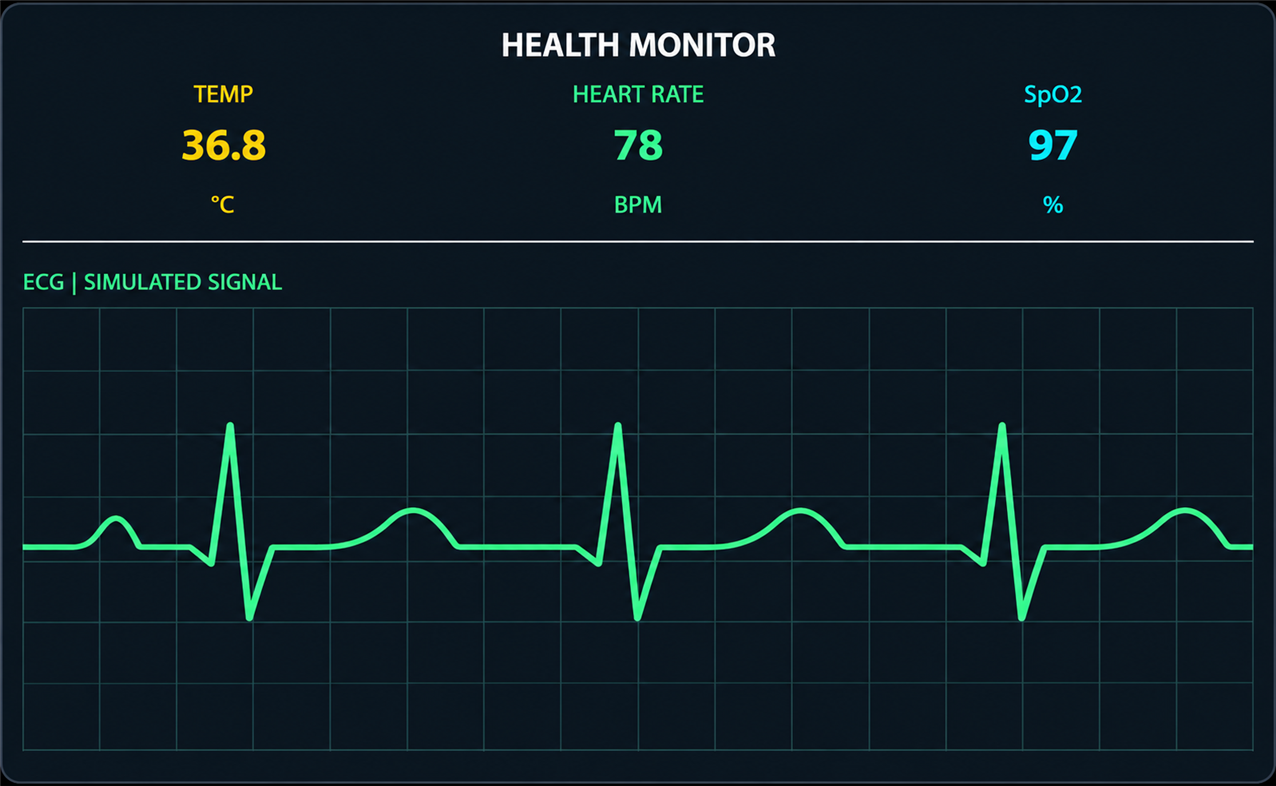
In the layout:
-
Top section (approximately 45%): Display body temperature, heart rate, and SpO₂ using large numerical values with colored labels.
-
Bottom section (approximately 55%): Plot a continuously scrolling ECG-like waveform using randomly generated data that resembles a three-lead ECG recording.
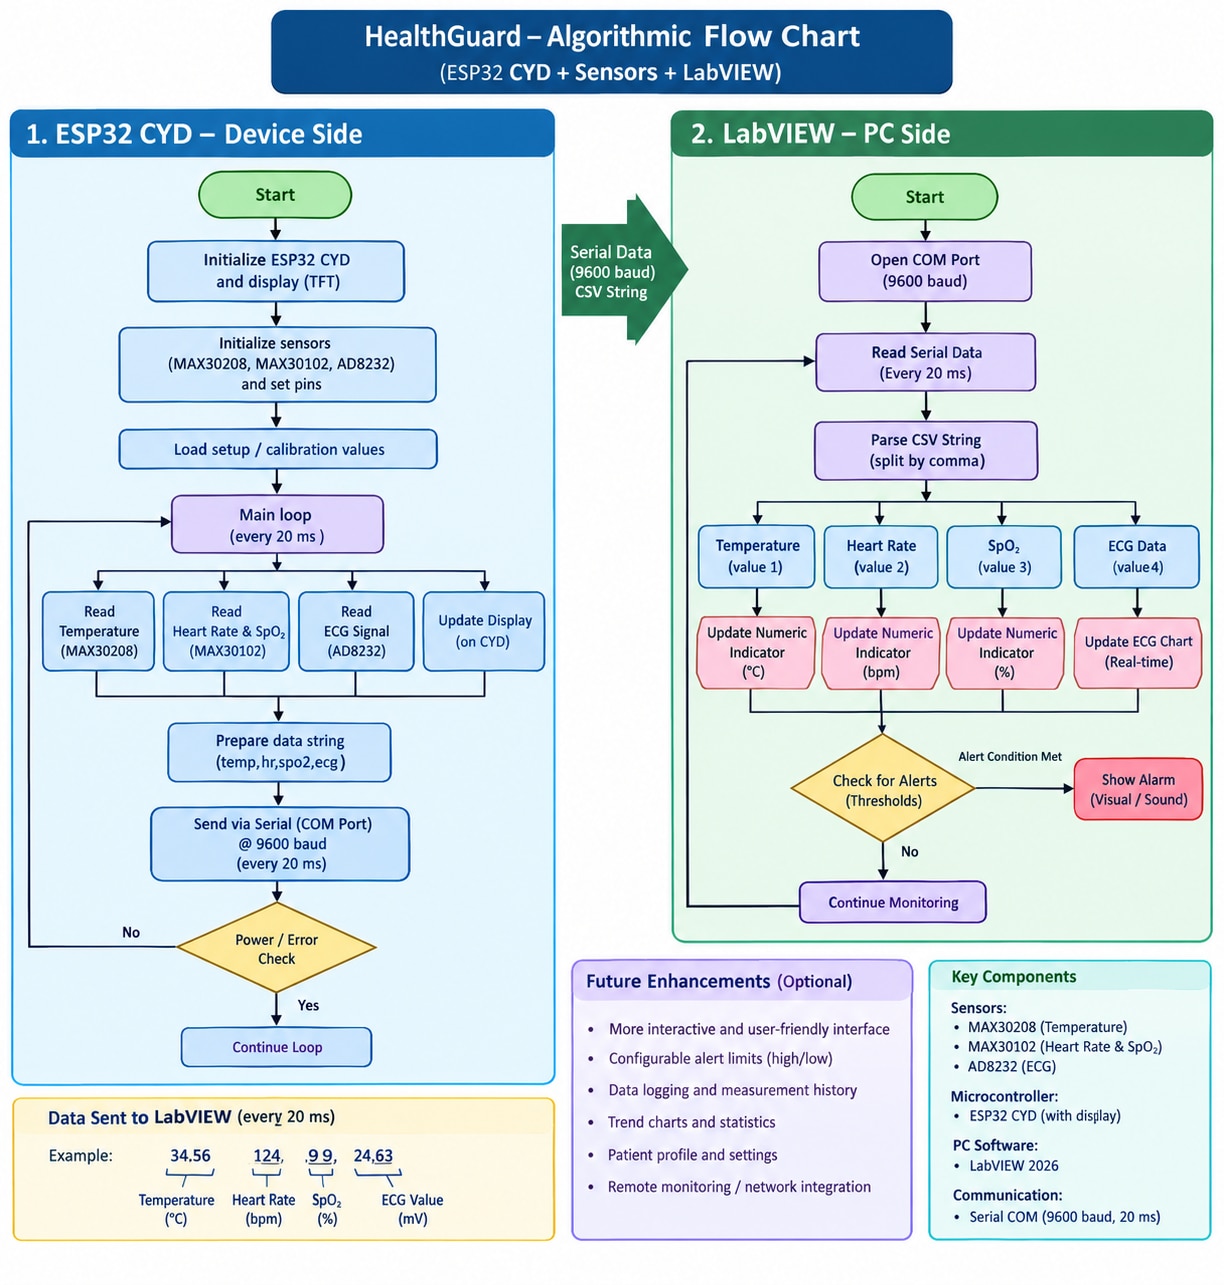
To interface HealthGuard with LabVIEW, I combined all the sensor readings into a single comma-separated values (CSV) string and sent it to the computer through the ESP32's serial COM port. The data string contains body temperature, heart rate, SpO₂, and the ECG signal value, with each reading separated by a comma. I chose this format because it makes the data simple to transmit and allows LabVIEW to separate each sensor reading easily for individual processing and display.
I configured the ESP32 to transmit the data every 20 milliseconds, providing 50 data updates per second. I selected this interval to obtain a smoother and more continuous ECG waveform on the LabVIEW chart. On the computer, LabVIEW receives the serial data and separates the comma-separated values, allowing each measurement to be displayed using the appropriate indicator. The body temperature, heart rate, and SpO₂ readings are displayed using numerical and meter indicators, while the ECG signal is plotted continuously on a real-time chart. This approach allows me to monitor all four measurements on the computer while the CYD module displays the health data locally.
The Algorithmic Flow Chart:
The Full Arduino Code:
#include <TFT_eSPI.h>
#include <SPI.h>
#include <Wire.h>
#include <math.h>

#include "MAX30105.h"
#include "spo2_algorithm.h"
#include "MAX30208.h"

// --------------------------------------------------
// Display and sensors
// --------------------------------------------------

TFT_eSPI tft = TFT_eSPI();
MAX30105 particleSensor;
MAX30208_Class tempSensor;

// --------------------------------------------------
// CYD display configuration
// --------------------------------------------------

const int SCREEN_W = 320;
const int SCREEN_H = 240;

const int TOP_H = 100;
const int ECG_TOP = 112;
const int ECG_BOTTOM = 232;
const int ECG_H = ECG_BOTTOM - ECG_TOP;

// --------------------------------------------------
// Shared I2C bus
// --------------------------------------------------

#define SDA_PIN 27
#define SCL_PIN 22

// --------------------------------------------------
// MAX30208 temperature sensor
// --------------------------------------------------

#define TEMP_I2C_ADDRESS 0x50

bool max30208OK = false;
bool hasValidTemperature = false;

float temperature = 0.0;

// --------------------------------------------------
// MAX30102 heart rate and SpO2
// --------------------------------------------------

#define BUFFER_SIZE 100

uint32_t irBuffer[BUFFER_SIZE];
uint32_t redBuffer[BUFFER_SIZE];

int bufferIndex = 0;

int32_t calculatedSpO2 = 0;
int8_t validSPO2 = 0;

int32_t calculatedHeartRate = 0;
int8_t validHeartRate = 0;

bool max30102OK = false;

int heartRate = 0;
int spo2 = 0;

bool hasValidHeartRate = false;
bool hasValidSpO2 = false;

// --------------------------------------------------
// AD8232 ECG configuration
// --------------------------------------------------

#define ECG_PIN 35
#define ECG_LO_MINUS_PIN 17
#define ECG_LO_PLUS_PIN 16

const unsigned long ECG_INTERVAL = 20;

int ecgX = 1;
int previousY = (ECG_TOP + ECG_BOTTOM) / 2;

unsigned long lastECGUpdate = 0;

bool previousLeadOff = false;
bool leadStatusInitialized = false;

// Approximate ADC input voltage for serial output
float ecgVoltage = 0.0;

// --------------------------------------------------
// LabVIEW serial configuration
// --------------------------------------------------

const unsigned long SERIAL_INTERVAL = 20;
unsigned long lastSerialUpdate = 0;

// --------------------------------------------------
// Display colors
// --------------------------------------------------

#define BG_COLOR      TFT_BLACK
#define TEMP_COLOR    TFT_YELLOW
#define HR_COLOR      TFT_GREEN
#define SPO2_COLOR    TFT_CYAN
#define ECG_COLOR     TFT_GREEN
#define GRID_COLOR    0x2104
#define DIVIDER_COLOR TFT_WHITE

// --------------------------------------------------
// Draw the original static display layout
// Called once during setup.
// --------------------------------------------------

void drawVitals() {
  tft.fillRect(0, 0, SCREEN_W, TOP_H, BG_COLOR);

  // Heading
  tft.setTextColor(TFT_WHITE, BG_COLOR);
  tft.setTextSize(2);
  tft.setCursor(95, 5);
  tft.print("HEALTH GUARD");

  const int colX[] = {18, 146, 264};

  // Temperature label
  tft.setTextColor(TEMP_COLOR, BG_COLOR);
  tft.setTextSize(1);
  tft.setCursor(colX[0], 37);
  tft.print("TEMP");

  // Heart rate label
  tft.setTextColor(HR_COLOR, BG_COLOR);
  tft.setTextSize(1);
  tft.setCursor(colX[1], 37);
  tft.print("HEART RATE");

  // SpO2 label
  tft.setTextColor(SPO2_COLOR, BG_COLOR);
  tft.setTextSize(1);
  tft.setCursor(colX[2], 37);
  tft.print("SpO2");

  // Section divider
  tft.drawFastHLine(0, TOP_H, SCREEN_W, DIVIDER_COLOR);

  // ECG heading
  tft.setTextColor(ECG_COLOR, BG_COLOR);
  tft.setTextSize(1);
  tft.setCursor(8, 104);
  tft.print("ECG  |  AD8232 LIVE SIGNAL");

  // Draw the initial values
  drawVitalValues();
}

// --------------------------------------------------
// Update only the numerical value regions.
// This avoids clearing the entire upper display,
// reducing flicker without changing the layout.
// --------------------------------------------------

void drawVitalValues() {
  const int colX[] = {18, 146, 264};

  // Temperature value and unit
  tft.fillRect(18, 51, 120, 25, BG_COLOR);

  tft.setTextColor(TEMP_COLOR, BG_COLOR);
  tft.setTextSize(2);
  tft.setCursor(colX[0], 53);

  if (hasValidTemperature) {
    tft.print(temperature, 1);
  } else {
    tft.print("--");
  }

  tft.setTextSize(1);
  tft.print(" C");

  // Heart rate value and unit
  tft.fillRect(146, 51, 110, 25, BG_COLOR);

  tft.setTextColor(HR_COLOR, BG_COLOR);
  tft.setTextSize(2);
  tft.setCursor(colX[1], 53);

  if (hasValidHeartRate) {
    tft.print(heartRate);
  } else {
    tft.print("--");
  }

  tft.setTextSize(1);
  tft.print(" BPM");

  // SpO2 value and unit
  tft.fillRect(264, 51, 56, 25, BG_COLOR);

  tft.setTextColor(SPO2_COLOR, BG_COLOR);
  tft.setTextSize(2);
  tft.setCursor(colX[2], 53);

  if (hasValidSpO2) {
    tft.print(spo2);
  } else {
    tft.print("--");
  }

  tft.setTextSize(1);
  tft.print(" %");
}

// --------------------------------------------------
// Draw ECG grid
// --------------------------------------------------

void drawECGGrid() {
  tft.fillRect(
    0, ECG_TOP, SCREEN_W,
    ECG_BOTTOM - ECG_TOP + 1, BG_COLOR
  );

  for (int y = ECG_TOP; y <= ECG_BOTTOM; y += 20) {
    tft.drawFastHLine(0, y, SCREEN_W, GRID_COLOR);
  }

  for (int x = 0; x < SCREEN_W; x += 20) {
    tft.drawFastVLine(x, ECG_TOP, ECG_H, GRID_COLOR);
  }
}

// --------------------------------------------------
// Show lead-off warning
// --------------------------------------------------

void showLeadOffWarning() {
  tft.fillRect(
    0, ECG_TOP, SCREEN_W,
    ECG_BOTTOM - ECG_TOP + 1, BG_COLOR
  );

  tft.setTextColor(TFT_RED, BG_COLOR);
  tft.setTextSize(2);
  tft.setCursor(76, 150);
  tft.print("LEADS OFF");

  tft.setTextColor(TFT_WHITE, BG_COLOR);
  tft.setTextSize(1);
  tft.setCursor(42, 180);
  tft.print("Check ECG electrodes and cables");
}

// --------------------------------------------------
// Read and plot real AD8232 ECG
// --------------------------------------------------

void updateECG() {
  unsigned long now = millis();

  if (now - lastECGUpdate < ECG_INTERVAL) {
    return;
  }

  lastECGUpdate = now;

  bool leadOff =
    (digitalRead(ECG_LO_MINUS_PIN) == HIGH) ||
    (digitalRead(ECG_LO_PLUS_PIN) == HIGH);

  // Detect lead connection changes
  if (!leadStatusInitialized || leadOff != previousLeadOff) {
    leadStatusInitialized = true;
    previousLeadOff = leadOff;

    if (leadOff) {
      showLeadOffWarning();
      ecgVoltage = -1.0;
      return;
    } else {
      drawECGGrid();
      ecgX = 1;
      previousY = (ECG_TOP + ECG_BOTTOM) / 2;
    }
  }

  if (leadOff) {
    ecgVoltage = -1.0;
    return;
  }

  // Read actual ECG analog output
  int rawValue = analogRead(ECG_PIN);

  // Approximate voltage based on a 12-bit ADC and 3.3 V range.
  // This is not a calibrated ECG voltage measurement.
  ecgVoltage = (rawValue * 3.3f) / 4095.0f;

  // Wrap at the right edge
  if (ecgX >= SCREEN_W) {
    ecgX = 0;
    previousY = (ECG_TOP + ECG_BOTTOM) / 2;
    drawECGGrid();
  }

  // Clear current column and restore grid
  tft.drawFastVLine(ecgX, ECG_TOP, ECG_H, BG_COLOR);

  if ((ecgX % 20) == 0) {
    tft.drawFastVLine(ecgX, ECG_TOP, ECG_H, GRID_COLOR);
  }

  for (int y = ECG_TOP; y <= ECG_BOTTOM; y += 20) {
    tft.drawPixel(ecgX, y, GRID_COLOR);
  }

  const int centerY = (ECG_TOP + ECG_BOTTOM) / 2;
  const int ADC_CENTER = 2048;
  const int ECG_SCALE = 25;

  int currentY =
    centerY - (rawValue - ADC_CENTER) / ECG_SCALE;

  currentY = constrain(
    currentY,
    ECG_TOP + 3,
    ECG_BOTTOM - 3
  );

  tft.drawLine(
    ecgX - 1, previousY,
    ecgX, currentY,
    ECG_COLOR
  );

  previousY = currentY;
  ecgX++;
}

// --------------------------------------------------
// Read MAX30208 temperature
// --------------------------------------------------

void updateTemperature() {
  if (!max30208OK) {
    return;
  }

  uint8_t mask = tempSensor.getINT();

  if (mask & MAX30208_INT_STATUS_TEMP_RDY) {
    tempSensor.check();

    float newTemperature = tempSensor.readTemperature();

    if (isfinite(newTemperature) &&
        newTemperature >= -20.0 &&
        newTemperature <= 100.0) {

      temperature = newTemperature;
      hasValidTemperature = true;

      // Update values only; do not redraw the whole display.
      drawVitalValues();
    }

    tempSensor.startConvert();
  }
}

// --------------------------------------------------
// Read MAX30102 heart rate and SpO2
// --------------------------------------------------

void updateMAX30102() {
  if (!max30102OK) {
    return;
  }

  particleSensor.check();

  while (particleSensor.available()) {
    redBuffer[bufferIndex] = particleSensor.getRed();
    irBuffer[bufferIndex] = particleSensor.getIR();

    particleSensor.nextSample();

    bufferIndex++;

    if (bufferIndex >= BUFFER_SIZE) {
      maxim_heart_rate_and_oxygen_saturation(
        irBuffer,
        BUFFER_SIZE,
        redBuffer,
        &calculatedSpO2,
        &validSPO2,
        &calculatedHeartRate,
        &validHeartRate
      );

      bool displayChanged = false;

      if (validHeartRate &&
          calculatedHeartRate > 0 &&
          calculatedHeartRate <= 250) {

        heartRate = (int)calculatedHeartRate;
        hasValidHeartRate = true;
        displayChanged = true;
      }

      if (validSPO2 &&
          calculatedSpO2 >= 0 &&
          calculatedSpO2 <= 100) {

        spo2 = (int)calculatedSpO2;
        hasValidSpO2 = true;
        displayChanged = true;
      }

      if (displayChanged) {
        // Update only the numbers, not the entire upper display.
        drawVitalValues();
      }

      bufferIndex = 0;
    }
  }
}

// --------------------------------------------------
// Send CSV data to LabVIEW every 20 ms
//
// Format:
// temperature,heartRate,spo2,ecgVoltage
//
// Example:
// 34.56,124,99,1.63
//
// -1 indicates an unavailable reading.
// Each record ends with Line Feed.
// --------------------------------------------------

void sendLabVIEWData() {
  unsigned long now = millis();

  if (now - lastSerialUpdate < SERIAL_INTERVAL) {
    return;
  }

  lastSerialUpdate = now;

  if (hasValidTemperature) {
    Serial.print(temperature, 2);
  } else {
    Serial.print("-1.00");
  }

  Serial.write(',');

  if (hasValidHeartRate) {
    Serial.print(heartRate);
  } else {
    Serial.print("-1");
  }

  Serial.write(',');

  if (hasValidSpO2) {
    Serial.print(spo2);
  } else {
    Serial.print("-1");
  }

  Serial.write(',');

  Serial.print(ecgVoltage, 2);
  Serial.write('\n');
}

// --------------------------------------------------
// Setup
// --------------------------------------------------

void setup() {
  // Serial is reserved for LabVIEW CSV data only.
  Serial.begin(9600);

  // Initialize display
  tft.init();
  tft.setRotation(3);
  tft.fillScreen(BG_COLOR);

  drawVitals();
  drawECGGrid();

  // Initialize AD8232
  pinMode(ECG_LO_MINUS_PIN, INPUT);
  pinMode(ECG_LO_PLUS_PIN, INPUT);
  analogReadResolution(12);

  // Initialize I2C bus once for both sensors
  Wire.begin(SDA_PIN, SCL_PIN);

  // Initialize MAX30208 at fixed address 0x50
  tempSensor.begin(Wire, TEMP_I2C_ADDRESS);
  tempSensor.enableDATARDY();
  tempSensor.startConvert();

  max30208OK = true;

  // Initialize MAX30102
  if (particleSensor.begin(Wire, I2C_SPEED_FAST)) {
    particleSensor.setup(
      60,    // LED brightness
      4,     // Sample average
      2,     // Red + IR
      100,   // Sample rate
      411,   // Pulse width
      4096   // ADC range
    );

    particleSensor.setPulseAmplitudeRed(0x3F);
    particleSensor.setPulseAmplitudeIR(0x3F);
    particleSensor.setPulseAmplitudeGreen(0);

    max30102OK = true;
  }

  lastECGUpdate = millis();
  lastSerialUpdate = millis();
}

// --------------------------------------------------
// Main loop
// --------------------------------------------------

void loop() {
  updateMAX30102();
  updateTemperature();
  updateECG();
  sendLabVIEWData();
}
3D Enclosure Design
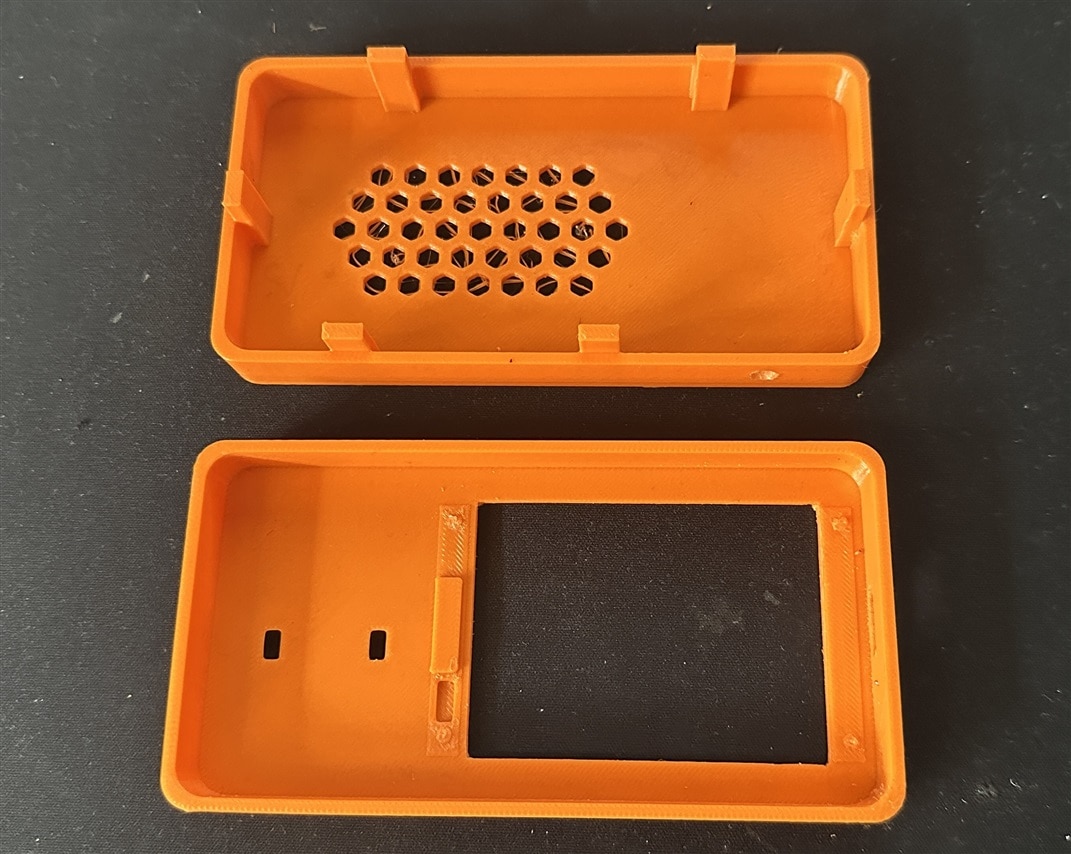
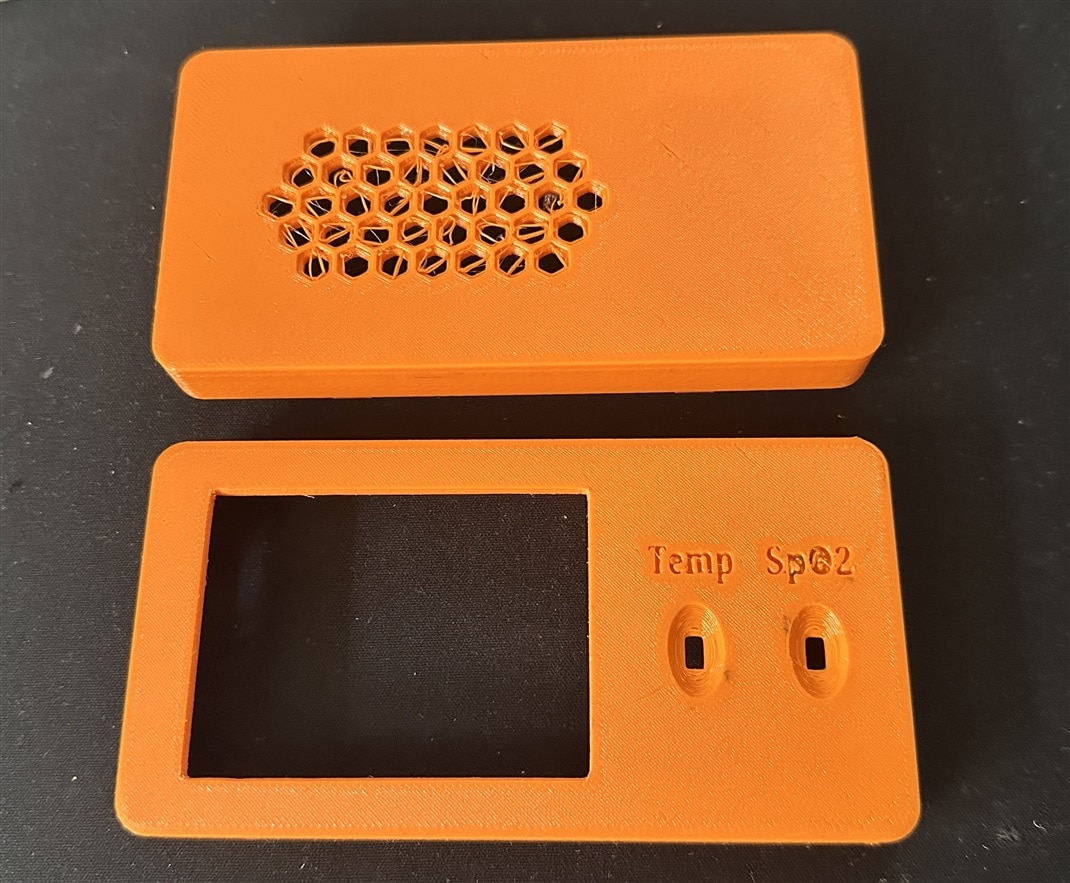
To make HealthGuard compact, portable, and convenient to use, I designed a custom enclosure using 3D printing. The enclosure consists of two main parts: a top cover and a bottom base. The top part holds the CYD module and its display, allowing users to view the health measurements and ECG waveform easily. I also designed specific openings in the top cover to accommodate the body temperature sensor and the SpO₂ sensor. In addition, I created an oval-shaped curved section to provide a comfortable space for placing a finger on the SpO₂ sensor during measurement. These features help position the sensors conveniently and make the device easier to use.
The bottom part serves as the base and provides space for the electronic components, wiring, and other connections. This two-part design makes assembly easier and allows access to the internal components for maintenance or future modifications. I customized the enclosure dimensions and internal layout to fit the hardware properly while keeping the device neat and organized. Overall, the 3D-printed enclosure gives HealthGuard a compact and practical form, making it easier to carry, handle, and use for preliminary health monitoring.
The following photos show the 3D-printed parts.
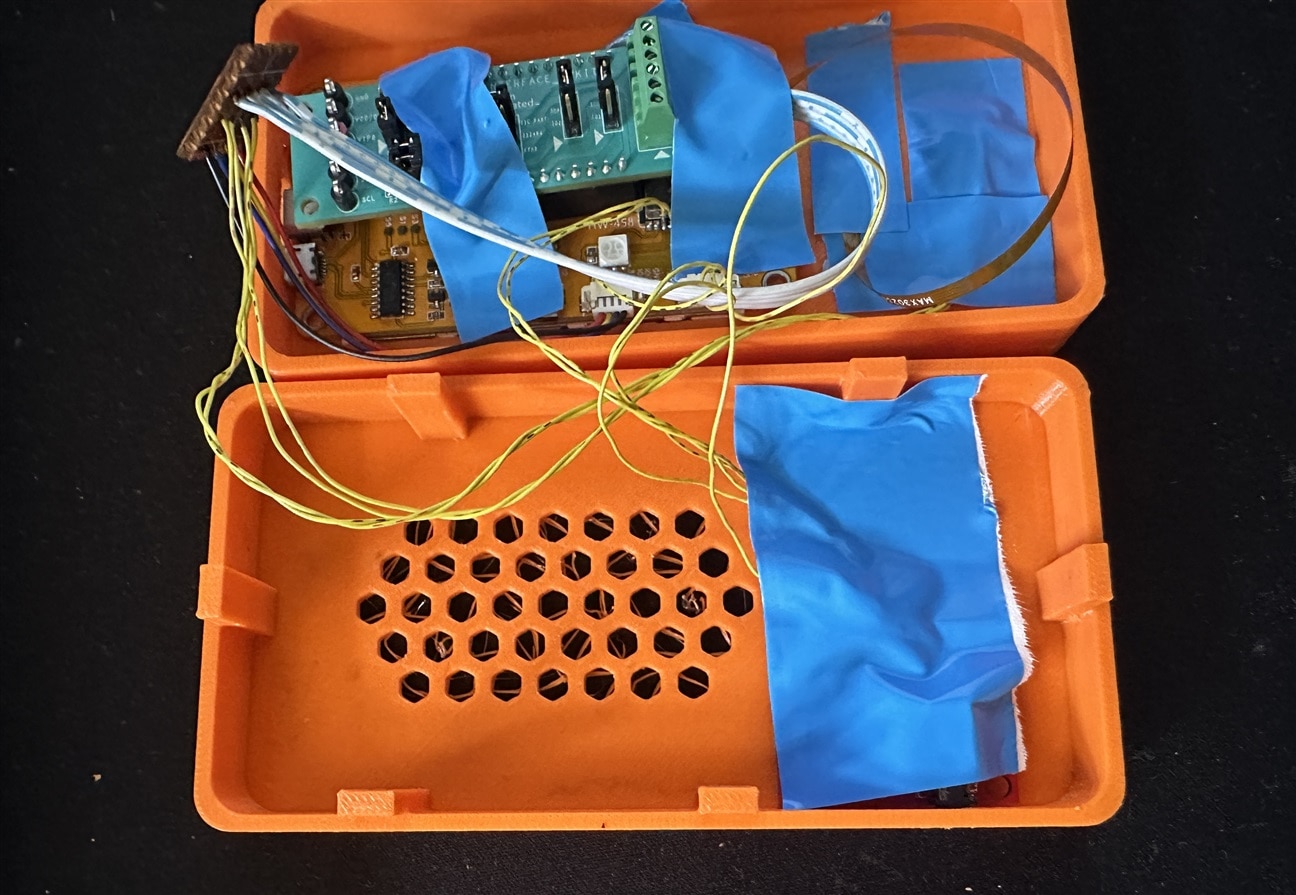
The inner sides:
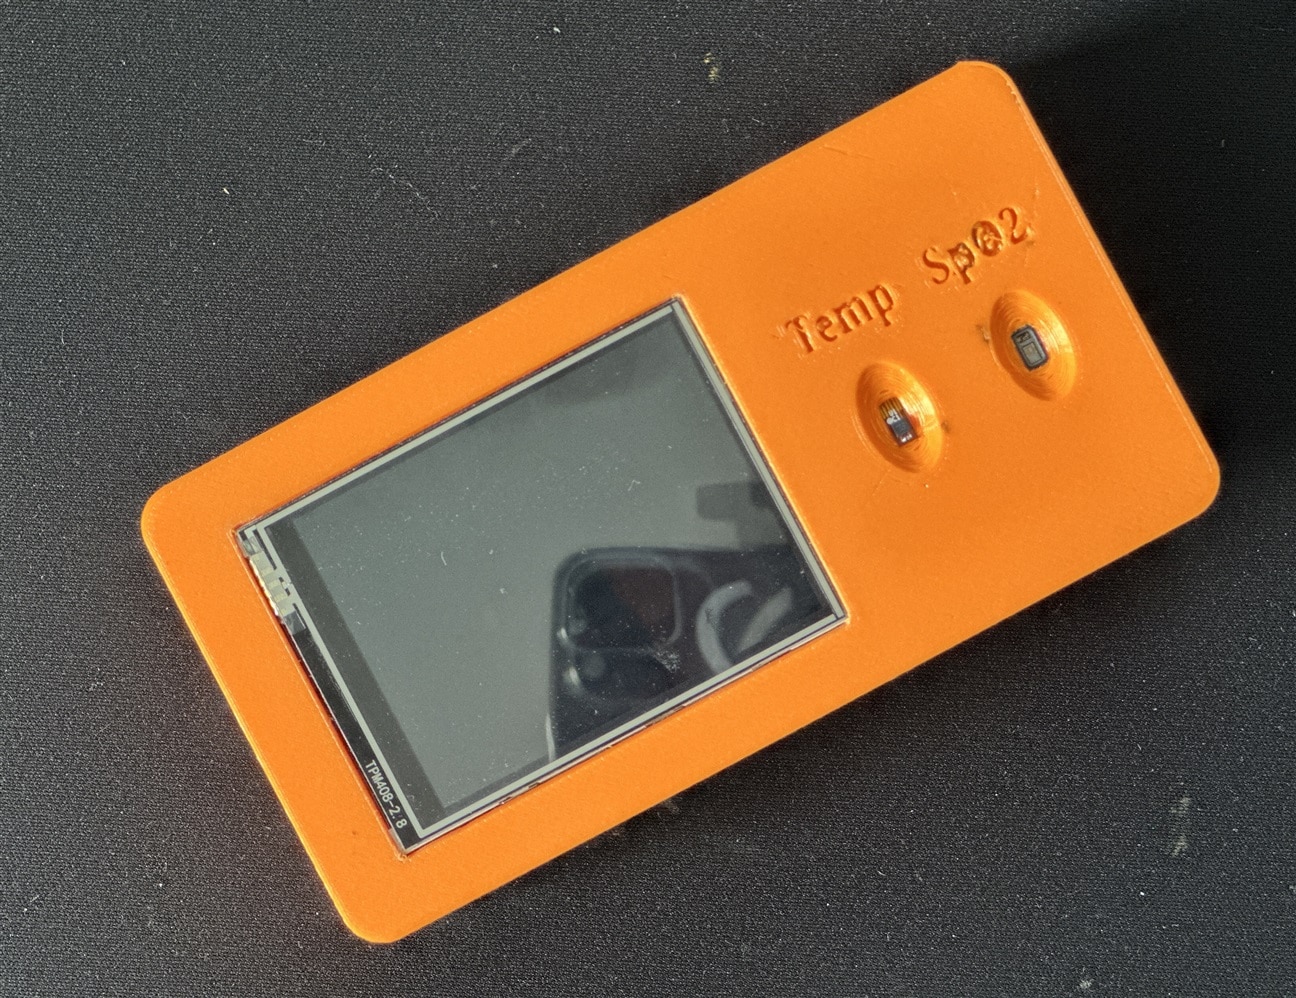
The outer sides:
The design files are attached below.
2678.healthguard_case_bottom.stl
Hardware Assembling
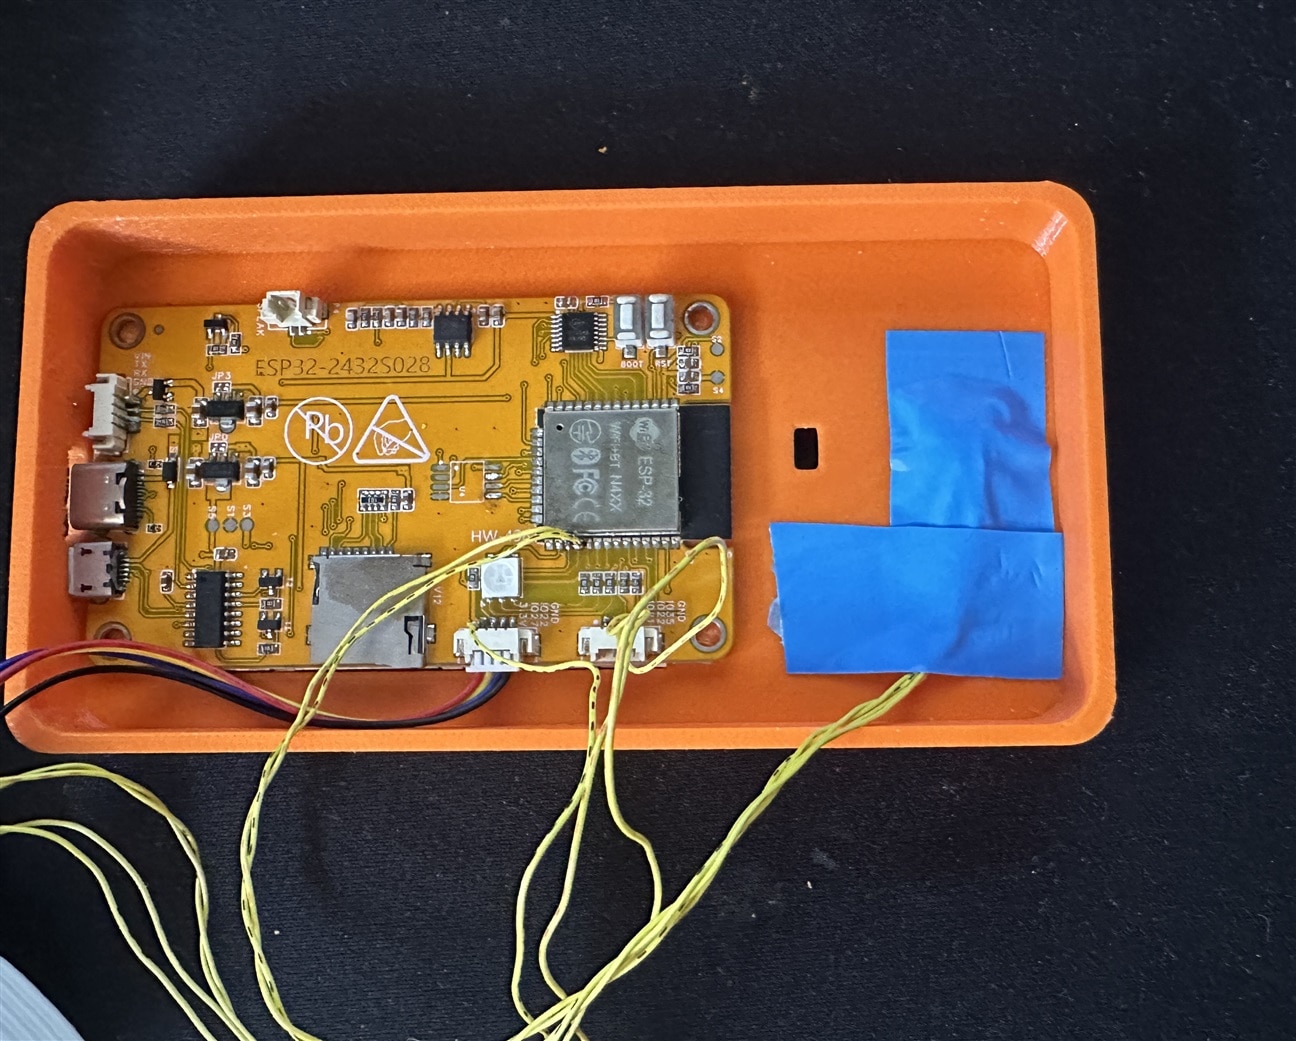
After completing all the soldering work and 3D-printing the enclosure, I started assembling the hardware components inside the case. First, I placed the ESP32-based CYD module in its designated position in the top part of the enclosure. I made sure that the display was properly aligned with the opening so that all the measurements and the ECG waveform would be clearly visible.
Next, I positioned the MAXREFDES117 SpO₂ sensor module in the rightmost opening of the enclosure. This opening allows users to place their finger on the sensor for measurement. To secure the MAX30102 SpO₂ module in place, I used 3M EM25TP-0050 EMI absorber tape. Besides helping to hold the module in position, this material is designed to absorb or manage electromagnetic interference (EMI) in certain frequency ranges. I included it as an additional measure to explore whether it could help reduce unwanted electromagnetic interference affecting the sensor readings. However, I did not have enough time to test its effectiveness in this particular setup, so I cannot confirm whether it improved the measurement quality. Finally, I checked the component positions and wiring to ensure that everything fitted properly inside the enclosure.
As the second step, I placed the MAX30208 temperature sensor in its designated opening in the enclosure. I carefully positioned the sensor to ensure that it fitted properly in the available space. To secure it in place, I again used 3M EM25TP-0050 EMI absorber tape. The tape helped hold the sensor assembly in its intended position and kept it from moving inside the enclosure. I used the same material for both sensor modules to maintain a consistent mounting approach. However, the tape's primary role in this step was to secure the sensor, and I did not conduct separate tests to determine whether it reduced electromagnetic interference or affected the temperature measurement accuracy.
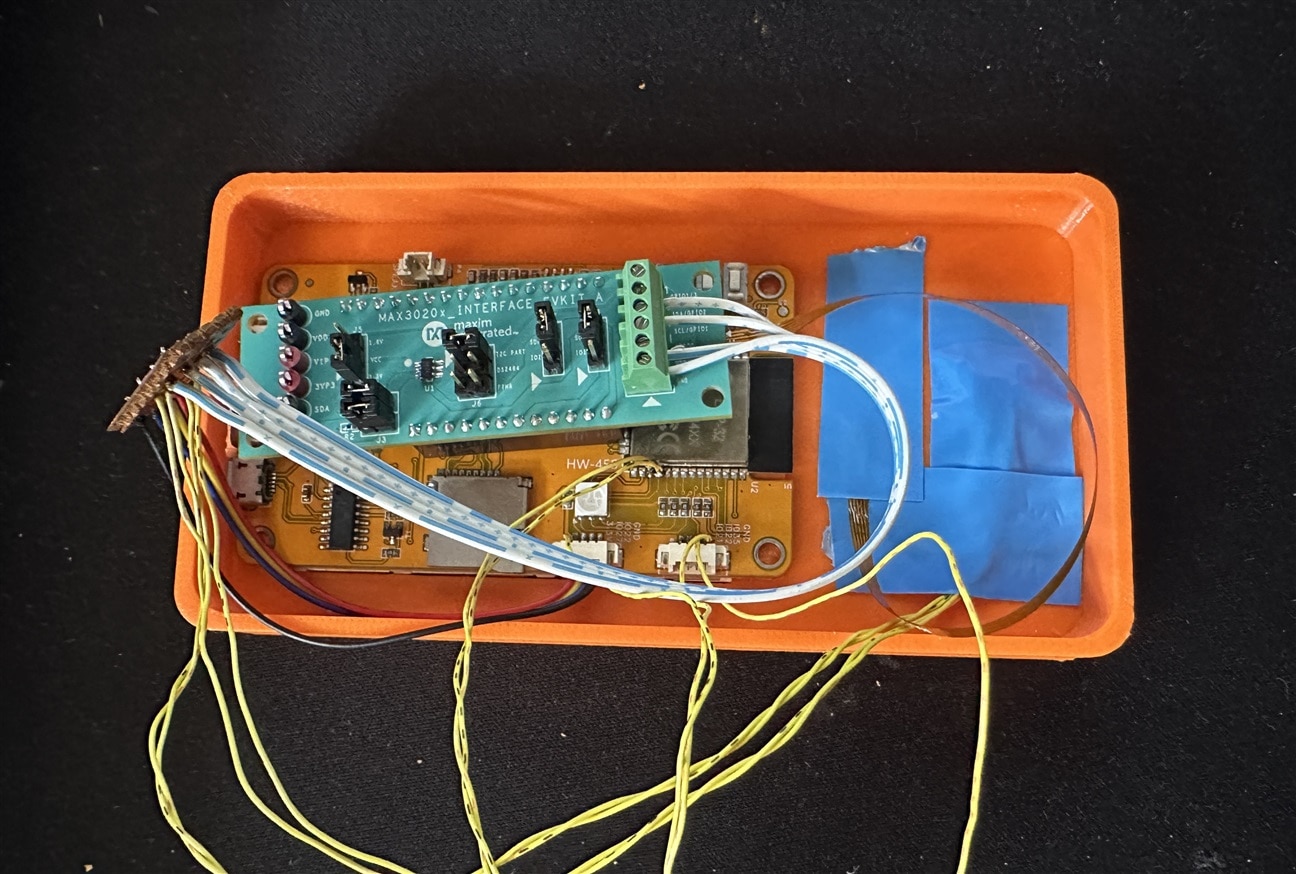
Next, I placed the Analog Devices MAX30208EVSYS# Evaluation Kit above the ESP32-based CYD board, positioning it carefully to fit within the enclosure. I used adhesive tape to secure the evaluation kit in place and prevent it from moving during handling. This arrangement helped me keep the components compact and organized inside the 3D-printed case. I also checked the sensor wiring to ensure that the connections remained secure and that the tape did not interfere with the electrical connections or the operation of the temperature sensor.
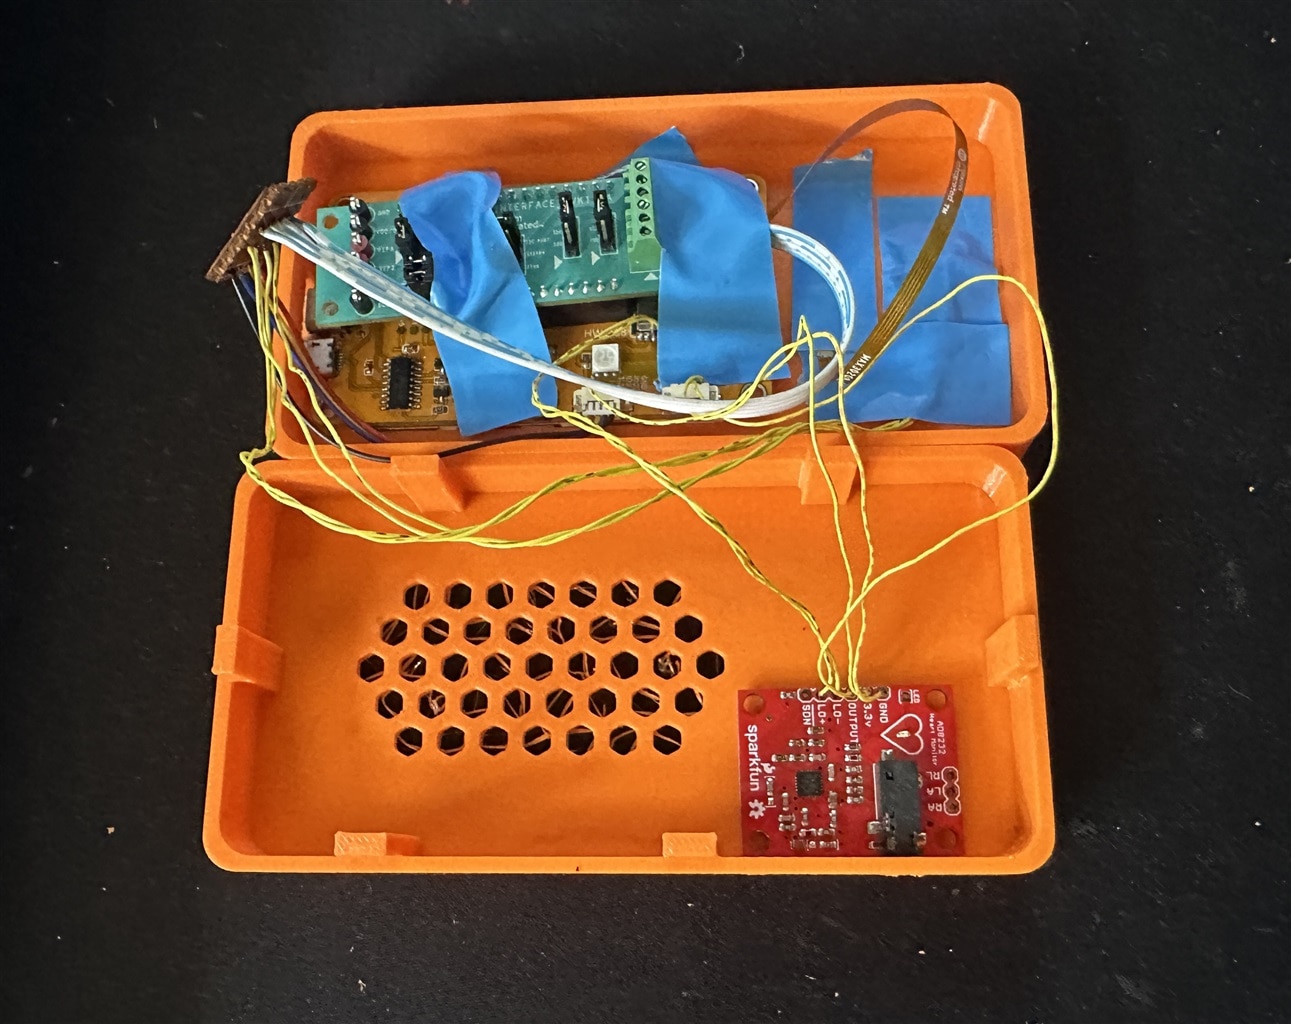
Finally, I placed the AD8232 ECG sensor module in its designated position in the bottom part of the enclosure. ECG signals are very small and can be affected by electrical noise from nearby electronic components. The ESP32-based CYD module includes a buck converter in its power circuit, which may generate electromagnetic interference (EMI) and potentially affect the quality of the ECG signal. To explore a possible way to reduce this interference, I covered the AD8232 module with 3M EM25TP-0050 EMI absorber tape. I hoped that the tape might help reduce unwanted electromagnetic interference and improve the stability of the ECG waveform. However, I could not conduct proper tests to verify its effectiveness because of time limitations. Therefore, further experiments are needed to determine whether the tape reduces noise in this particular arrangement. Other factors, such as power-supply noise, electrode contact, and wire routing, may also affect the ECG signal quality.
The following image shows the completed project after finishing all the assembly work.
LabVIEW Interfacing
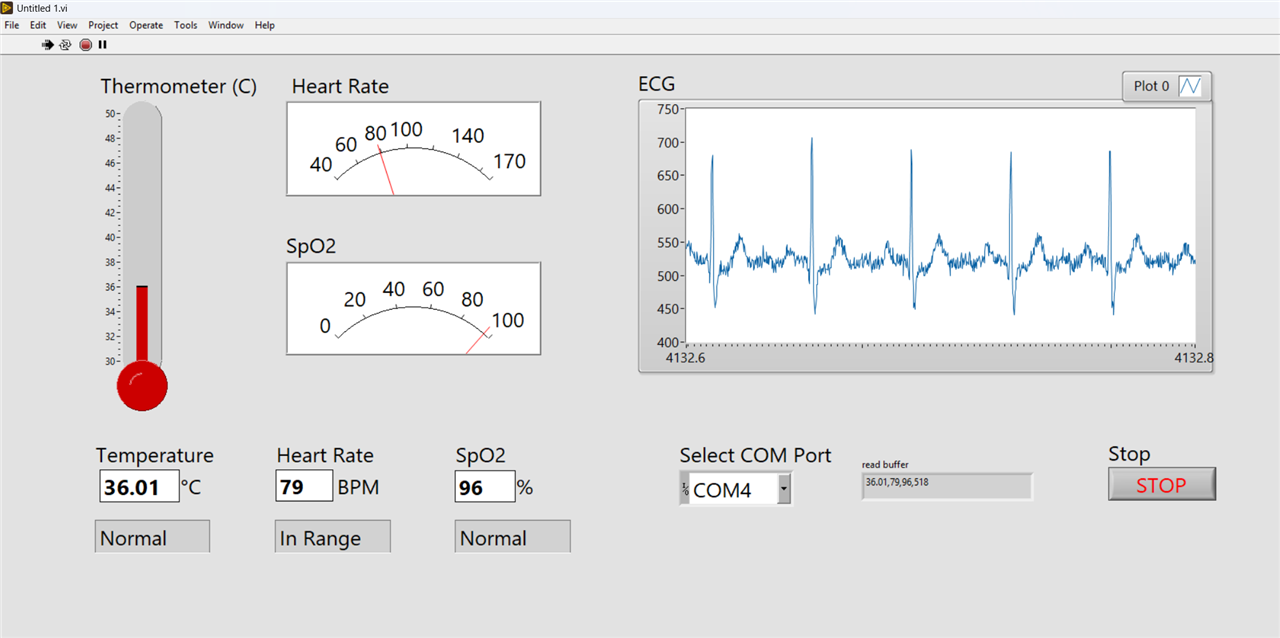
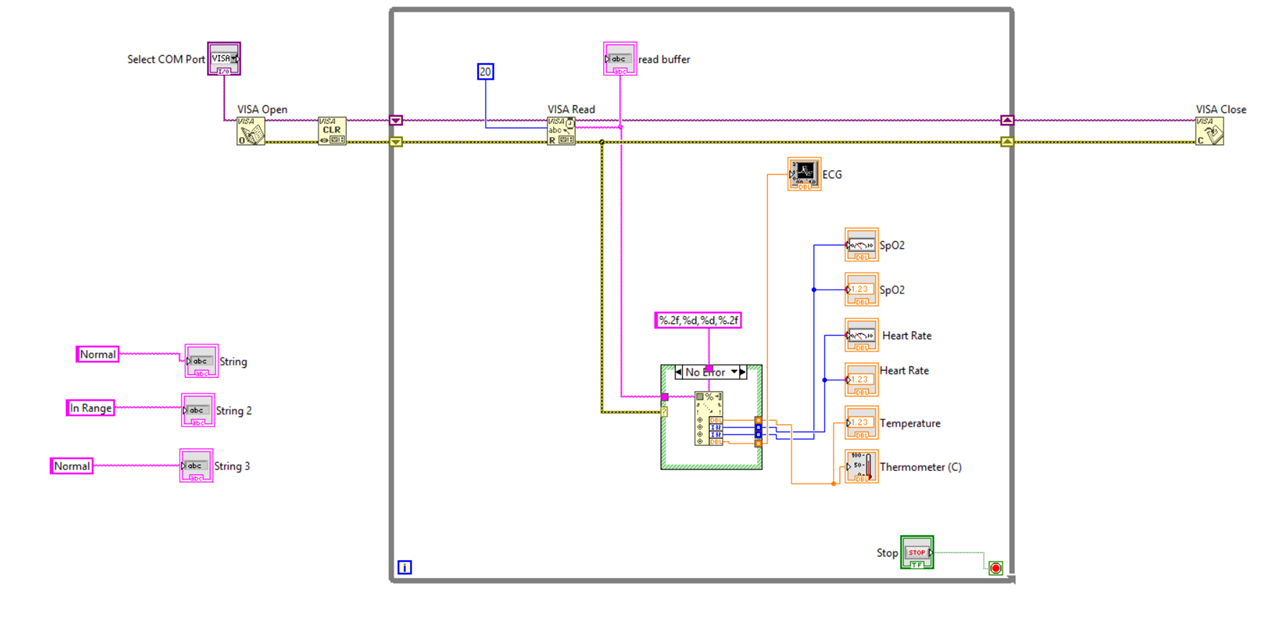
The HealthGuard project also includes a LabVIEW interface that allows me to monitor the sensor readings on a computer and generate useful alerts based on the measured values. The ESP32-based CYD module sends all four measurements—body temperature, heart rate, SpO₂, and ECG signal—as a single comma-separated values (CSV) string through the serial COM port. The data is transmitted every 20 milliseconds to support smooth, real-time visualization of the ECG waveform. On the computer, LabVIEW receives the data through the COM port and separates the individual readings using the commas as delimiters. Each value is then displayed in its corresponding indicator. I use numerical and meter indicators to display body temperature, heart rate, and SpO₂, while the ECG signal is plotted on a real-time chart. This interface makes it easier to observe changes in the measurements and provides a foundation for generating alerts when readings fall outside selected limits.
The following screenshot shows the simple LabVIEW interface of my project.
For demonstration purposes, I designed a simple LabVIEW interface to display the sensor readings and visualize the ECG waveform in real time. The current interface provides the basic monitoring features needed to demonstrate how HealthGuard works. However, there is plenty of room for further improvement. In a future update, I would like to develop a more interactive and user-friendly interface with improved data visualization, configurable health alerts, data logging, and measurement history. These features could make the system more useful for monitoring health measurements over time and help users understand changes in the collected data.
Below is the block view:
Watch the simple Demo Video of my Project:
Top Comments
-

shabaz
-
Cancel
-
Vote Up
0
Vote Down
-
-
Sign in to reply
-
More
-
Cancel
Comment-

shabaz
-
Cancel
-
Vote Up
0
Vote Down
-
-
Sign in to reply
-
More
-
Cancel
Children