


I welcome you to my 8th blog as part Summer of Sensors Design Challenge and In the Air Tonight category. In my first blog I described plans as part of competition. In second blog I shown Evaluation Kit of ZMOD4510 Outdoor Air Quality. In third blog I shown software provided for evaluating the sensor. In forth blog I shown how easily integrate this sensor with Renesas RA2L1 Microcontroller. In fifth blog I described my journey when adding Renesas DA16600 Wi-Fi Module to the project for achieving Wi-Fi connectivity, in sixth blog post I described my box and my outdoor deployment of the project. Lastly, in previous seventh blog I describe techniques which I used for reduce power consumption of device which allowed me to collect more data. In this blog post I want to show data which sensor send to the cloud.
Getting Data
I originally plan to make website with plots of data, but because time is running out, I decided to process data manually instead of visualizing them as part of website. I spend more time with Wi-Fi connectivity setup than I expected and now I am in time pressure. Pretty short lifespan of battery makes possible website also less attractive because it will show many gaps in data when battery get drained which is now not a big issue after latest improvements, but this issue is still here. Instead, I decided to render plots manually and adjust their parameters for better visibility of sensor data. At the end I think it is better for analysis of experimentally collected data.
HTTP API and Cloud Database
As far I did not describe how my API process data from device. In fifth blog I only mentioned reasons about format used for data transfers – base64.
I implemented API using ASP.NET Core and write it in C#. It is quite simple webserver with one endpoint: /api/publish_air_quality. It is called using HTTP POST. POST data contains base64 encoded string. Code receive data, decodes base64 string, checks its length and then parse fields. Message contains following fields:
|
Offset |
Data type |
Field type |
Description |
|
0 |
UInt32_t[4] |
Device ID |
32 Byte long Device ID |
|
32 |
UInt16_t |
Date and Time |
Year of date when sample was collected |
|
34 |
UInt8_t |
Date and Time |
Month of date when sample was collected |
|
35 |
UInt8_t |
Date and Time |
Date of date when sample was collected |
|
36 |
UInt8_t |
Date and Time |
Hour of time when sample was collected |
|
37 |
UInt8_t |
Date and Time |
Minute of time when sample was collected |
|
38 |
UInt8_t |
Date and Time |
Second of time when sample was collected |
|
39 |
1 Byte |
|
Reserved (padding) |
|
40 |
Float |
Sensor data |
Ozone level |
|
44 |
UInt8_t |
Sensor data |
Air Quality Index |
|
45 |
UInt8_t |
Sensor data |
Fast Air Quality Index |
|
46 |
2 Byte |
|
Reserved (padding) |
Last padding is for ensuing good length for base64 algorithm.
Web server extract fields from the structure, loads it to the class, pass it to the database controller which later with usage of Azure.Data.Tables library store data to the Azure Cosmos DB database. Cosmos DB is configured with simple Tables API.
Code of the main message processing endpoint look as follows
[HttpPost]
[Route("publish_air_quality")]
public async Task<ActionResult> PublishMeasurement() {
	string requestPayload;

	using (StreamReader sr = new StreamReader(Request.Body)) {
		requestPayload = await sr.ReadToEndAsync();
	}

	byte[] rawData;
	try {
		rawData = Convert.FromBase64String(requestPayload);
	} catch (Exception) {
		return BadRequest();
	}

	if (rawData.Length != 48) {
		return BadRequest();
	}

	UInt32[] deviceId = new UInt32[] {
		BitConverter.ToUInt32(rawData, 0),
		BitConverter.ToUInt32(rawData, 1),
		BitConverter.ToUInt32(rawData, 2),
		BitConverter.ToUInt32(rawData, 3)
	};

	string deviceIdString =
		deviceId[0].ToString("X8") +
		deviceId[1].ToString("X8") +
		deviceId[2].ToString("X8") +
		deviceId[3].ToString("X8");

	UInt16 year = BitConverter.ToUInt16(rawData, 32);
	byte month = rawData[34];
	byte date = rawData[35];
	byte hour = rawData[36];
	byte minute = rawData[37];
	byte second = rawData[38];

	float ozoneLevel = BitConverter.ToSingle(rawData, 40);

	byte airQualityIndex = rawData[44];
	byte fastAirQualityIndex = rawData[45];

	if (month < 1 || month > 12 || date < 1 || date > 31 || hour > 23 || minute > 59 || second > 60) {
		return BadRequest();
	}

	Measurement m = new Measurement();
	m.MeasurementTimeStamp = new DateTime(year, month, date, hour, minute, second, DateTimeKind.Utc);
	m.AirQualityIndex = airQualityIndex;
	m.FastAirQualityIndex = fastAirQualityIndex;
	m.DeviceId = deviceIdString;
	m.OzoneLevel = ozoneLevel;

	try {
		await _storageClient.AddMeasurement(m);
	} catch (Exception) {
		return StatusCode(500);
	}

	return Ok();
}
Downloading Data
For data analysis I wrote program for downloading data (using Azure.Data.Tables library again). Data I formatted to the CSV and imported them to the R environment for plotting.
Results
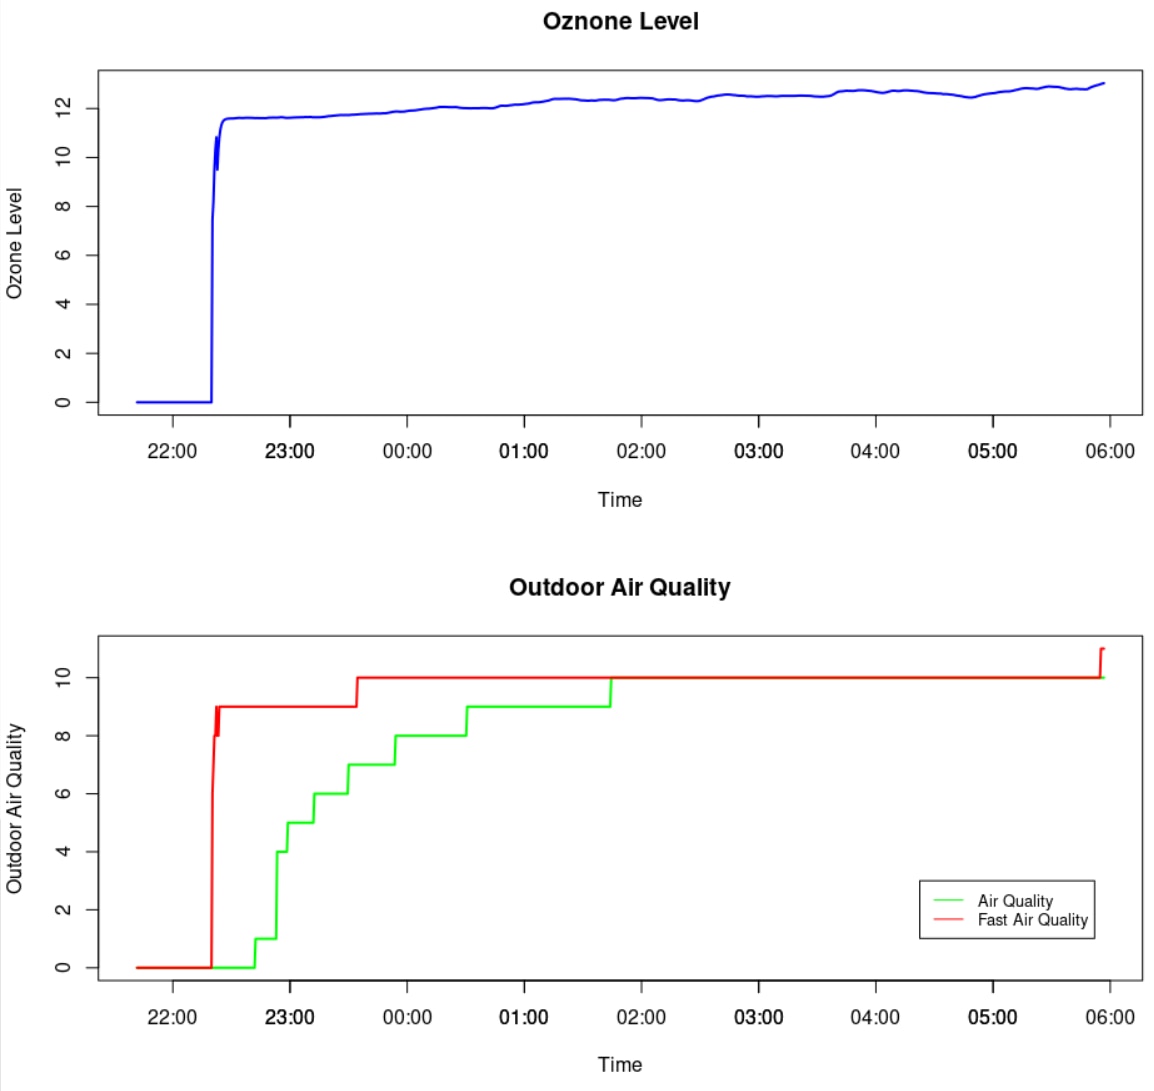
Results from my outdoor measurements are following:
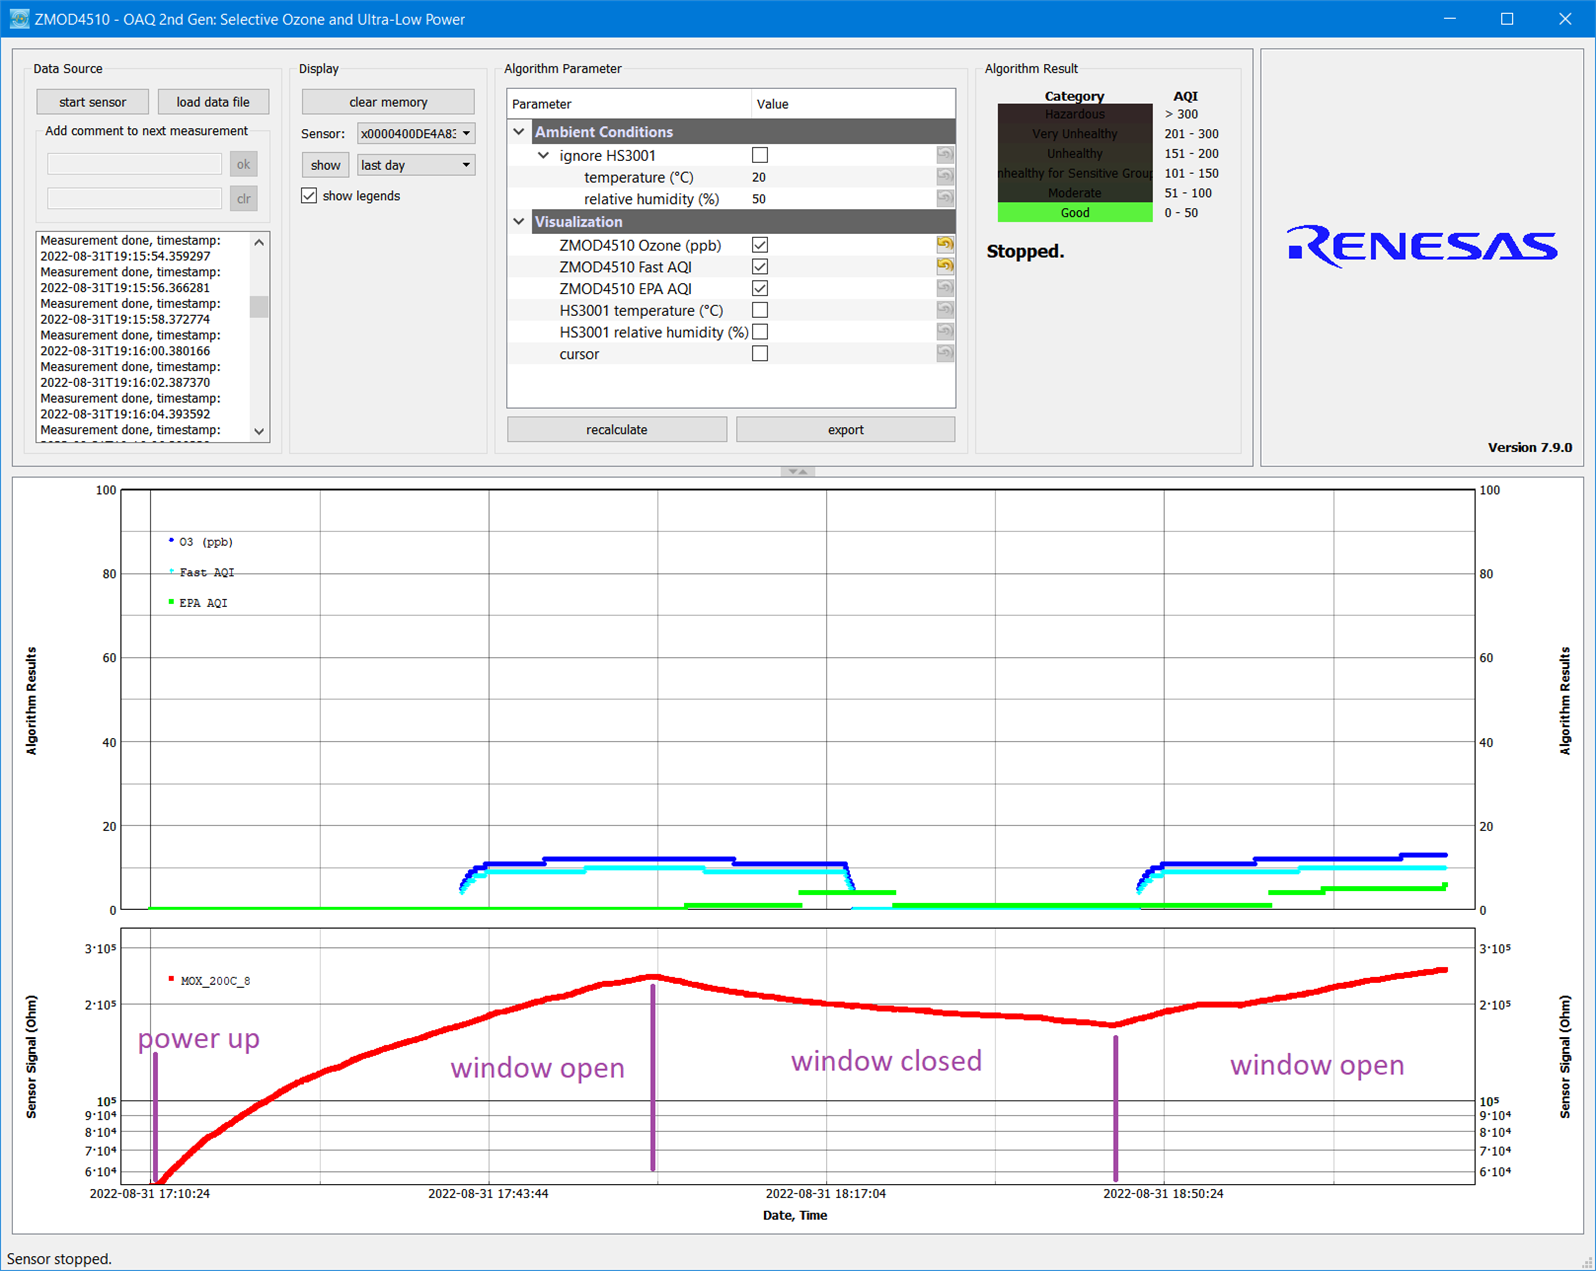
Before I start describing plots let’s look at values which I received from evaluation kit when I was playing with ZMOD4510 for a first time. Following screenshot was already present in second blog. Look at green and light blue lines which corresponds to Air Quality Indexes.
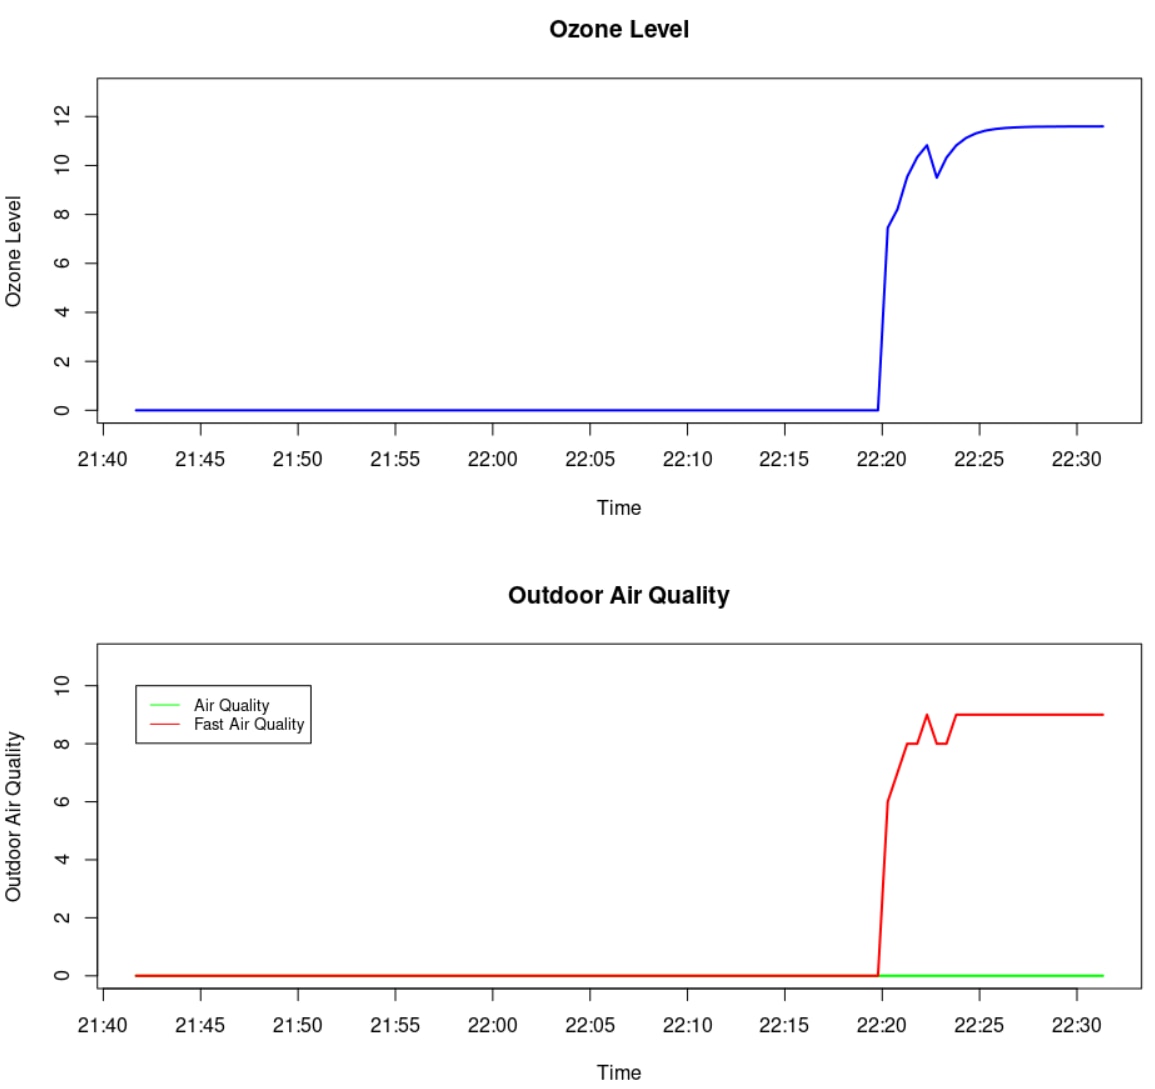
Stabilization
First data come half hour after powerup (or MCU reset) because algorithm need some time to stabilize. It is also mentioned in datasheet.
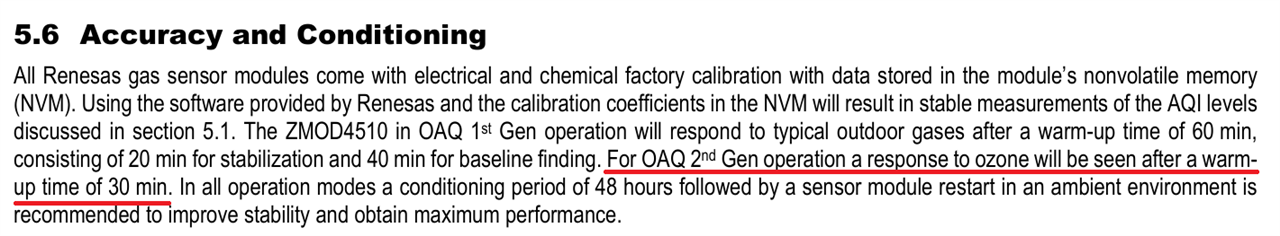
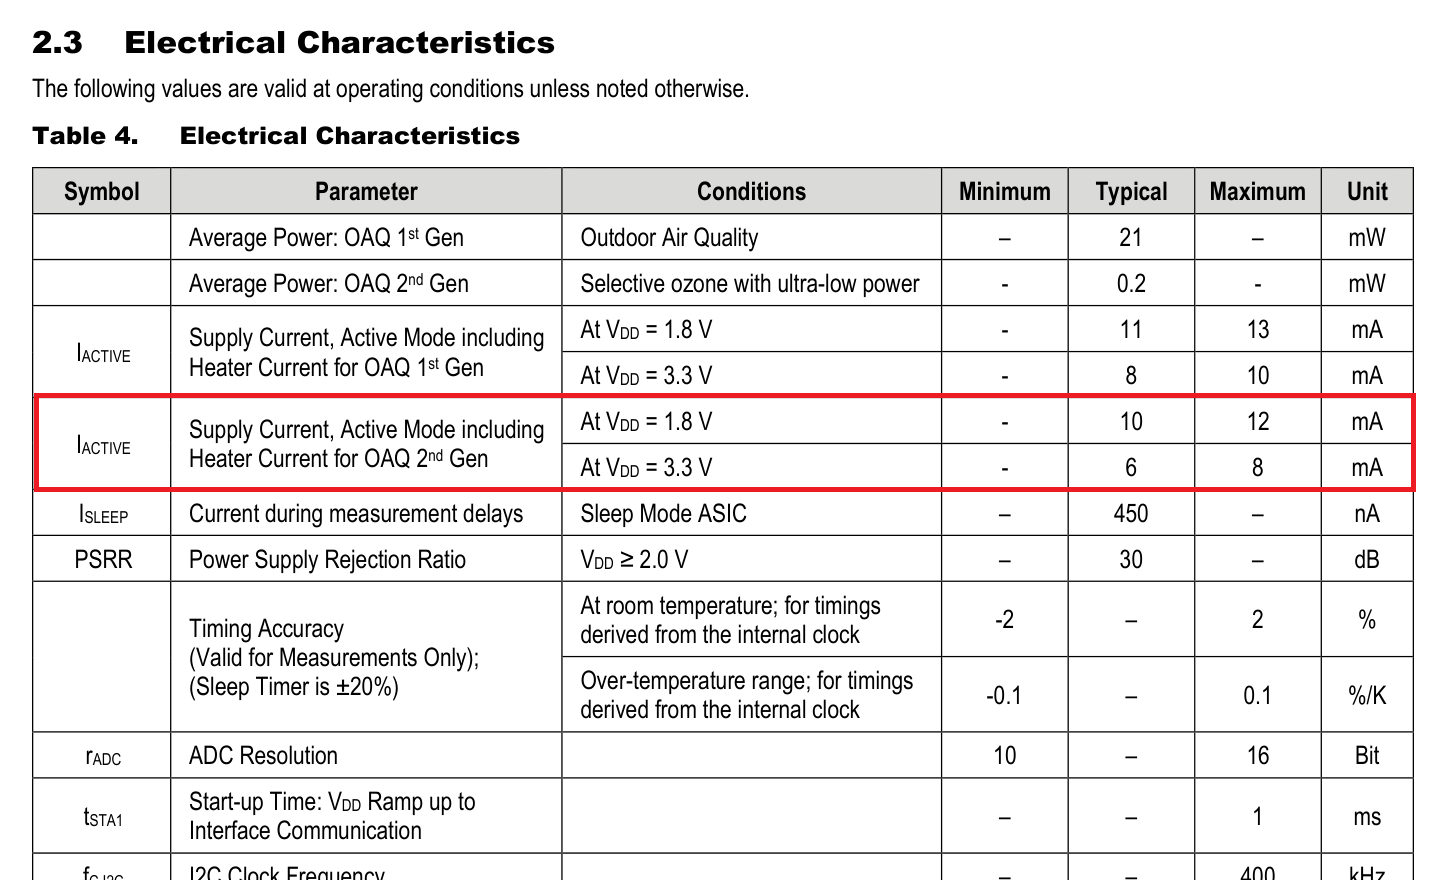
Note the “warm-up” word. I think warming means by heater and I guess it is enabled after powerup (in stabilization phase). If you remember my previous blog when I was analysing power consumption I ended with consumption of about 20 mA (at 3V branch, not right on the battery) and now I think about 6 mA of this consumption was caused by the sensor heater because I was measuring current very soon after I powered device (or flashed new firmware and reset it) and at this time sensor (for half hour) was in stabilization phase. In this phase I guess it enables the heater. Current of 6 mA of the heater is mentioned in sensor datasheet but I never had amperemeter connected so long to check that current decreased after 30 minutes.
After warming-up
Even it had half hour to stabilize it took some time until algorithm start returning non-zero value. For first approx. 40 minutes algorithm returned all values zeroes. The same happened in evaluation software but in evaluation software it took only 30 minutes. Later Air Quality Index quickly grown to about 11 and stabilized at this level. Following plots contains highlighted data for almost two hours after powerup.
What is air quality index?
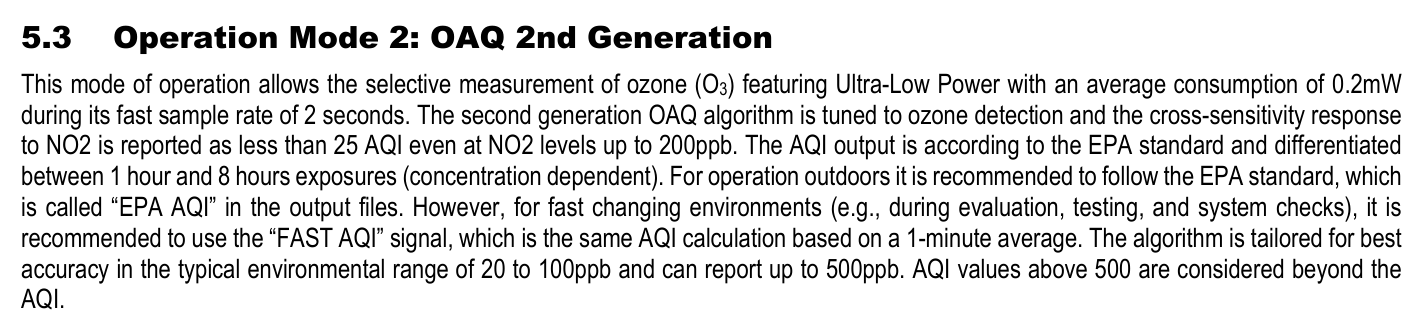
Air Quality Index is not value coming directly from the sensor. Instead, it Is produced by driver which e2^studio integrated to the project. This library process data from the sensor (sensor measure resistance of chemistor, so input for this algorithm is array of resistances) and outputs estimated (but very accurately estimated) level of ozone and two Air Quality Indexes. These indexes have no direct binding to any electrical or chemical property directly, but instead it has binding to formal standard. It has binding to standard defined by US Environmental Protection Agency (EPA) and this company defined air quality levels. ZMOD4510 datasheet contains subset of information regarding this and contains following table indicating level of Air Quality and threshold values.
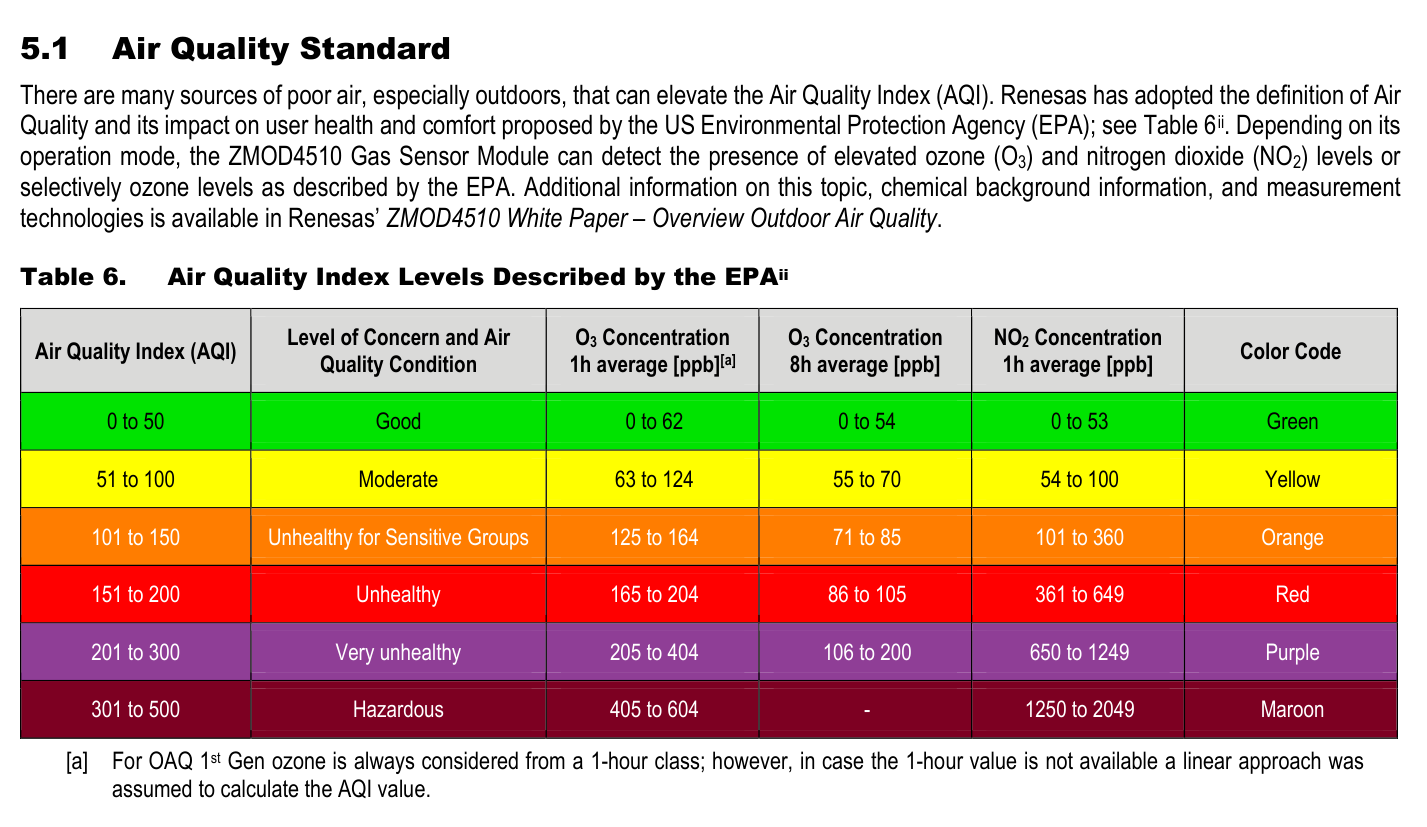
Fast Air Quality Index vs Normal Air Quality Index
On previous plots you have seen two Air Quality Indexes. The first (green) is Air quality Index according to EPA standard, while the second is helper signal which is computed based on shorter time frame, but algorithm is the same. More details are about both signals which algorithm outputs are described in datasheet in following paragraph:
Note that value of AQI is in range 0 to 500. I originally thought that it is between 0 to 100 and designed my message protocol for uint8_t which is capable of storing values up to 255. I was monitoring it but when experimenting I never beat values higher than 15, so this was not issue for me but for production use it definitely should be fixed and changed to uint16_t.
After stabilization
After stabilization my data stabilized at Air Quality Index value of 10 and at the end of monitored period grown to 11. From ozone result we can see that it slightly grown for over 8 hours. This looks like change in environment because at this time all stabilizations and warming-up period was over.
Comparing with Evaluation Software Results
Very similar results I get when running Evaluation Software as described in second blog. But note that sensor run under different conditions.
- My first experiment with evaluation software was running in room near to the opened window. It was not outside. As part of this previous experiment I have seen decreasing and increasing of value when windows was opened and when it was closed.
- In my final experiment device was directly exposed to the outdoor air.
Because results are similar, I think it is not needed to place sensor directly outside and for experimenting and sensor evaluation, amount of air flowing over opened window is sufficient for detecting outdoor air quality. I originally thought that differences will be much more significant.
Longer period of time?
You may notice that I shown only 8 hours of data. After 8 hours my battery did not ruined out (this happened first time after 6 hours, but after power consumption optimization as described in blog #7 it do not happened anymore). After optimizations my device run for over three days (and is still running but now battery is going very low). But other problem happened. My firmware probably crashed somewhere and It stopped responding when it was sensing next batch of data. From Wi-Fi router logs I see that at correct time it properly turned-on Wi-Fi module, connected to the network but no data was transmitted to the cloud and device never turned-off the wi-fi. I had to reset it manually, but after next 8 hours of successful sending data the same happened again, so most probably my firmware has bug which occurs deterministically but after very long period of time. Maybe it is some buffer overflow or something like this, but it is hard to debug. I am still debugging it but it is quite complicated. Interesting was that data from next 8-hour timespan was almost exactly the same as shown above including slightly growing ozone level behaviour.
As you can see sensor is slow by nature, even waiting for data is problematic because stabilisation took half hour. When you press debug button in IDE it took half hour to get first data, then it took another hour for filling data buffer and then after 1.5 hours in total device connect to the cloud for a first time. Note that second period is designed by me, so for debugging I adjusted it to lower threshold but 0.5 hours of waiting every time was still here. It is generally more complicated then for example in case of temperature sensors which gave valid and usable data after several milliseconds.
Summary
In this blog I shown data from my experiment. I described behaviour of sensor at power up, in stabilization phase, described meaning of values, described air quality indexes and included screenshots of interesting sections from documentation, compared with results from evaluation software and described API which I wrote and used for transferring data from device to the cloud.
Deadline for the competition is today. Today I will post my final summary blog. Thank you for reading this blog. If you have any questions about Renesas ZMOD4510 sensor, my device, API or anything else, then feel free to ask in comments below. I also like to hear any feedback.
Next blog: Blog #9: Misaz’s In the Air Tonight Design Challenge Summary