I posted earlier about a couple of SAMD21 mini modules that I'm using SAMD21 Mini Modules .
Last month Seeed Studio released an Expansion board for their XIAO module https://www.seeedstudio.com/Seeeduino-XIAO-Expansion-board-p-4746.html .
I've been using their Grove shield for the XIAO and it's handy for prototyping sensor programs and it also has battery management for portability https://www.seeedstudio.com/Grove-Shield-for-Seeeduino-XIAO-p-4621.html .
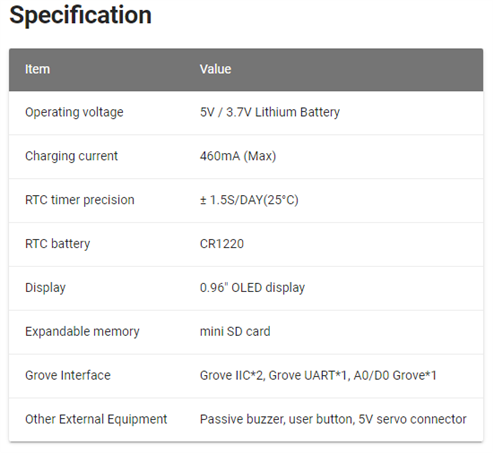
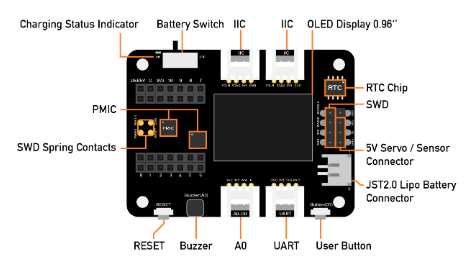
I was able to get a couple of the Expansion boards at the special introductory price of $9.90. The Expansion boards offer quite a bit of functionality as shown in the spec:
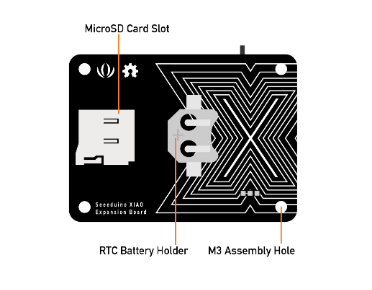
The RTC and microSD card will make it useful for prototype datalogging and it also includes a LiPo battery interface.
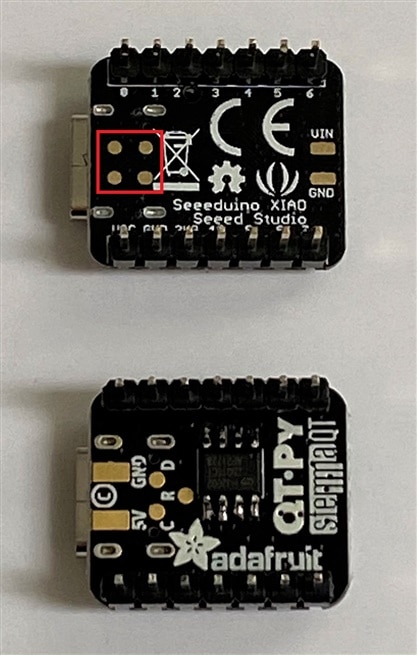
One feature that they added are pogo (spring) pins to bring the SWD (software debugger) signals from pads on the bottom of the Xiao board to a header on the Expansion board.
It's a nice feature that I might use but I realized that I won't be able to use this board with the Adafruit QT Py unless I remove those pins because the QT Py has 5V and GND pads there - see below. Since I have two boards I'll probably modify one to use with the QT Py.
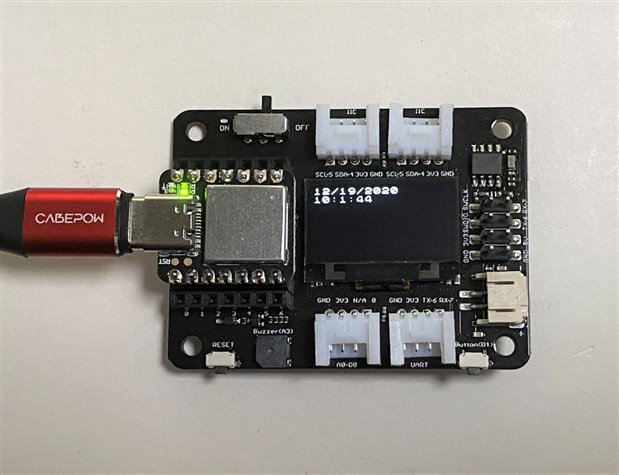
The first thing I decided to try was the RTC.
Here is the code: (After setting the time I commented out that part of the code)
Xiao_OLED_RTC.ino
#include <Arduino.h>
#include <U8x8lib.h>
#include <PCF8563.h>
PCF8563 pcf;
#include <Wire.h>

U8X8_SSD1306_128X64_NONAME_HW_I2C u8x8(/* reset=*/ U8X8_PIN_NONE);
//U8X8_SSD1306_128X64_NONAME_SW_I2C u8x8(/* clock=*/ SCL, /* data=*/ SDA, /* reset=*/ U8X8_PIN_NONE);   // OLEDs without Reset of the Display

void setup() {
  Serial.begin(115200);
  u8x8.begin();
  u8x8.setFlipMode(0);
  Wire.begin();
  pcf.init();//initialize the clock
//  Comment out after setting the time
//  pcf.stopClock();//stop the clock
//  pcf.setYear(20);//set year
//  pcf.setMonth(12);//set month
//  pcf.setDay(19);//set dat
//  pcf.setHour(9);//set hour
//  pcf.setMinut(41);//set minute
//  pcf.setSecond(0);//set second
//  pcf.startClock();//start the clock
}

void loop() {
  Time nowTime = pcf.getTime();//get current time
  u8x8.setFont(u8x8_font_chroma48medium8_r);   // choose a suitable font

  u8x8.setCursor(0, 0);
//  u8x8.print(nowTime.day);
  u8x8.print(nowTime.month);
  u8x8.print("/");
//  u8x8.print(nowTime.month);
  u8x8.print(nowTime.day);
  u8x8.print("/");
  u8x8.print("20");
  u8x8.print(nowTime.year);
  u8x8.setCursor(0, 1);
  u8x8.print(nowTime.hour);
  u8x8.print(":");
  u8x8.print(nowTime.minute);
  u8x8.print(":");
  u8x8.println(nowTime.second);
  delay(1000);
}
After trying the code out, I powered down the board and to my dismay I discovered that the RTC did not retain the time information. A bit of quick probing with a DMM and I found that the GND pad under the battery holder that is the negative terminal contact was covered with flux. I guess it's hard to clean because I had to use tweezers and tissue soaked with alcohol to get it clean (a Q-Tip or brush won't fit). Now it all works but I had to reprogram the time.
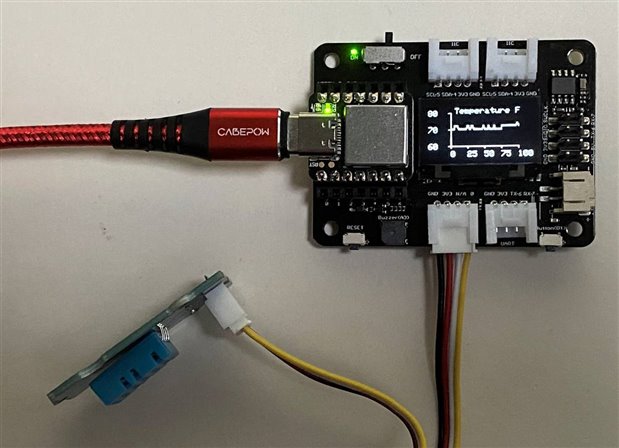
Next I decided to try out plotting a sensor on the OLED. I had used the U8x8 library for the RTC display but need to switch to the AdaFruit SSD1306 and GFX libraries for graphics. I've been using a Grove DHT11 Temperature and Humidity sensor for some other experiments so I decided to try that out.
I found some charting code by Kris Kasprzak - FREE Functions to draw graphs on OLED displays https://www.youtube.com/watch?v=13PFOwcK3-I , so I appropriated the line chart from that. The code does not do continuous plotting, so I'll need to modify that later.
Xiao_Temp_Plot.ino
/*
  This program plots DHT11 Temperature Data
  using Xiao Expansion Board
*/

#include "DHT.h"
#include <SPI.h>
#include <Wire.h>
#include <Adafruit_GFX.h>
#include <Adafruit_SSD1306.h>

#define DHTPIN 0     // what pin we're connected to
#define DHTTYPE DHT11   // DHT 11
DHT dht(DHTPIN, DHTTYPE);

#define SCREEN_WIDTH 128 // OLED display width, in pixels
#define SCREEN_HEIGHT 64 // OLED display height, in pixels

// Declaration for an SSD1306 display connected to I2C (SDA, SCL pins)
#define OLED_RESET     -1 // Reset pin # (or -1 if sharing Arduino reset pin)
Adafruit_SSD1306 display(SCREEN_WIDTH, SCREEN_HEIGHT, &Wire, OLED_RESET);

#define LOGO16_GLCD_HEIGHT  16
#define LOGO16_GLCD_WIDTH   16

// create what ever variables you need
double x, y;

// these are a required variables for the graphing functions
bool Redraw1 = true;
bool Redraw2 = true;
bool Redraw3 = true;
bool Redraw4 = true;
double ox , oy ;

void setup() {
  Serial.begin(115200);
  dht.begin();

  display.begin(SSD1306_SWITCHCAPVCC, 0x3C);
  display.clearDisplay();
  display.display();
}

unsigned long OldTime;
unsigned long counter;

void loop(void) {
  double temp, humid;
  temp = dht.readTemperature()*1.8 + 32;
  humid = dht.readHumidity();

  Serial.print("Temperature: ");
  Serial.print(temp);
  Serial.println(" *C");

  DrawCGraph(display, x++, temp, 30, 50, 80, 40, 0, 100, 25, 60, 80, 10, 0, "Temperature F", Redraw4);
  if (x > 100) {
    while (1) {}
  }

  delay(1000);

  }

/*
  &display to pass the display object, mainly used if multiple displays are connected to the MCU
  x = x data point
  y = y datapoint
  gx = x graph location (lower left)
  gy = y graph location (lower left)
  w = width of graph
  h = height of graph
  xlo = lower bound of x axis
  xhi = upper bound of x asis
  xinc = division of x axis (distance not count)
  ylo = lower bound of y axis
  yhi = upper bound of y asis
  yinc = division of y axis (distance not count)
  title = title of graph
  &redraw = flag to redraw graph on fist call only
*/

void DrawCGraph(Adafruit_SSD1306 &d, double x, double y, double gx, double gy, double w, double h, double xlo, double xhi, double xinc, double ylo, double yhi, double yinc, double dig, String title, boolean &Redraw) {
  double i;
  double temp;
  int rot, newrot;

  if (Redraw == true) {
    Redraw = false;
    d.setTextSize(1);
    d.setTextColor(SSD1306_WHITE, SSD1306_BLACK);
    d.setCursor(35, 4);
    d.println(title);
//    d.fillRect(0, 0,  127 , 16, SSD1306_WHITE);
//    d.setTextColor(SSD1306_BLACK, SSD1306_WHITE);
//    d.setTextSize(1);
//    d.setCursor(2, 4);
//    d.println(title);
    ox = (x - xlo) * ( w) / (xhi - xlo) + gx;
    oy = (y - ylo) * (gy - h - gy) / (yhi - ylo) + gy;
    // draw y scale
    d.setTextSize(1);
    d.setTextColor(SSD1306_WHITE, SSD1306_BLACK);
    for ( i = ylo; i <= yhi; i += yinc) {
      // compute the transform
      // note my transform funcition is the same as the map function, except the map uses long and we need doubles
      temp =  (i - ylo) * (gy - h - gy) / (yhi - ylo) + gy;
      if (i == ylo) {
        d.drawFastHLine(gx - 3, temp, w + 3, SSD1306_WHITE);
      }
      else {
        d.drawFastHLine(gx - 3, temp, 3, SSD1306_WHITE);
      }
      d.setCursor(gx - 27, temp - 3);
      d.println(i, dig);
    }
    // draw x scale
    for (i = xlo; i <= xhi; i += xinc) {
      // compute the transform
      d.setTextSize(1);
      d.setTextColor(SSD1306_WHITE, SSD1306_BLACK);
      temp =  (i - xlo) * ( w) / (xhi - xlo) + gx;
      if (i == 0) {
        d.drawFastVLine(temp, gy - h, h + 3, SSD1306_WHITE);
      }
      else {
        d.drawFastVLine(temp, gy, 3, SSD1306_WHITE);
      }
      d.setCursor(temp, gy + 6);
      d.println(i, dig);
    }
  }

  // graph drawn now plot the data
  // the entire plotting code are these few lines...

  x =  (x - xlo) * ( w) / (xhi - xlo) + gx;
  y =  (y - ylo) * (gy - h - gy) / (yhi - ylo) + gy;
  d.drawLine(ox, oy, x, y, SSD1306_WHITE);
  d.drawLine(ox, oy - 1, x, y - 1, SSD1306_WHITE);
  ox = x;
  oy = y;

  // up until now print sends data to a buffer NOT the screen
  // this call sends the data to the screen
  d.display();

}
Probably need to do some real work (I hear the wife vacuuming  ). I'll have to try datalogging to the SD card later.

Top Comments
-

gimondan
-
Cancel
-
Vote Up
+2
Vote Down
-
-
Sign in to reply
-
More
-
Cancel
-

ralphjy
in reply to gimondan
-
Cancel
-
Vote Up
+1
Vote Down
-
-
Sign in to reply
-
More
-
Cancel
-

gimondan
in reply to ralphjy
-
Cancel
-
Vote Up
+1
Vote Down
-
-
Sign in to reply
-
More
-
Cancel
Comment-

gimondan
in reply to ralphjy
-
Cancel
-
Vote Up
+1
Vote Down
-
-
Sign in to reply
-
More
-
Cancel
Children