


In this chapter, we will put the B&K Precision/Sefram DAS240-BAT Multi-Channel Recorder through some tests which are relevant for field usage and simulate potential use scenarios.
Battery Life
One of the key parameters of interest would be battery life, especially as there may be some missions where the recorder may be on a remote site without access to reliable power or is not allowed to consume power as that may affect the validity of the test.
Battery life was tested with three different scenarios – logging with one channel enabled at the maximum sample rate and screen dimming set to one-minute, logging with all channels enabled at the maximum sample rate and screen dimming set to one-minute and logging with all channels enabled at the maximum rate with screen dimming disabled, screen brightness set to maximum and Wi-Fi connected.
With screen dimming enabled, the results came in at 24 hours and 20 minutes for a single channel and 24 hours and 50 minutes for all channels, representing a significantly (62%) greater time than the datasheet’s claim of 15 hours.
Without screen dimming and using maximum brightness and Wi-Fi connection, the unit managed just 12 hours and 51 minutes. This is 28.5% greater than the datasheet claim of 10 hours, which is great news for those who intend to work on battery power alone and also means that the battery should be able to last longer in the recorder before its capacity falls to the stated values in the datasheet. In fact, most Li-Ion batteries will reach 80% (or slightly below) as they reach their stated cycle life, which would put the run time near the claimed 10-hour mark under this load.
In all low-battery scenarios, the recorder gracefully saved the log prior to shutting down and no data loss was incurred.
Logging Battery Cells During Charge and Discharge
One of the key advantages of having so many isolated channels is the ability to measure many voltages without the need to be concerned about common ground connections. The only thing you have to be aware of is the CAT I 100V safety rating.
In order to demonstrate the flexibility, I thought it would be a good idea to perform some battery-pack based experiments. In the days of Ni-Cd and Ni-MH power tool batteries, it was common knowledge that such packs consisting of numerous series-connected cells often failed due to cell mismatch which would be exacerbated by running the battery completely flat. As a result, I decided to do some diagnostics on the Ni-MH battery pack from a three-year-old handheld rechargeable vacuum cleaner.

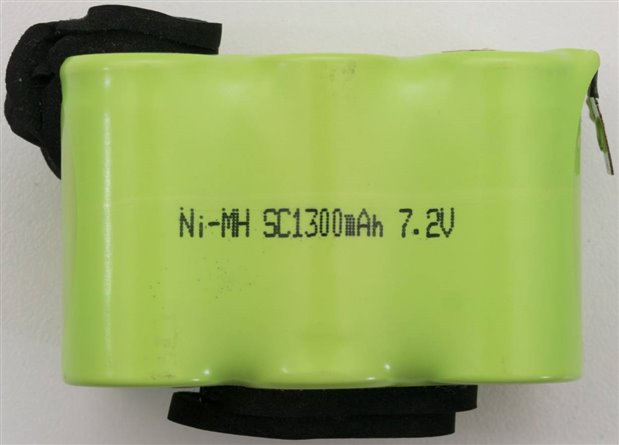
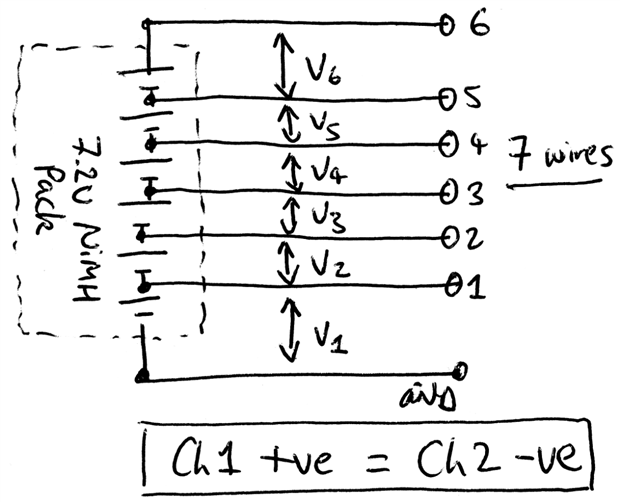
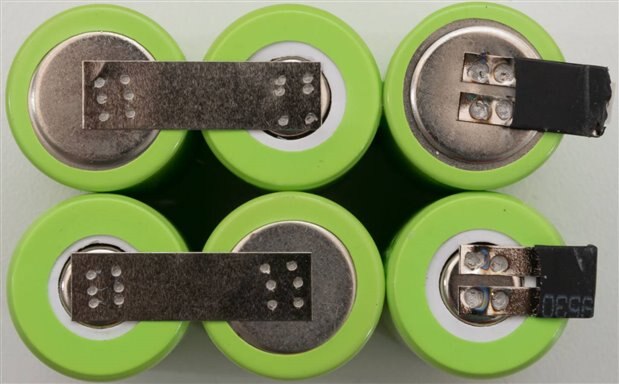
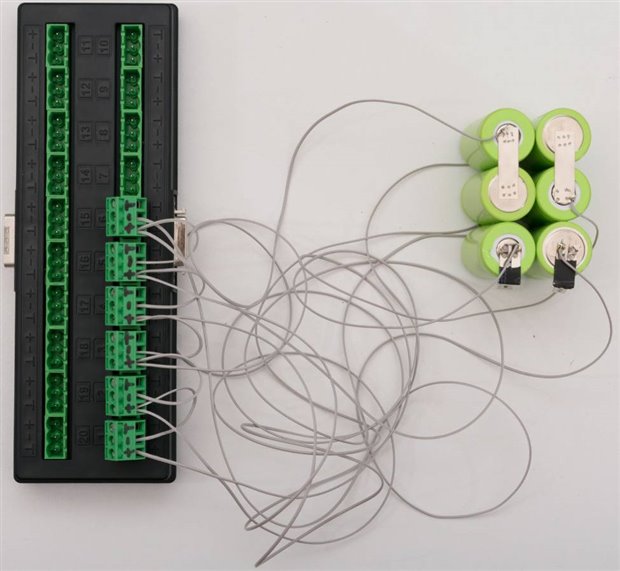
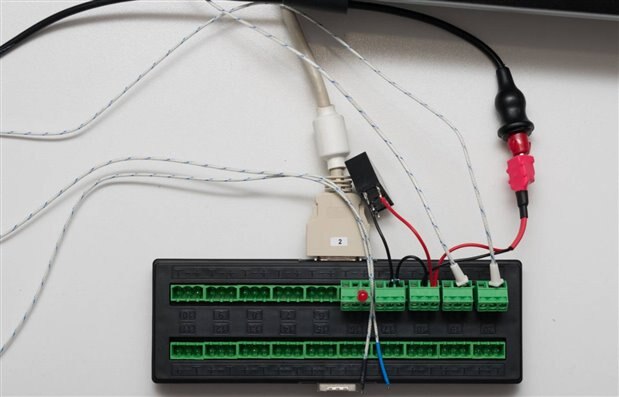
The battery comprises of six sub-C cells in series, for a nominal voltage of 7.2V and capacity of 1.3Ah. To monitor the battery while charging and discharging, I determined that there should be seven wires to the pack.
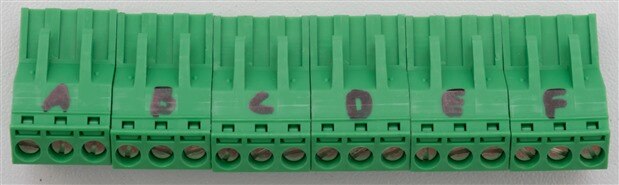
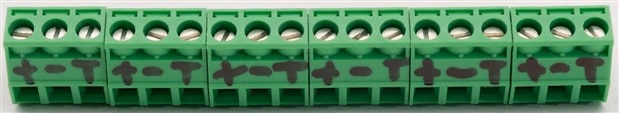
For my convenience, I used a permanent marker to label the terminal blocks for ease of connection. I then stripped some 28AWG ribbon cable and connected these to the terminal blocks in order.

I removed the heatshrink from the battery pack, lifting the edges of the tabs and soldering the tap wires to the appropriate positions on the cells.
Battery charging and discharging was undertaken using a Rohde & Schwarz NGM202 programmable power supply. The data was logged using the B&K DAS240-BAT and analysed from the .txt export from the resulting log files using MATLAB.
First Discharge
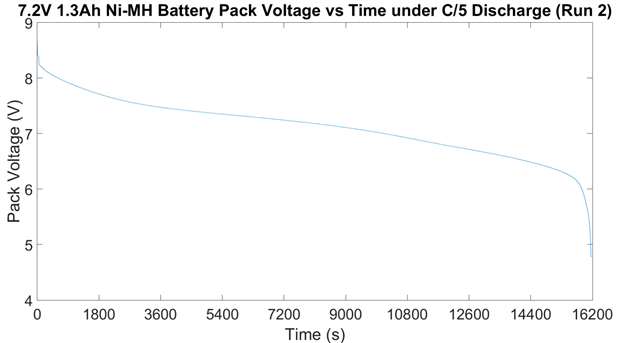
The cell was initially float-charged by the vacuum’s internal circuitry (likely, just a current limiting resistor). On a discharge, the overall voltage looks like the following graph:
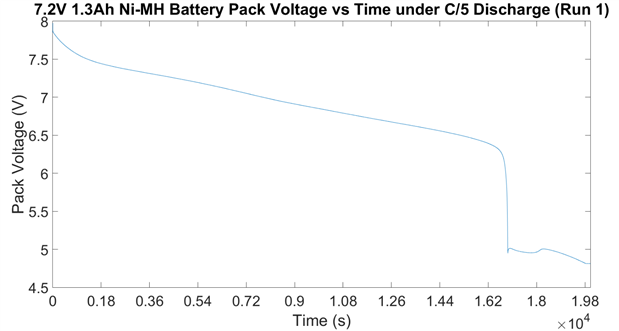
This looks relatively normal, except for the “wavy” bumps after dropping below 5V. It is hard to properly diagnose the battery without more information about each of the cells.
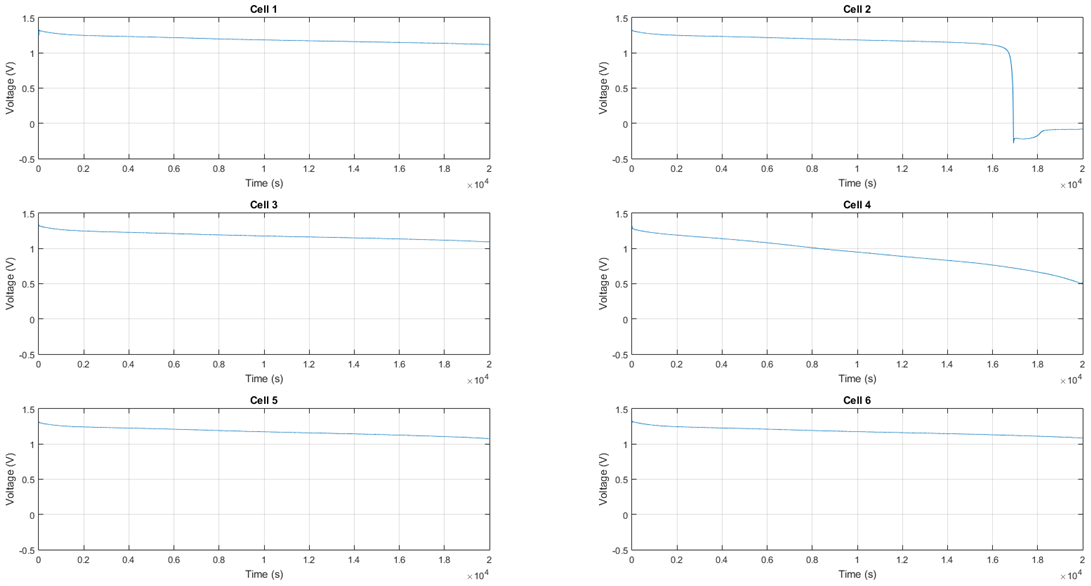
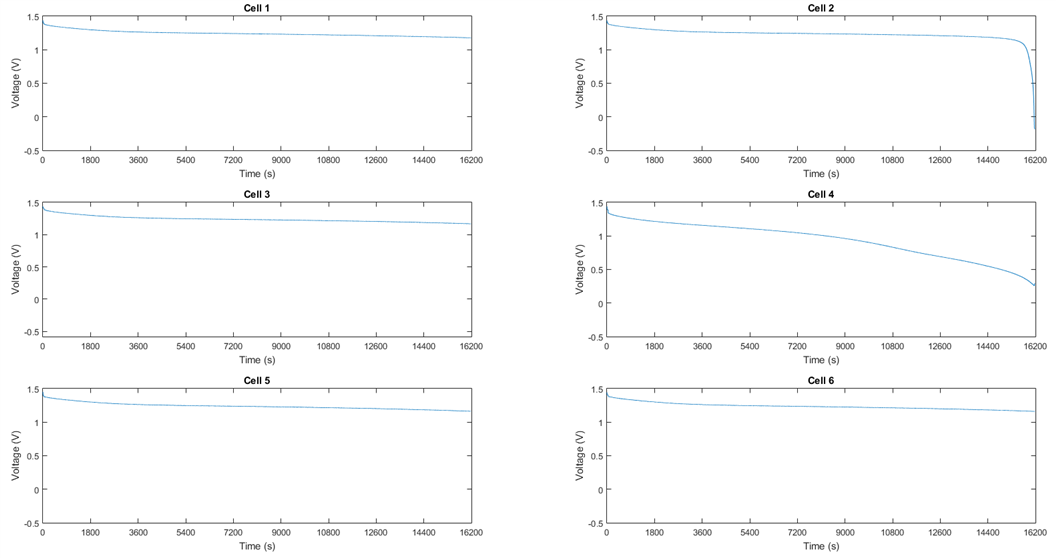
Plotting each of the cells shows that Cells 1, 3, 5 and 6 are all hardly completely discharged with 1 and 3 being stronger than 5 and 6. Cells 2 and 4 are “faulty”, with Cell 2 having a severely mismatched capacity to the point of being reverse polarised during discharge. Cell 4 is a bit strange, seemingly having some form of voltage depression all-over which may be indicative of increased internal resistance. Two bad cells? I wouldn’t have guessed.
First Charge
I decided to emulate the “float” style charge of the regular charger by charging at C/10. The resulting graph looks as follows:
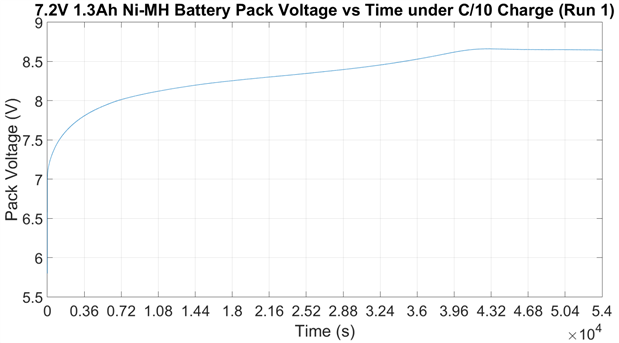
This doesn’t show what happens to each of the cells, which we can find out with the B&K DAS240-BAT:
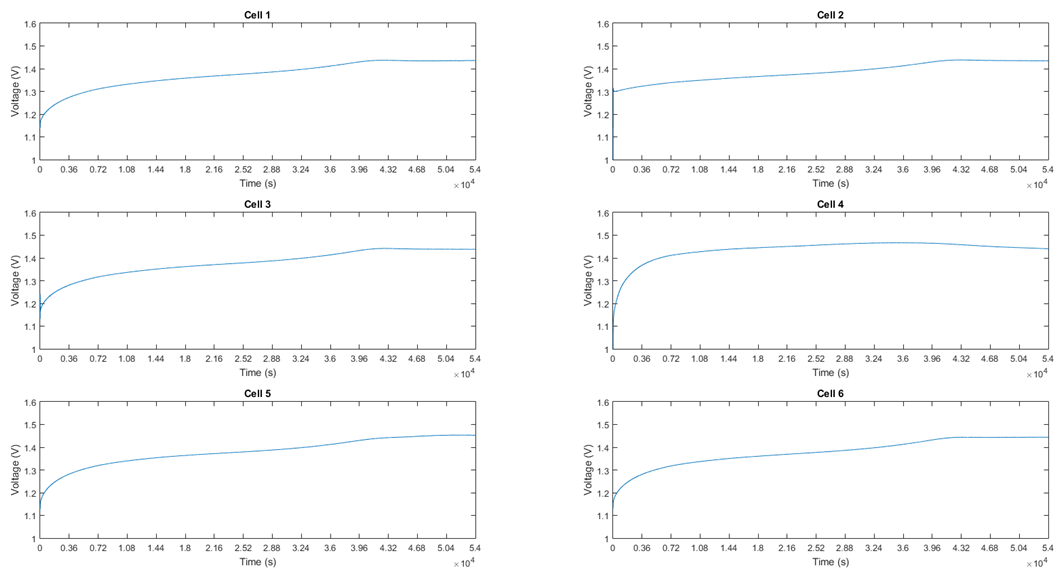
A look at this shows that the good cells are charging as expected, reaching full capacity an hour or two prior to termination. Cell 2 seems to show a rapid voltage increase from initial application of current, suggesting some internal resistance issue, but it reaches full charge at around the same time as the good cells. Perhaps this cell has some internal current leakage resulting in the reduced capacity. Cell 4 shows a curved but still rapid increase in voltage and what appears to be overcharge voltage depression (i.e. -dV).
Second Discharge
After being satisfied that the charging was completed properly, I commenced a second discharge.
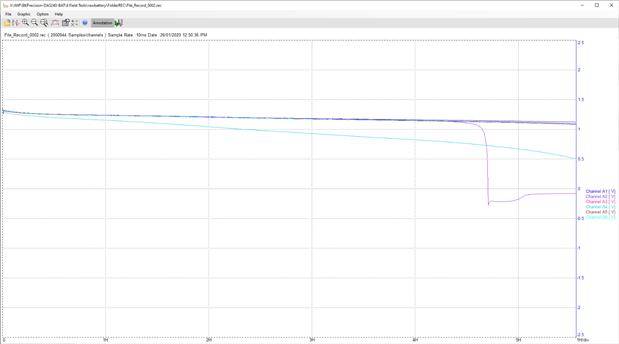
This one shows an overall voltage trend that looks surprisingly like a healthy pack, however, a look at the individual cell plots show that Cell 2 has just reached reverse polarity at the end of discharge and Cell 4 had reached very close to zero volts. This shows how the behaviour of the pack can very much be influenced by the “balance” of the charge in each cell.
Second Charge
After that discharge run, I was hoping to charge the pack at a more rapid C/1 rate to observe a negative delta-V indication of full charge.
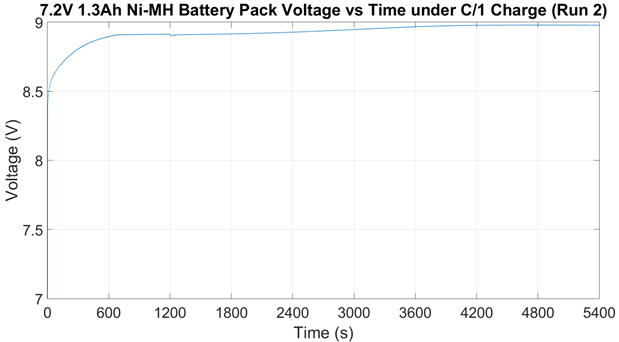
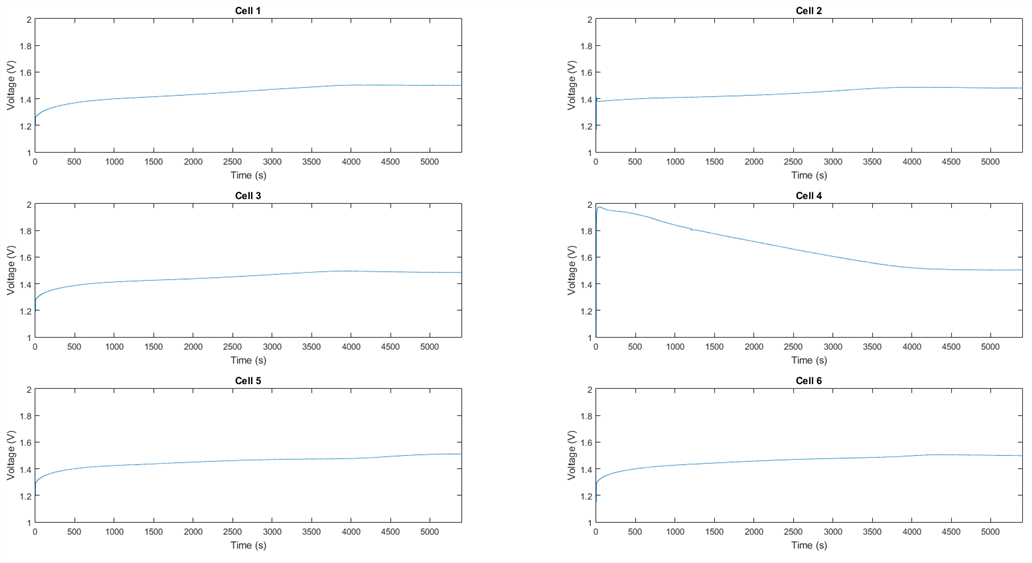
Unfortunately, having the voltage limit on the supply set to 9V, the pack became voltage-limited during charging likely due to high internal resistance. A look at the individual cells shows the healthy cells doing just fine, with Cell 2 reaching full charge early. Cell 4, however, due to its high internal resistance, ended up “soaking” up a lot of voltage initially, reaching close to 2V which may have caused further damage to the cell and unexpected chemical reactions. This is why for certain sensitive chemistries (e.g. Li-based), balancing series cells is mandatory.
That being said, the B&K Precision/Sefram DAS240-BAT proved its value in being able to monitor per-cell performance of a battery pack thanks to its isolated channels. The CAT I 100V rating does limit the size of battery packs it can be used with, however.
Logging in Extreme Environments
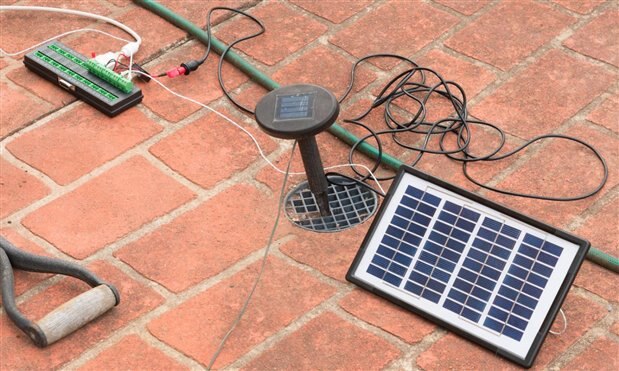
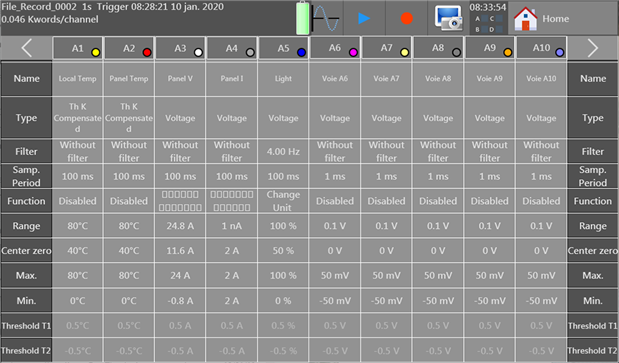
The next experiment I thought of literally involves operating the equipment “in the field”, or more precisely, in my backyard. Despite clear warnings in the manual in regards to temperature and direct sunlight, I decided to create a small rig involving a 12V (nominal) 3W solar panel, driving a relay coil as a load. The voltage would be logged on one channel, with the current measured over a small 1-ohm shunt resistor (converted back into current using a math-channel setting). To round out the sensor types, I dedicated two channels to thermocouples, both of the garden K-type variety. Finally, lacking anything spare that could be used as a brightness sensor, I went with a regular “low-intensity” type red LED as a photodiode, sans amplification, into the final channel which was calibrated to read percentage based on saturation using a 1000-lumen torch.
The unit was placed outside in the backyard, with the unit in a semi-shaded location, screen facing away from the sun in the shade (as direct sun would likely cause heat damage to the LCD). The channel interface was placed on the ground, thus liable to direct sunlight. One of the temperature channels measured the solar panel temperature, while the other was in the air near the channel interface to read the “local” air temperature.
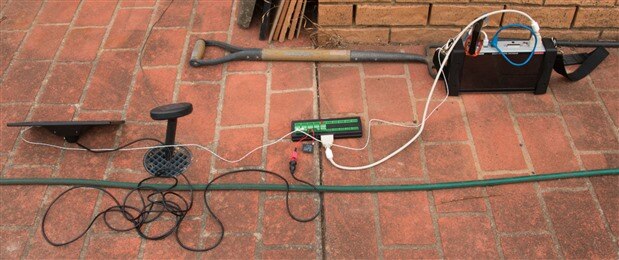
As this was prior to obtaining a compatible USB Wi-Fi interface, I used a Mikrotik hAP mini as a Wi-Fi to Ethernet bridge, powered from one of the recorder’s USB ports to maintain network connectivity. Logging proceeded for the majority of the day, with shading dominating the early part of the recording.
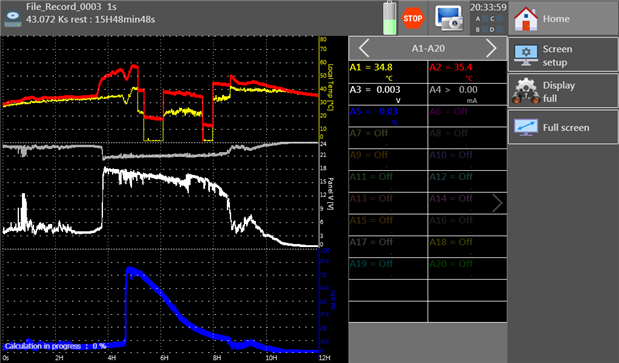
The logged data was then plotted in SeframViewer with some changed settings to enhance readability.
Unexpectedly, the data seemed to show that the operational temperature range limit of 40 degrees Celsius is probably there for a reason – the thermocouple channel readings collapsed by approximately 20 degrees Celsius upon exceeding that figure and then further collapsed to zero (uncompensated), suggesting that there may be a limitation to the capabilities of the inbuilt reference junction compensation. As a result, I recommend complying with the datasheet specifications and not submitting even the channel connection module to temperatures above 40 degrees Celsius. The other channels seemed to read just fine, although attempting to rescale the Current in SeframViewer caused the units to be entirely corrupted due to a software bug. Likewise, issues with attempting to create a computed mathematical channel for power based on multiplying voltage and current values occurred, due to some strange interactions when using a channel that already has a function applied to it for a math channel. This has been reported to B&K Precision, with the hope of future improvements.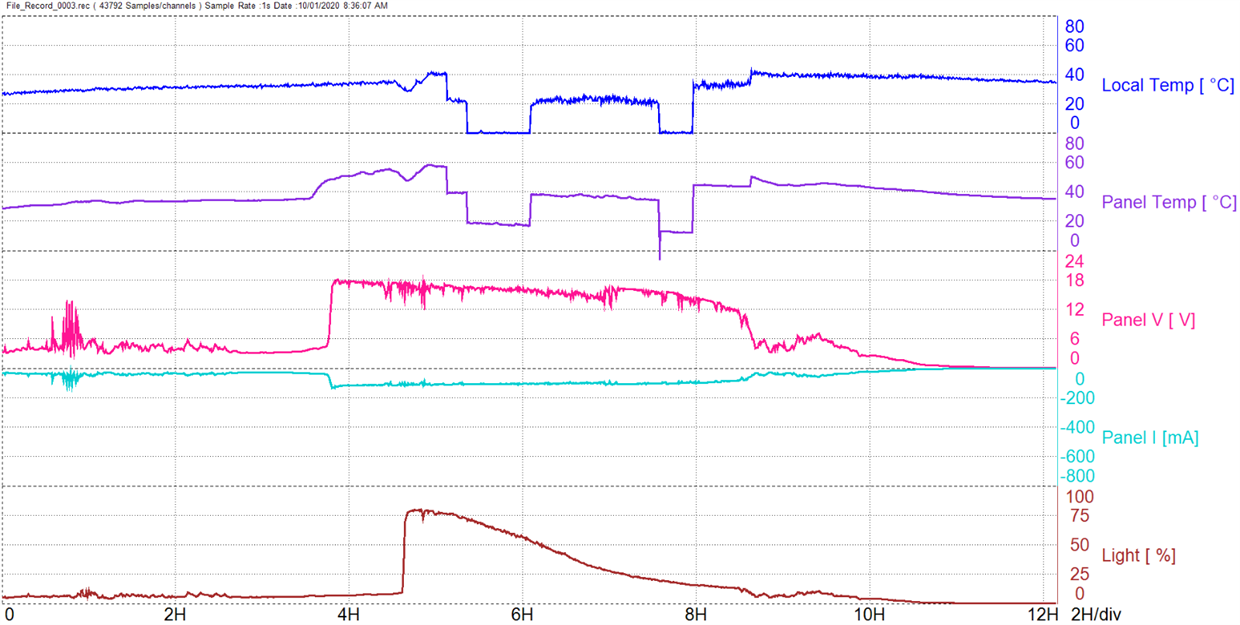
It does show how the DAS240-BAT can be applied to reading multiple physical quantities quasi-simultaneously in the field, although it does show that the datasheet temperature limitations are probably there for a reason and combining or using more complex features may lead to unexpected operation and bugs in both recorder firmware and viewing software.
Logging RPM Signals
The B&K Precision/Sefram DAS240-BAT has the ability to measure RPM using the logical function (i.e. K) channels on the DB-25 connector. This can be particularly handy when dealing with rotary equipment (e.g. motors) with a tachometer or encoder output and deserved a test.
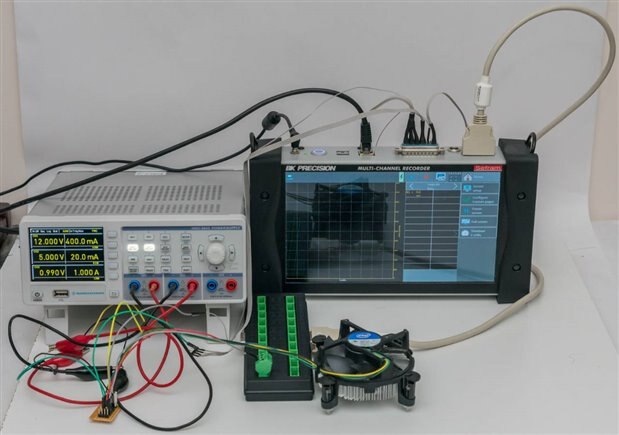
To test this, I grabbed the only thing I knew that I owned that put out such a signal – a computer fan. This particular fan is attached to a stock Intel heatsink-fan cooler for an old Celeron G530 CPU. Building a small break-out, I decided to power the fan from one rail of the Rohde & Schwarz HMC8043 with the second rail powering a pull-up resistor to convert the tachometer signal from an open-collector to voltage level input which is fed into a K-channel on the DAS240-BAT.
I had initially planned to plot the test using the unit’s on-board X-Y plotting mode, sweeping the voltage on the HMC8043 programatically, it seems that the present firmware does not permit plotting of dissimilar channel types in this mode (i.e. A-channel (analog) vs K-channel (logical function)). I’ve reported this to B&K Precision as a suggestion for improvement.
Instead, the test was performed with the voltage being swept by remote SCPI command and the RPM measurement made using Modbus TCP remotely. It was discovered that in RPM mode, while the screen returns the RPM measurement, the Modbus TCP value is returned as a percentage of the maximum RPM value set on the scale. This did not appear to be the expectation so I have enquired with B&K Precision as to this behaviour.
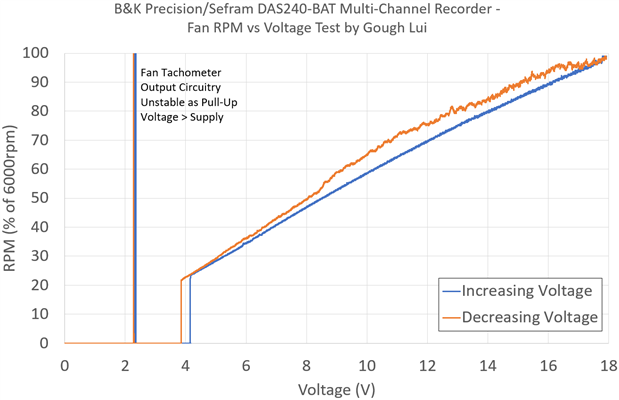
The resulting curve shows a near-linear RPM correlation with operating voltage above about 4.2V with a slight difference as the voltage decreases as the inertia of the system often results in a slightly higher speed being recorded. At around 2.2V, a spike in tachometer values is registered, likely as a result of noise on the tachometer signal as the Vcc to the fan is below half of the pull-up voltage on the tachometer input, possibly resulting in unexpected reverse current flow in the controller (i.e. backpowering).
This proved to be another successful test of the B&K Precision/Sefram DAS240-BAT’s capabilities, although with some functional quirks and limitations.
Logging Fast-Changing Signals
As the DAS240-BAT is capable of up to 1kHz sample rate across a single analog channel, I thought I should test it out with a fast-changing signal.
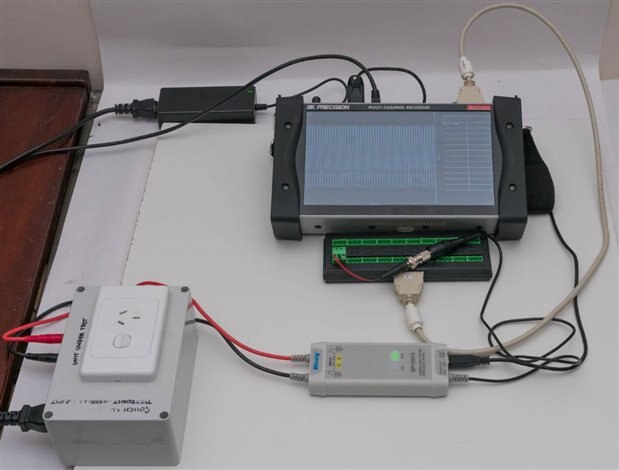
I used a high voltage differential probe to measure the 50Hz mains electricity with the DAS240-BAT.
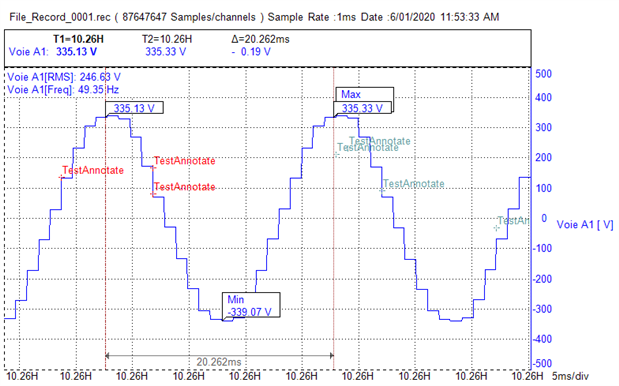
The unit did log the sine wave, however, the zoom on the unit itself is quite limited and the SeframViewer software uses no interpolation between samples, making it more difficult to interpret accurately (unlike sin(x)/x interpolation). Unfortunately, the DAS240-BAT does not seem to be capable of computing more complex mathematical functions on analog inputs – e.g. frequency or RMS amplitude. As a result, while high sample rates are available, the DAS240-BAT is still most suited to more “steady”, slower changing signals from sensors and transducers rather than AC signals.
Logging Small Signals
Finally, one of the DAS240-BAT’s most unique capabilities is the ability to log very small voltages. In order to test this, I decided to turn it into a basic two-lead ECG by attaching one channel input to a two-electrode Polar band, normally used for fitness monitoring. As this is not a medical device, it should not be used for such measurements for your own safety – do not try this at home!
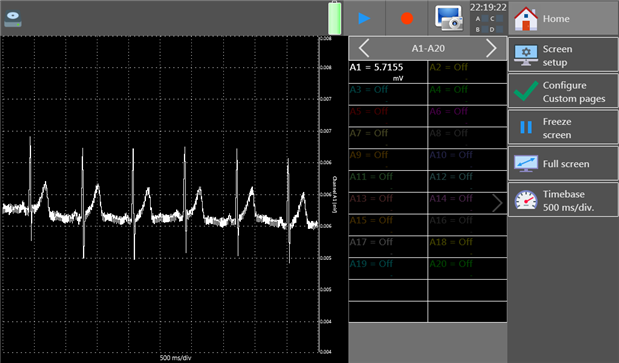
It definitely worked, with a bit of mains noise pick-up. The heartbeat is clearly visible, but the same limitations with regards to channel functions from the previous section applies.
Extra Notes - Testing X-Y Mode, Resistance Mode and Calculations Channels
During this RoadTest, I had the bright idea to put in an entry for the element14 Project14 Holiday Special which featured the B&K Precision/Sefram DAS240-BAT acting as a modern etch-a-sketch, showing the use of resistance measurements on input channels using the inbuilt bias generator and X-Y plotting mode. The posting including video can be found here.
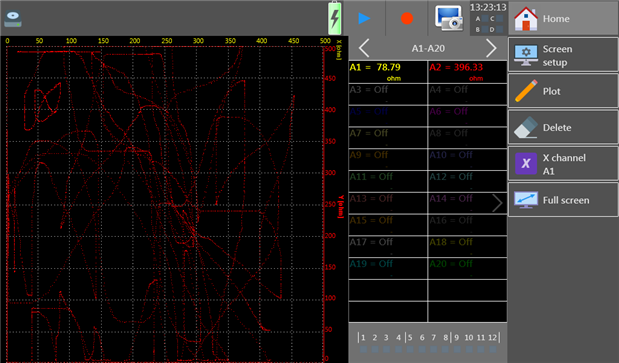
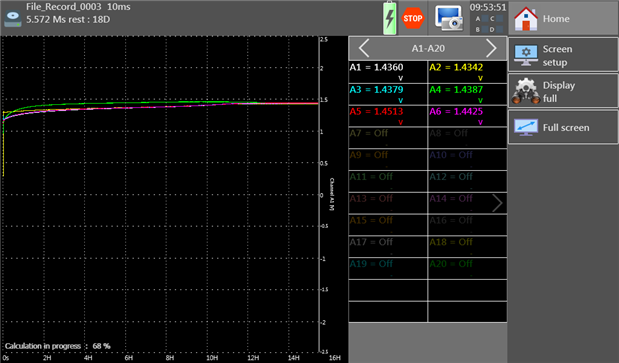
The DAS240-BAT has channel-based mathematics calculations (shown in Ch3) for handling sensors and transducers, so as to plot them in their native units. There are also math channels which allow to create traces based on mathematical operations on other traces. Unfortunately, during testing, it seems that combining the two features causes corruption to the source channels, resulting in incorrect results.
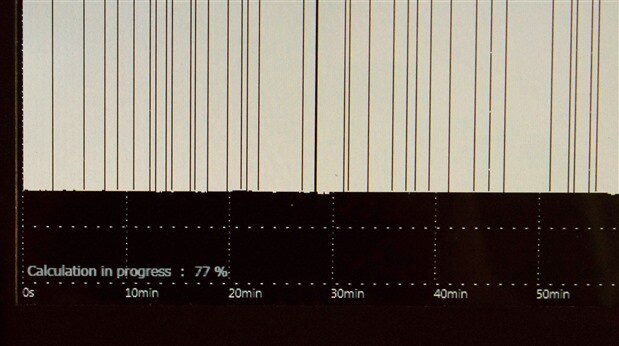
Otherwise, after creating the math channels, they must be manually enabled in the plot configuration so that they are shown, otherwise they are computed but not shown. Regardless, with or without these channels enabled, during logging, the “Calculation in progress” indication is shown in the bottom corner of the screen periodically, although with no observed ill effects.
Conclusion
A lot was learned by applying the B&K Precision/Sefram DAS240-BAT in simulated field conditions. A rather nice discovery was that the battery life was able to exceed the manufacturer’s claims – my testing indicated a worst-case scenario of about 12 hours 51 minutes and a best case of 24 hours and 50 minutes, far exceeding the 10 hours and 15 hours claimed by the datasheet. This provides a good buffer against battery capacity degradation over time, allowing for a longer working life.
The unit was applied to various monitoring tasks. The first was individual cell monitoring of a six-cell Ni-MH pack during charging and discharging. The isolated channels allow for a math-free way of monitoring the condition of each individual cell, allowing two bad cells to be identified where the pack’s overall voltage curves would not have given a clear indication of problems. The DAS240-BAT’s CAT I 100V safety rating does limit its applicability to larger battery banks, however.
A simulated field test was also completed outside in the hot summer of Sydney, Australia on a day when the temperature was expected to reach 45 degrees Celsius. Testing of thermocouple and voltage inputs with scaling factors applied was successful, albeit with unusual results recorded when the temperature of the channel connection module exceeded 40 degrees Celsius, likely indicative of a limitation in the compensation capabilities of the reference junction. Software flaws in both the recorder firmware math channel handling of a channel with change-units applied, and in re-scaling of a channel with change-units applied were also experienced, suggesting the more complex functionality is as yet unpolished.
Testing of the RPM functionality of the frequency measurement mode offered by the K-channels (Logical Function Channels) was successful, allowing for the measurement and determination of the relationship between input voltage of a brushless DC fan and its RPM. Unfortunately, limitations in the recorder’s software meant that X-Y plots between dissimilar channel types (A-channels and K-channels) is not possible, meaning that this experiment instead had to rely on analysing recorded data on a PC instead. Likewise, it was also discovered that the Modbus TCP return value was not the measured RPM but instead a percentage value of the maximum RPM configured in the channel menu, which is not the expected behaviour.
Testing of fast-changing signals using a high-voltage differential probe and mains electricity was able to demonstrate the 1kHz sample rate reconstructing the sine wave input, however, limitations in the sample-by-sample interpolation-free display made it difficult to analyse the results. Likewise, no channel functions were available to compute RMS amplitude, frequency or process AC signals in any other way. It seems more suited for analysing slow-changing near-DC type continuous signals.
Testing of small amplitude signals was successful, by hooking up a channel input to a two-terminal polar chest strap and using the unit similar to an ECG machine to measure the waveform from the heart to show the heartbeat. Likewise, testing of X-Y mode was also demonstrated successfully for measurements of resistance where the DAS240-BAT was responsible for injecting the bias current.
---
This post is part of the B&K Precision/Sefram DAS240-BAT Multi-Channel Recorder RoadTest Review.
Top Comments