In present days air pollution is increasing as it has more impact with raise in temperature, humidity, pressure, wind, etc. The increase in CO, CO2, NO2, TVOC, PM, UV effect the human health in different ways, it creates sick to all categories of people from kids to elders. The pollution is also danger to animals, birds, plants, creatures, etc. The sources of pollution are many like factories smoke, forest fires, vehicles smoke, crop residues burning, land fillings burning. AQI is used to represent the quality of air present around. Air Quality Index is a number used to convey the quality of air by the government to the general public. Air quality deteriorates with an increase in the concentration of pollutants. The Air Quality Index represents the severity of pollution for ordinary people.

There are eight major pollutants to be taken into account for AQI calculation,
Particulate matter (PM10 or PM2.5)
Nitrogen dioxide (NO2)
Ozone (O3)
Carbon monoxide (CO)
Sulphur Dioxide (SO2)
ammonia (NH3),
and lead (Pb).
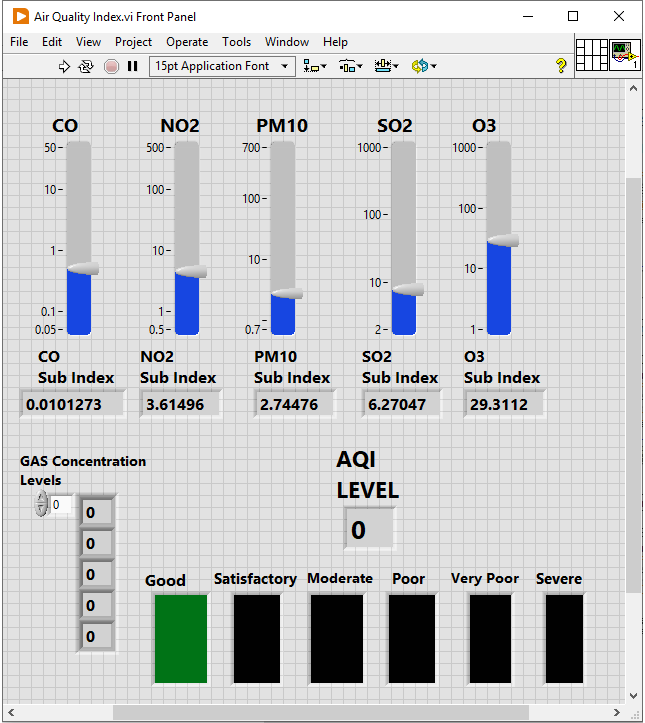
0-50: air quality is good
51-100: satisfactory air quality
101-200: moderate air quality
201-300: air quality is poor
301-400: very poor air quality
401-500: severe range of AQI
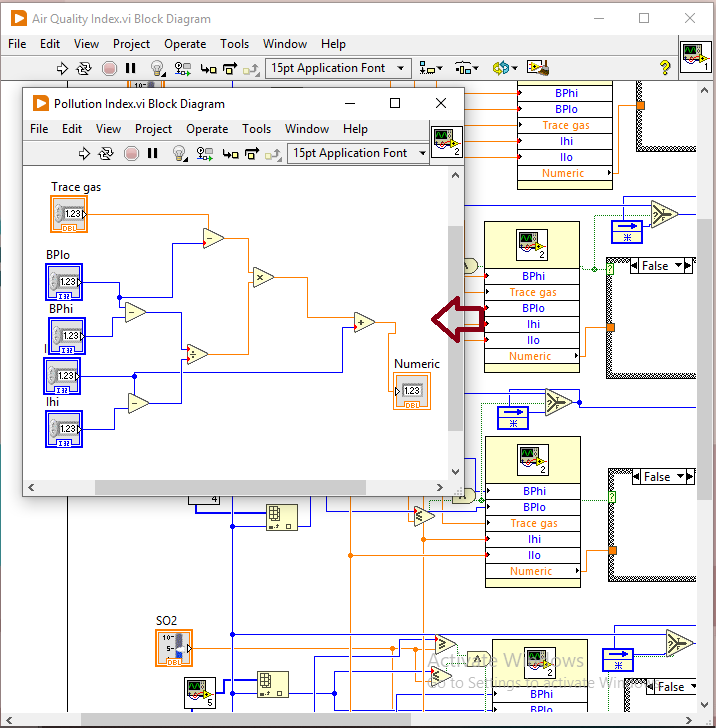
The formula to calculate AQI is the same as per the Indian CPCB and US-EPA. The AQI is calculated using the equations separately for parameters. For example, if you wish to calculate AQI on the basis of four parameters, use the equation four times, and the worst sub-index communicates the AQI. A subindex is a linear function (two different yet related notions) of the concentration of pollutants.
Ip = [IHi – ILo / BPHi – BPLo] (Cp – BPLo) + ILo
Where,
Ip = index of pollutant p
Cp = truncated concentration of pollutant p
BPHi = concentration breakpoint i.e. greater than or equal to Cp
BPLo = concentration breakpoint i.e. less than or equal to Cp
IHi = AQI value corresponding to BPHi
ILo = AQI value corresponding to BPLo
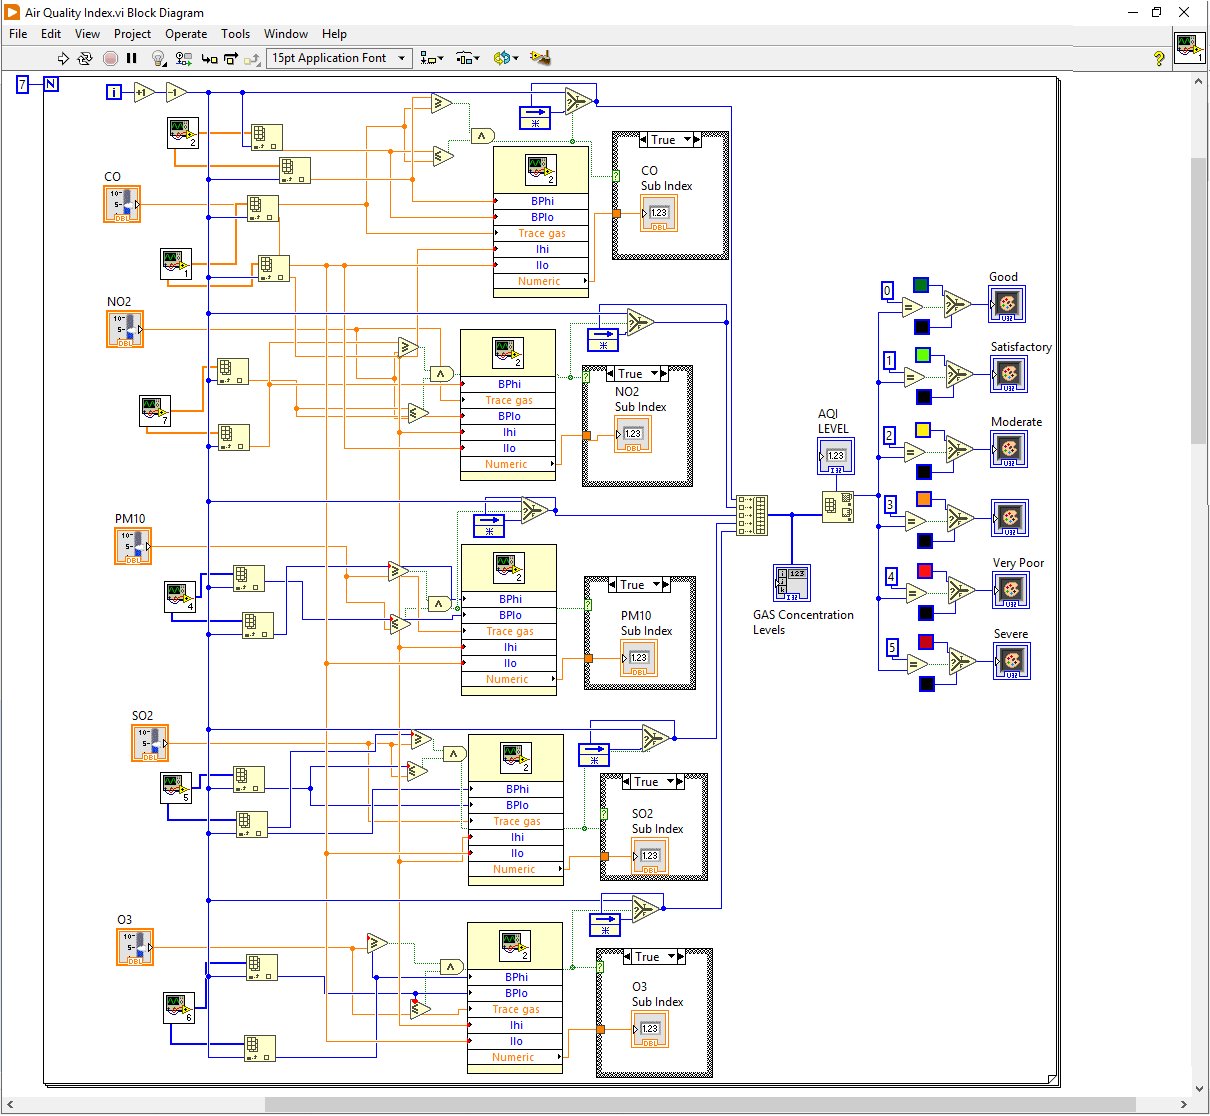
The Graphical programming is done in LabView to get the output color according to the level of Air Quality. The below figures shows the Labview graphical method used to produce the Air quality Index level.
Initially for single trace gas is designed and tested it was working well then implemented to the group of trace gases. Below figure shows Single trace gas testing with automation.
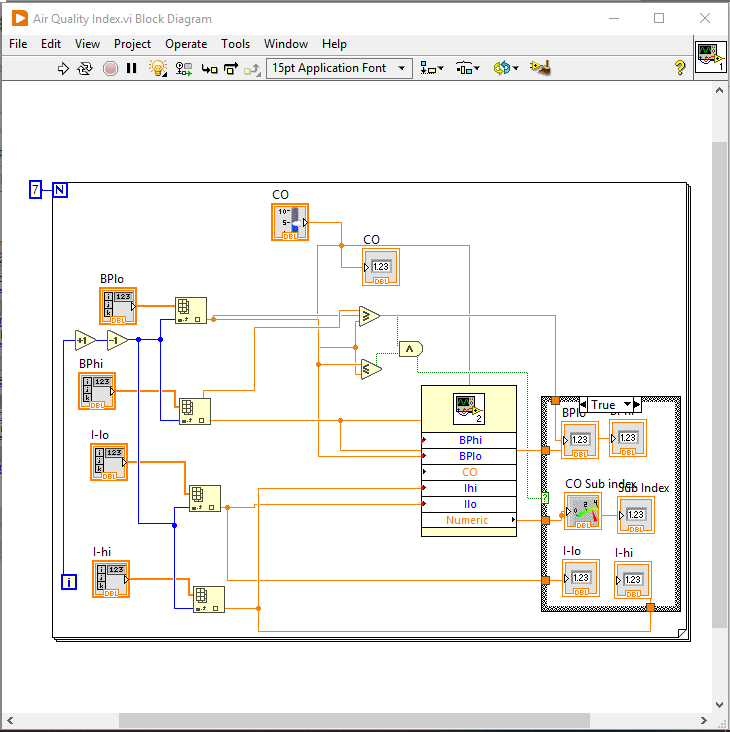
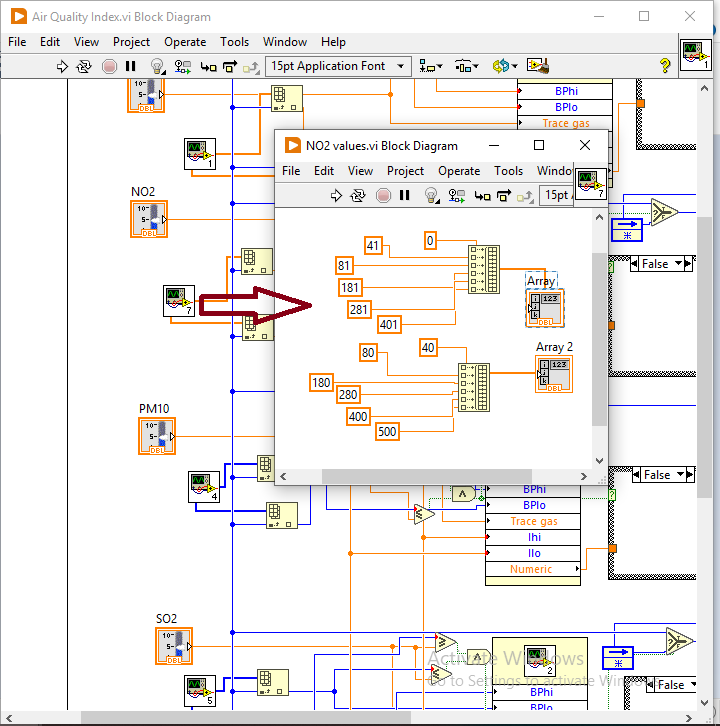
As a part of the project SubVIs are created to make the diagram as simple and below figure shows the concentration related SUBVI for NO2 gas likewise for all gases Index values and concentration breakpoint SubVIs are created.
The mathematical relation for calculating Index for pollution is created as Sub-VI to look the diagram as simple as it can be below figure shows the mathematical relation sub-VI.
Finally implementing all the calculations the result is shown in the form of color code which indicated the level of Air quality as AQI. As said earlier different color is used to specify the Air quality same is shown in this test automation. The below figure is the Front Panel diagram of LabView showing the gas concentrations, levels and color code.
Block Diagram of LabView is shown in below figure for representing the color of Air Quality Index.
The following video shows how the automation is done with LabVIEW software.
NEXT LEVEL:
The Labview VI is modified to generate the color through PWM signal in the Raspberry Pi PICO the below figures shows how the PWM signal will choose the RGB colors for Pollution indication.
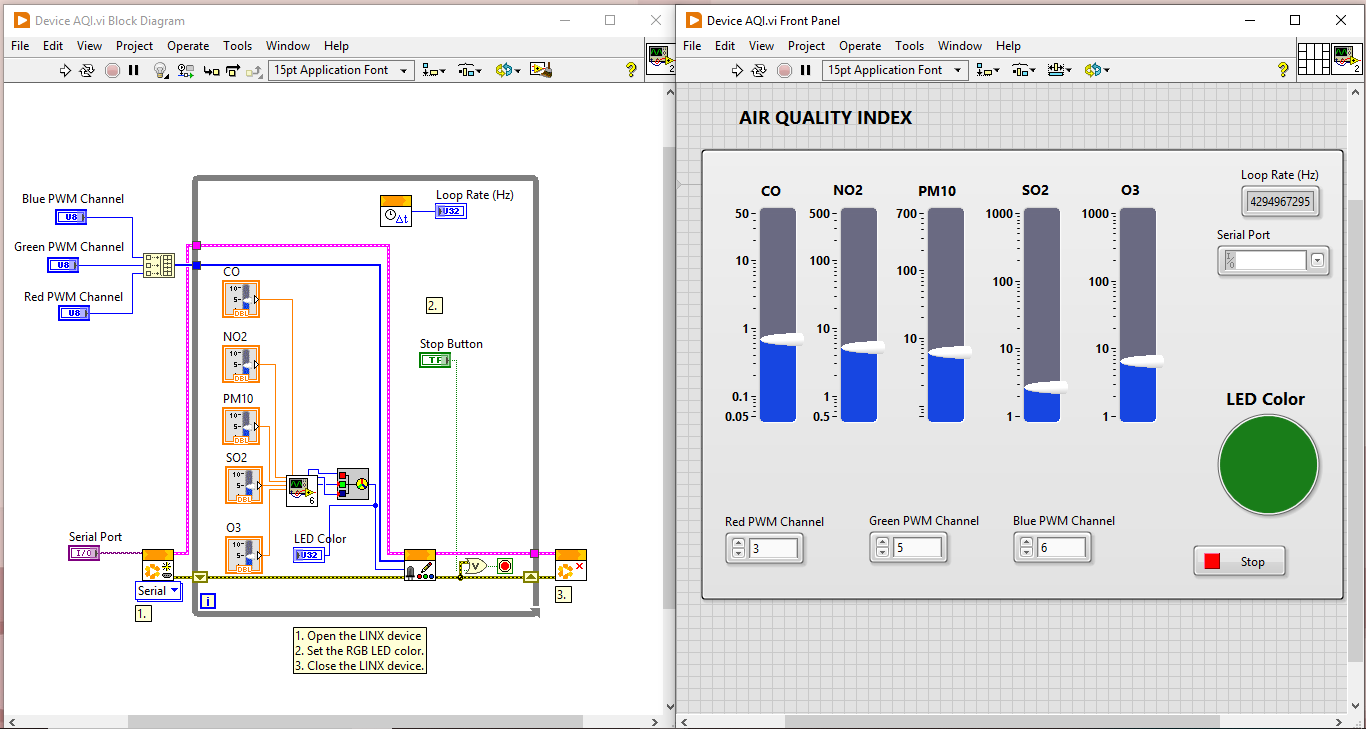
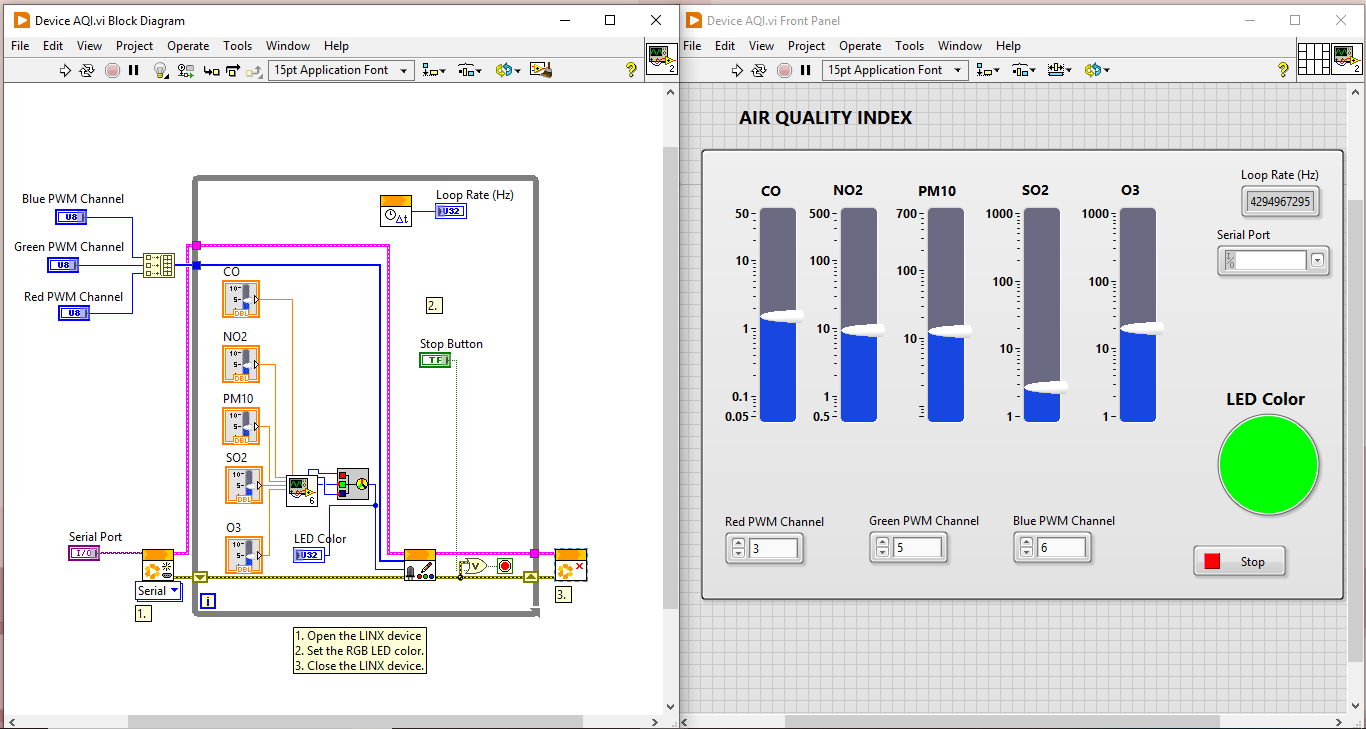
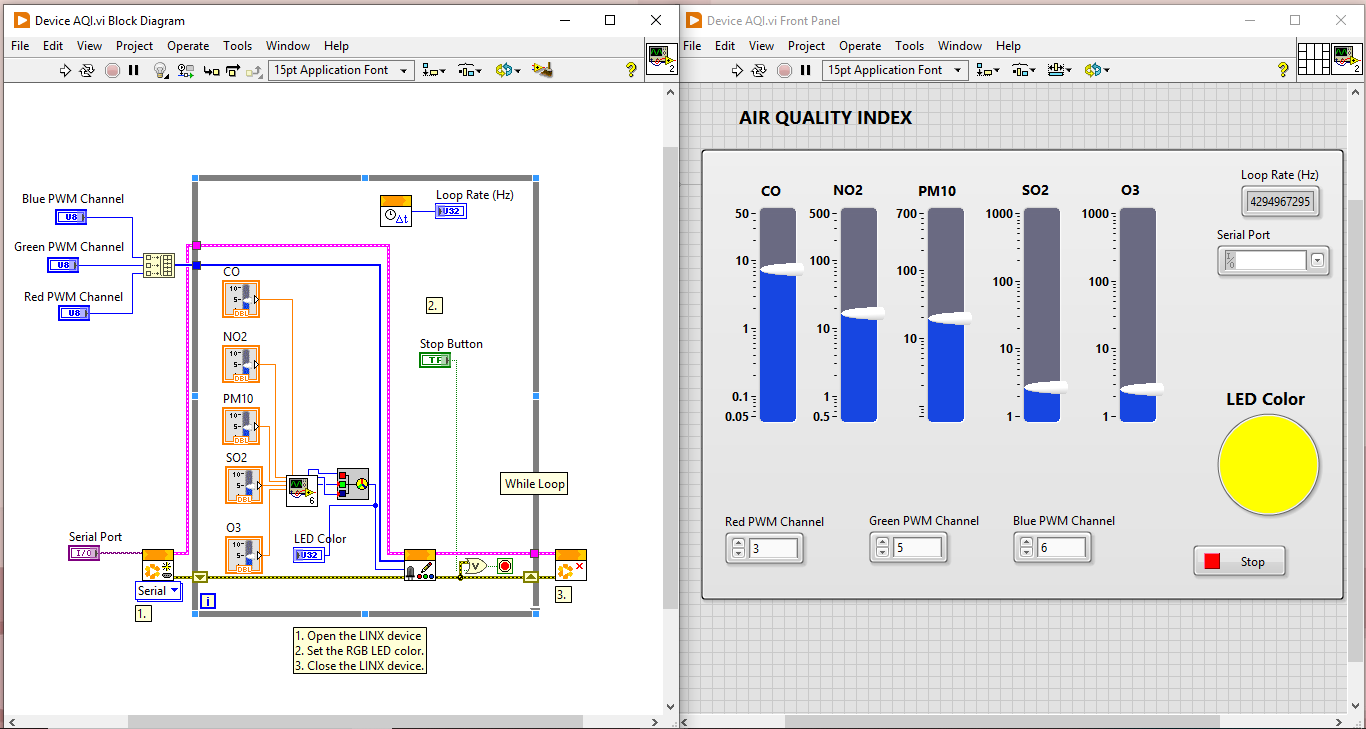
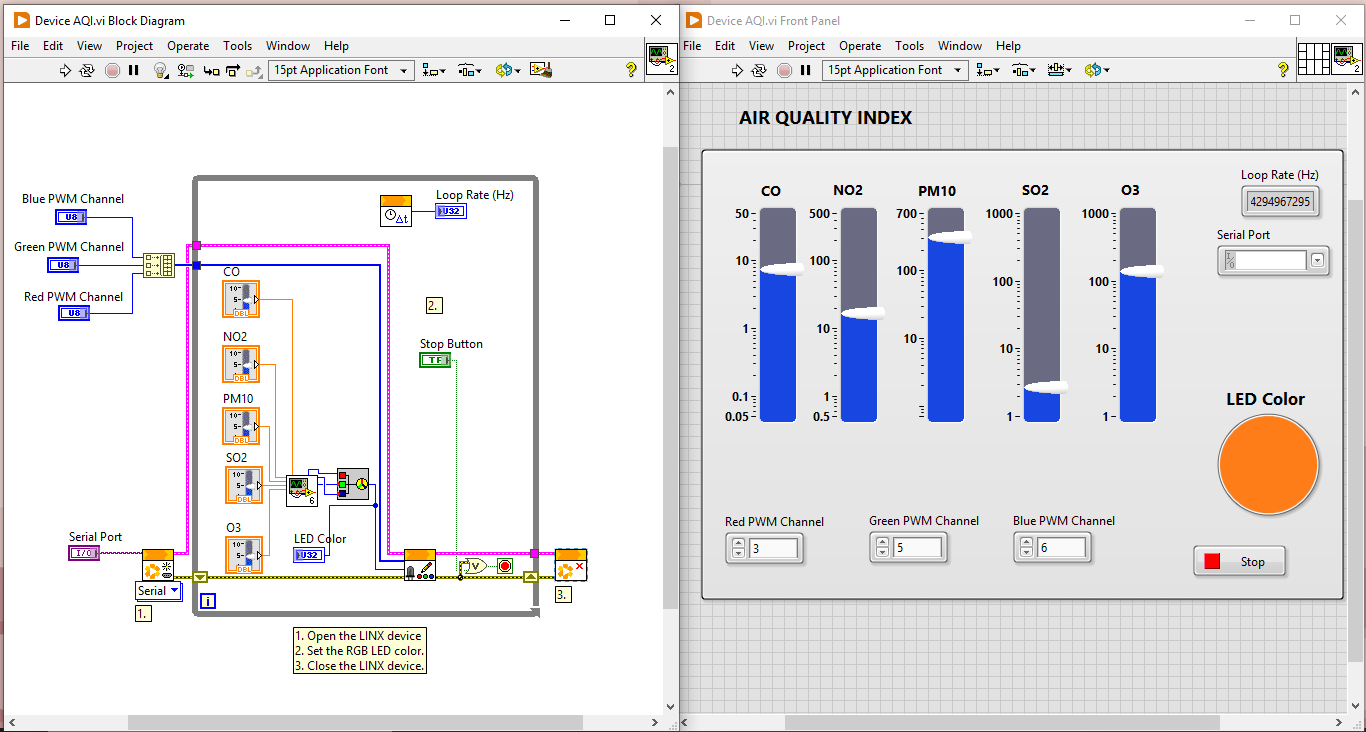
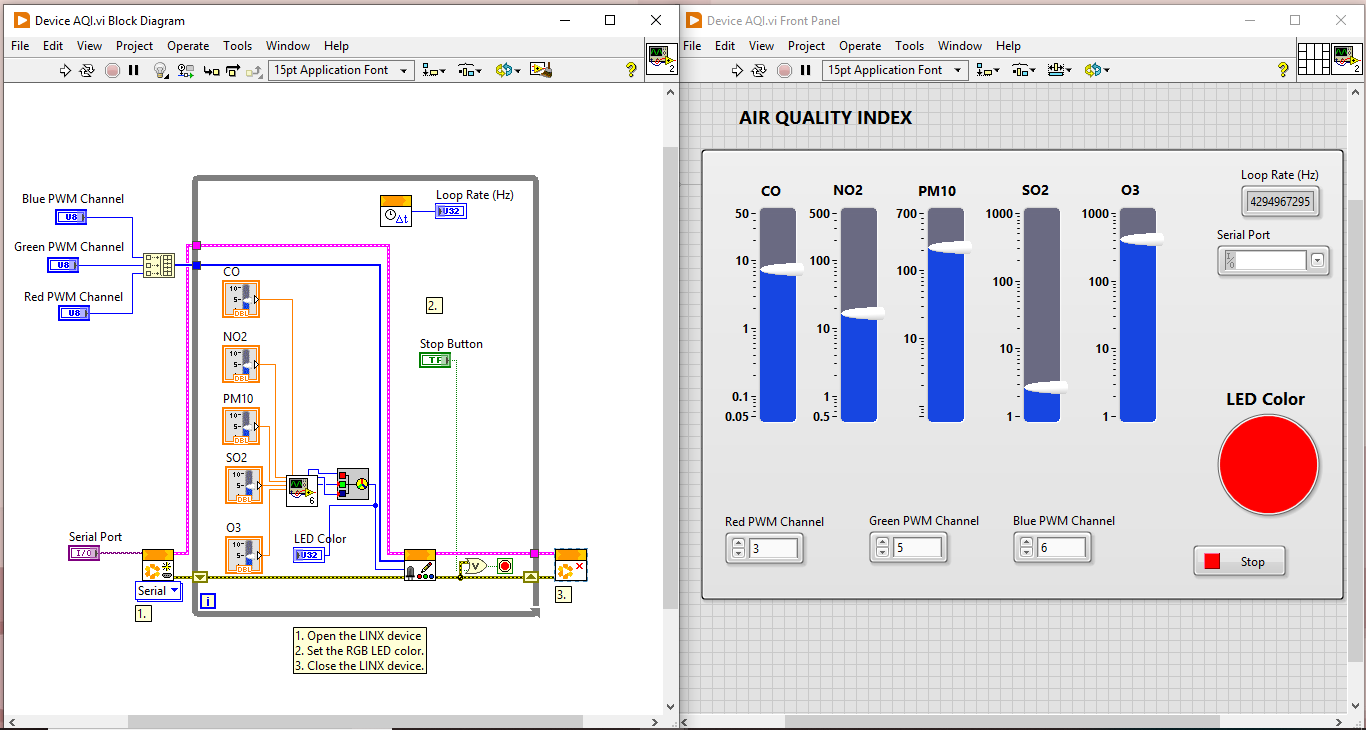
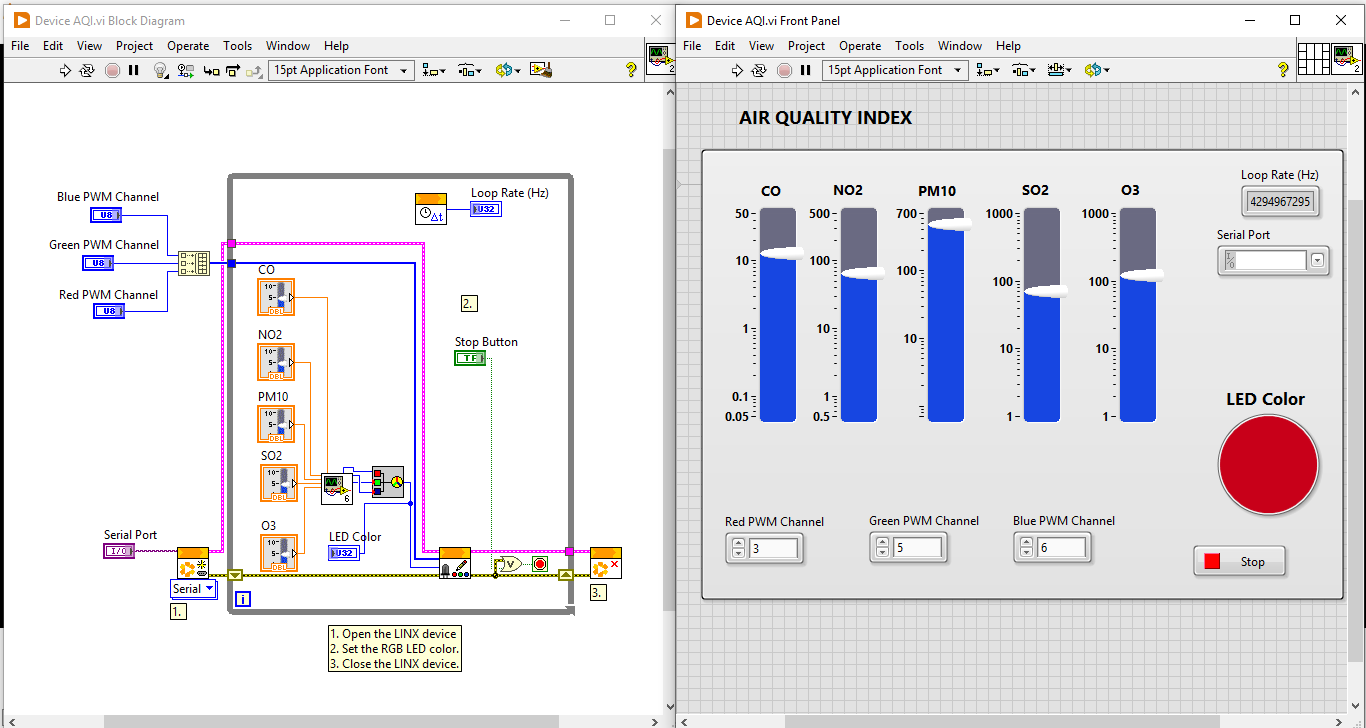
Graphical program running to select RGB colors on PWM GPIO pins in Raspberry PI
The graphical program should be uploaded to Raspberry Pi to generate RGB color through its GPIO pins. The sensors read data and process in the LabVIEW and the result will be displayed by the Hardware kit to indicate the level of pollution.
It was good experience for me as a beginner to LabView to design the project for AQI.
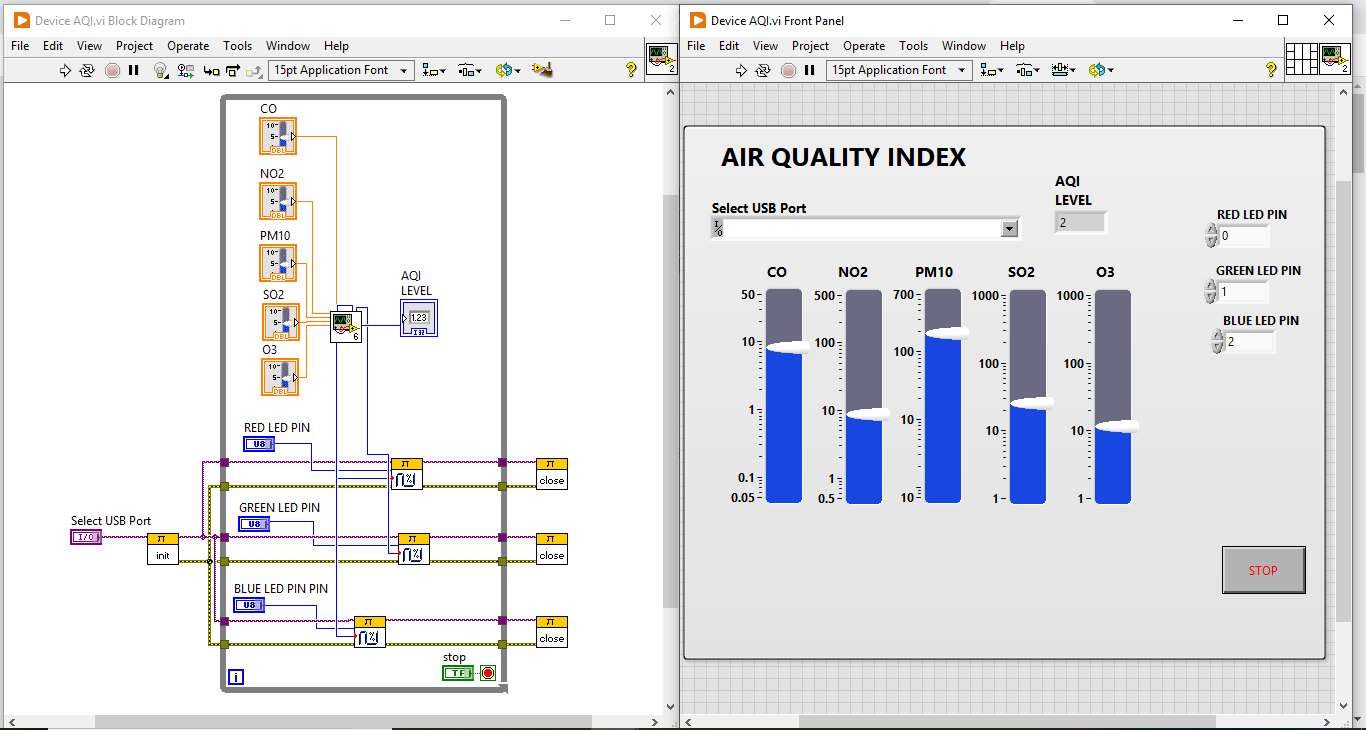
After all the testing and automation finally the VI for AQI is created to indicate the AQI level with Color code using RGB LED & Raspberry PI PICO is shown in below figure.
Hardware Circuit:
The GPIO pins of Raspberry PI PICO are connected to the RGB LED. The output of the pins are made into PWM signal generator and the output make the LED from LOW to HIGH with a level of 0-255.
Interfacing the RGB LED to Raspberry PI PICO is shown in below figure.
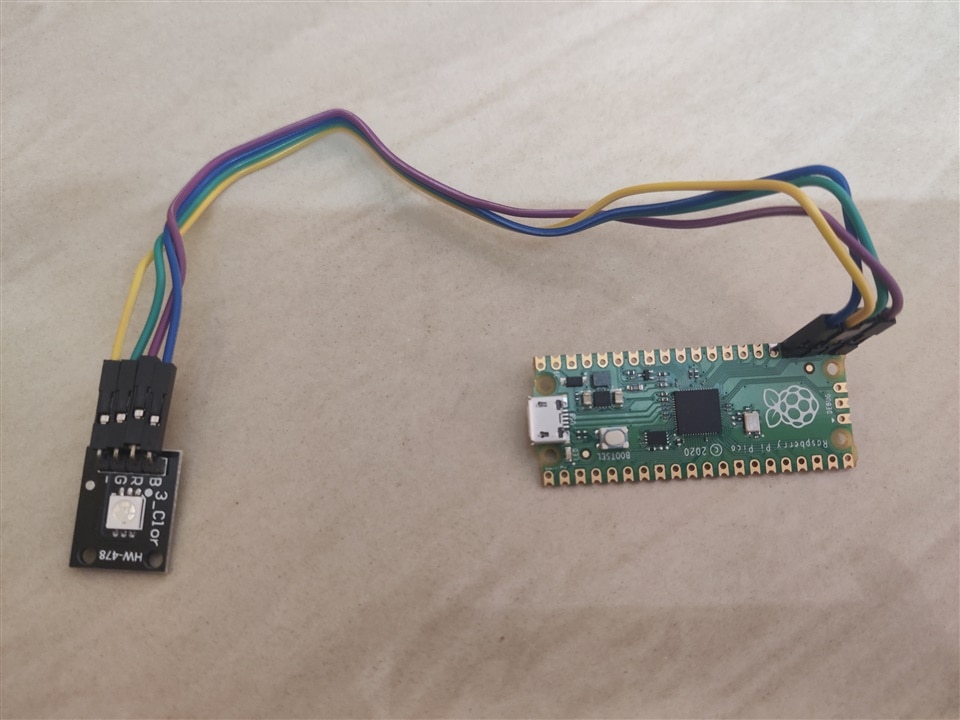
Final video on producing the output on Raspberry PI PICO is shown below.
The air quality devices are useful in households, shopping malls, offices, schools, hospitals, industrial sites, mining areas, factory sites, forest regions, etc to notice the air quality when the environment is affected by air pollution. In many major cities due to traffic, urbanization, waste burning causes the increase in pollution as to clean pollution by nature it takes more time because the production is more.
References:
1) https://www.ni.com/en/shop/labview.html
2) https://urbanemissions.info/tools/aqi-calculator/
3) https://www.pranaair.com/blog/what-is-air-quality-index-aqi-and-its-calculation/
5) https://www.raspberrypi.com/products/raspberry-pi-pico/
7) https://github.com/jancumps/pico_scpi_usbtmc_labtool/releases/tag/v0.6.2
8) /technologies/test-and-measurement/b/blog/posts/pst-program-the-pico-scpi-labtool
