Introduction
In this blog post, I will show how I made a monitoring system for my home solar using LabVIEW and Raspberry Pi Pico. I was aware of the National Instrument LabVIEW program but had never used it before. After enrolling in NI LabVIEW RoadTest I downloaded the Community Edition of LabVIEW and started exploring it. Soon I discovered the potential of LabVIEW and realized the easiness of the tool. I completed all the lessons and quizzes from the RoadTest page and from lesson 10 I came to know about the SCPI tool for communication with Raspberry Pi Pico from the LabVIEW. I read "Have you worked with the Pico SCPI labTool?" by shabaz and "Program the Pico SCPI labTool" by Jan Cumps and got a clear idea about VISA and SCPI tools. Thanks to both of them for their contribution.
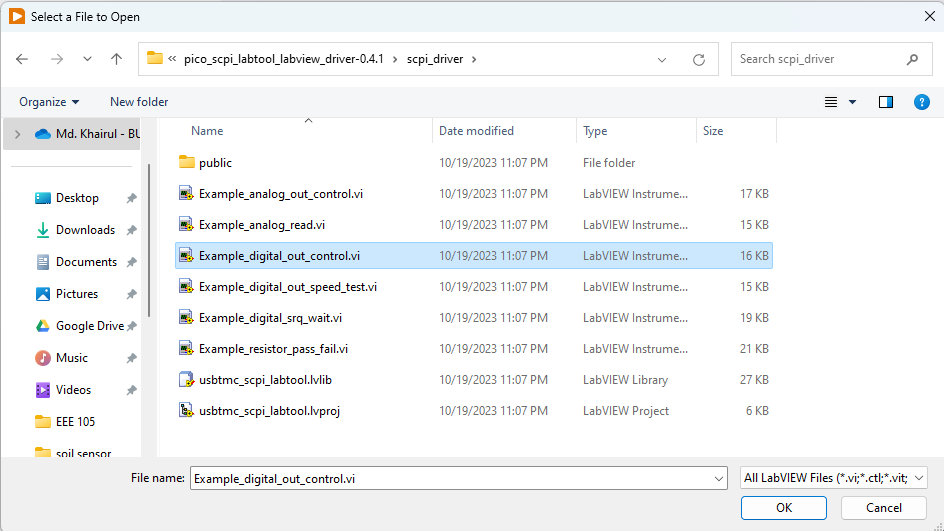
I downloaded the Pico Firmware and LabVIEW Virtual Instrument driver with examples from GitHub. I transferred the pico_scpi_usbtmc_labtool.uf2 to my Raspberry Pi Pico, connected an LED to GPIO 22, and opened the Example_digital_out_control.vi with the LabVIEW community edition.


I turned on the Enable Pin switch and ran the model. The LED was turned on. The VISA resource may not directly appear in the VISA resource control box. After connecting the Pi Pico to my computer using the USB cable I clicked on the dropdown icon from the right side of the VISA resource control box and clicked the Refresh. The VISA resource successfully appeared and was selected.

Monitoring Solar Panel & Battery
In my village, I installed a 700W solar system for my home. A few of my neighboring home also uses solar energy. My goal is to build a solar mini-grid by connecting all the homes so that we can share the energy whenever required. I want to automate the system with the help of LabVIEW. As a very first step, I want to measure some important parameters of my own solar home system and monitor the parameters using NI LabVIEW. I will use Raspberry Pi Pico for interfacing the system with the computer. First I want to monitor the solar panel voltage, battery voltage, charging current, and load current. For measuring 4 parameters I need four analog inputs.
The Pico Firmware currently supports two analog inputs (GPIO26 and GPIO28). It can be extended by modifying the firmware but there is an alternative solution. I can easily connect up to 4 analog sensors by using an ADS1115 module through the I2C0 port of the Pico. Thanks shabaz for bringing this functionality to the Pico firmware.
I connected the ADS1115 ADC module to Pico I2C0 (GPIO4[SDA], GPIO5[SCL]) to enable the get analog input (high resolution) function. The example folder does not contain any example for reading analog values with ADS1115. So, I made one myself with the VI library provided with the example.

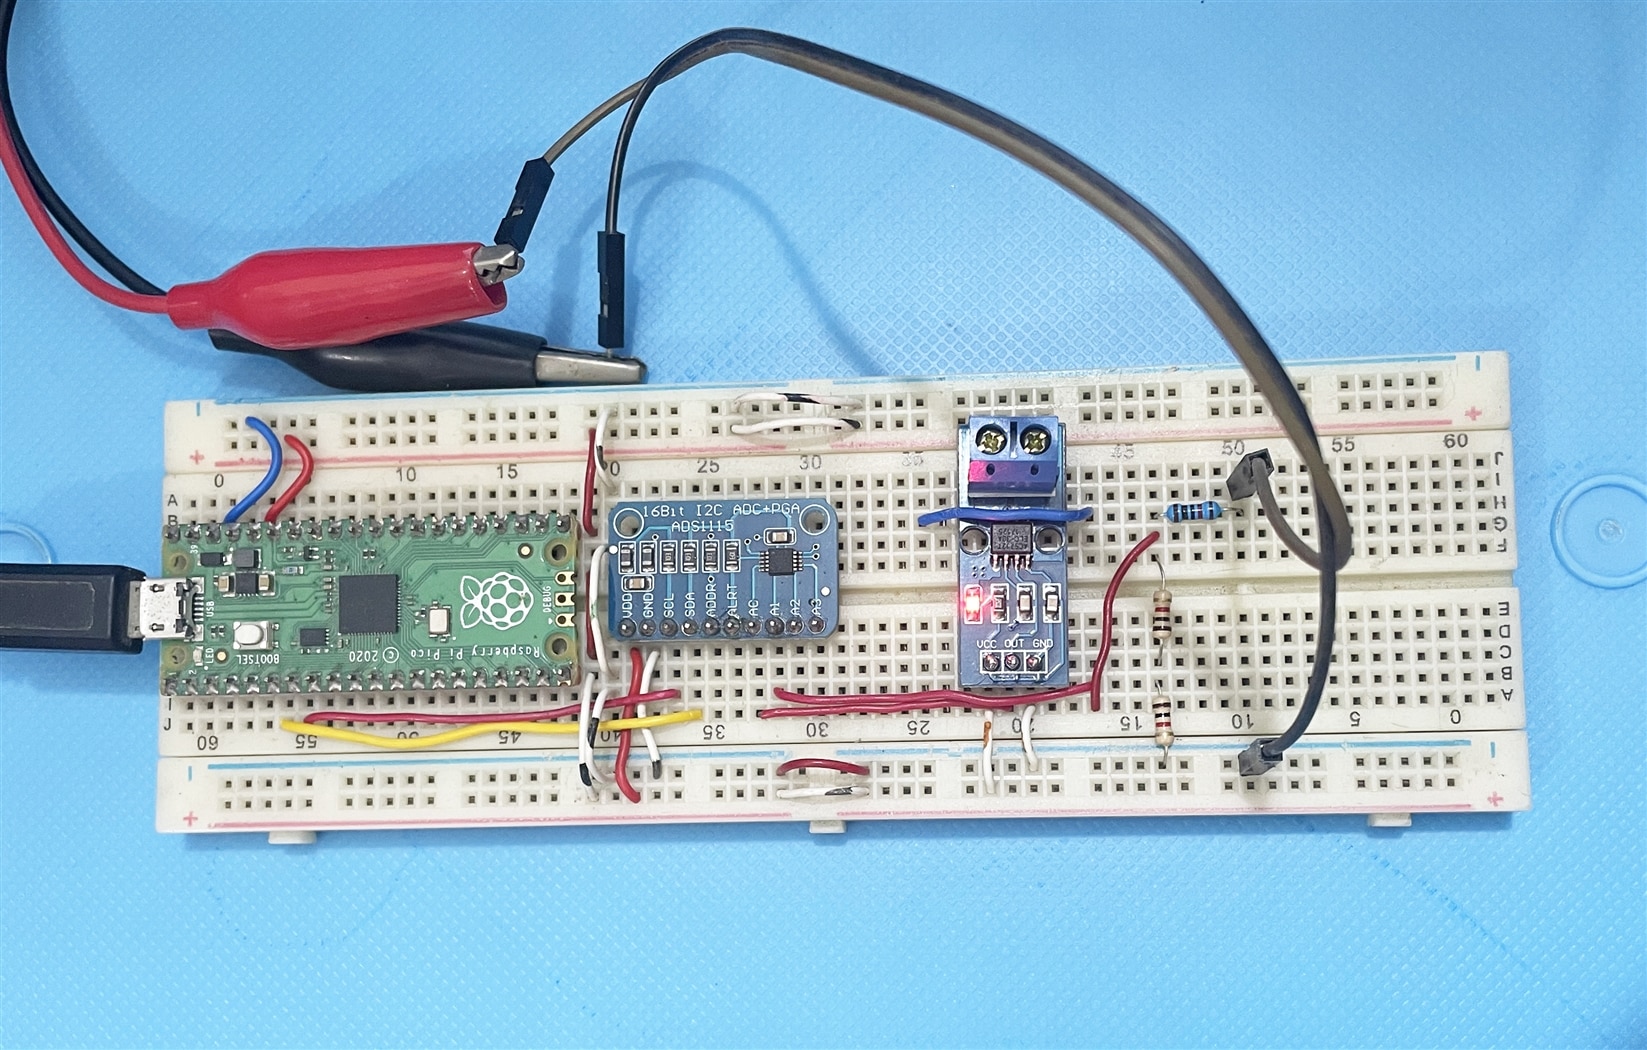
I was able to successfully read the analog value from the ADS1115 module. The following image shows the connection between the Pi Pico and the ADS1115 module.

For measuring current I used a Hall sensor-based ACS712 current sensor module which is capable of measuring both DC and AC current. The ACS712 sensor is 5V compatible and provides analog output, so the output of the sensor can be connected directly to the input of the ADS1115. I used the ACS712 for measuring both the charging current and the load current. 
My solar system is a 12V system. The battery voltage is 12V and the open circuit voltage for the panel is around 22V. The voltage can not feed directly to the ADS1115 sensor. I used a simple resistor voltage divider to make the voltage compatible with the sensor.
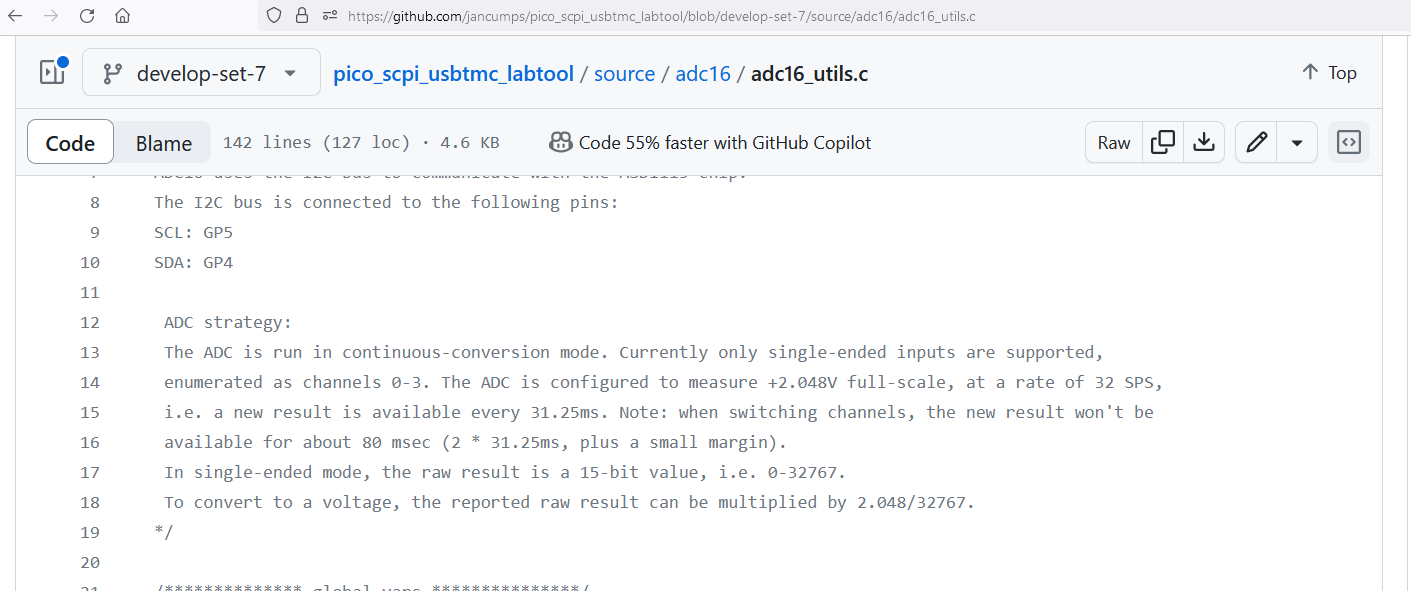
For calculating the value of the resistors for the voltage divider I need to know the gain set for the ADS1115 in Pico Firmware. So I opened the source of the firmware and found the following ADC strategy in the comment block.

The ADS1115 is configured to read a maximum of 2.048V. So, I need to convert the output voltage from the battery and the solar panel to 2.048V using a voltage divider circuit.
The open circuit voltage of the solar panel is 22V. So I used 2K (1K + 1K) and 20K (10K + 10K) resistors to produce approximately 2V output for 22V panel voltage. Similarly for measuring battery voltage, I used one 10K and two 1K resistors for dividing the voltage. The schematic is shown in the figure below.

I modified the block diagram to convert the raw analog value to the voltage. 2.048 is the maximum voltage when the analog value is 32767. So, I multiply the analog value with the ratio of 2.048 and 32767 to get the voltage. Finally, I multiply the voltage by 6 to get the actual voltage as the voltage divider circuit provides 2V for 12V input.

I checked the circuit by providing variable voltage from a power supply and I was getting almost accurate results from the VI. The test circuit arrangement is shown in the image below.

The final circuit looks like the Fritzing schematic presented below. I did not find any 12V battery in the Fritzing library. So, I represented it with a 9V battery for reference purposes. The load is represented by an LED. The charge controller is shown by a comment block.

The complete LabVIEW block diagram is shown in the screenshot given below. All 4 channels of the ADS1115 module are used for data collection. Every channel is read with a 100ms delay.

A close-up view of the part of the block diagram is as follows from where current and voltage calculation can be observed very clearly.

A screenshot of the front panel is illustrated by the screenshot attached below.

When the system is running the front panel shows the data collected from the Raspberry Pi Pico as given below:


Top Comments