Cable Ferrites and Nanocrystalline Sleeves for Automotive Applications
ANP115 by Dr. Heinz Zenkner, Jose Rocamora
01. INTRODUCTION
The opportunity to fundamentally change the way we travel is currently driven by regulatory changes, consumer behavior and technology. Governments have introduced regulations and incentives to accelerate the transition to sustainable mobility. Regulators around the world are setting stricter emissions targets. Consumer behavior and awareness are changing as more people accept alternative and sustainable forms of mobility. Industry players are accelerating the pace of innovation in automotive technology by developing new concepts for electric, connected, autonomous and shared mobility. Electrification plays an important role in the transformation of the mobility industry and offers great opportunities in all vehicle segments. In order to ensure a fast and broad acceptance of electric mobility, the rapid market introduction of new e-vehicles is an important process. From an EMC point of view, the integration of electric drive systems in today's automobiles is a major challenge. The electric drive system is a component consisting of a high-voltage power source, a frequency converter, an electric motor and shielded or unshielded high-power cables. Because of the limit values to be met, the EMC challenges in the development of electric drive systems are high and so the measures to comply with the requirements are also diverse. One of the measures often used is the application of cable sleeves made from ferrite or nanocrystalline. These are rings or sleeves made of a material that has special magnetic properties. If such a sleeve is placed over a cable, the radiation of high-frequency energy ("EMC interference") from the cable can be reduced. In order for this, at first glance, simple EMC measure to be successful, certain prerequisites must be observed, which are shown and explained in this application note. The brief theoretical explanation of the functional principle and the most important influencing parameters is supplemented by practical measurements. It should also be mentioned here right away that it is unimportant whether this cable system is considered in an electric vehicle, in an industrial machine or in an energy system of a building, because the physical laws are the same everywhere.
02. TECHNICAL BACKGROUND
The intrinsic physical properties of the sleeve material, the geometry of the sleeve and the electromagnetic properties of the cable system determine the effectiveness of this method. The cable system consists of the signal or interference source, the cable itself and the signal consumer, i.e. the interference sink. Figure 1 schematically shows such a system.
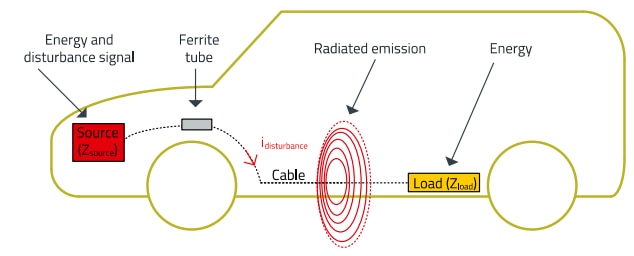
Figure 1: Schematic diagram of a cable system with interference radiation
The source in Figure 1 is the origin of the interference signal containing both the useful signal (a pulsed DC voltage for a motor drive) and the interference signal (harmonics of the switching frequency). Both are conducted via the cable to the load (motor).
Part of the energy conducted via the cable is radiated into the environment as an electromagnetic wave and, depending on the amplitude, can cause interference in other circuits of the vehicle, or in neighboring electronic devices. Figure 1 also shows the sleeve mentioned earlier. It is intended to attenuate a part of the interference energy and not to influence the useful signal.
Note on the term "ferrite" sleeve:
Nanocrystalline (NC) material is not a ferrite material, but an iron-based material with a special crystal structure created by the manufacturing process. The manufacturing process produces ribbons with special magnetic properties. The ribbons are wound into sleeves or rings and can thus be used in a similar way to ferrite sleeves. For better readability, the nanocrystalline sleeve is also included in the following text under the terms "ferrite sleeve", "cable ferrite" and similar.
03. PARAMETERS TO CONSIDER FOR THE EFFECTIVE APPLICATION OF THE SLEEVE
There are numerous influencing factors, such as electrical and physical parameters, which significantly affect the effectiveness of a cable sleeve for attenuating high-frequency electromagnetic interference. The most important parameters include: Amplitude spectrum of the interference signal
- Impedances of interference source, load, cable/coupling path
- Electrical characteristics of the ferrite- resp. NC sleeve
Further properties that influence the effectiveness of the interference suppression measure are:
- The electrical environment; are there other cables ormetal sheets in the immediate vicinity?
- Fixing and installation options for favorable mounting of the sleeve.
The following sections explain the above points and illustrates them with practical measurements.
3.1 Signal and impedance conditions in electric vehicles
Research into the amplitude spectra of the interference signals and system impedances in electric vehicles has led to very divergent results. In summary, the following parameters can be assumed:
- The interference spectrum extends over a frequency range from 10 kHz to 10 MHz, in rare exceptions up to 50 MHz
- Source and sink impedances are not defined
- Insertion impedance (serial impedance in the cable branch) for interference signal attenuation:
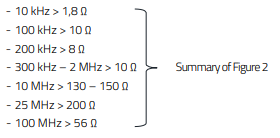
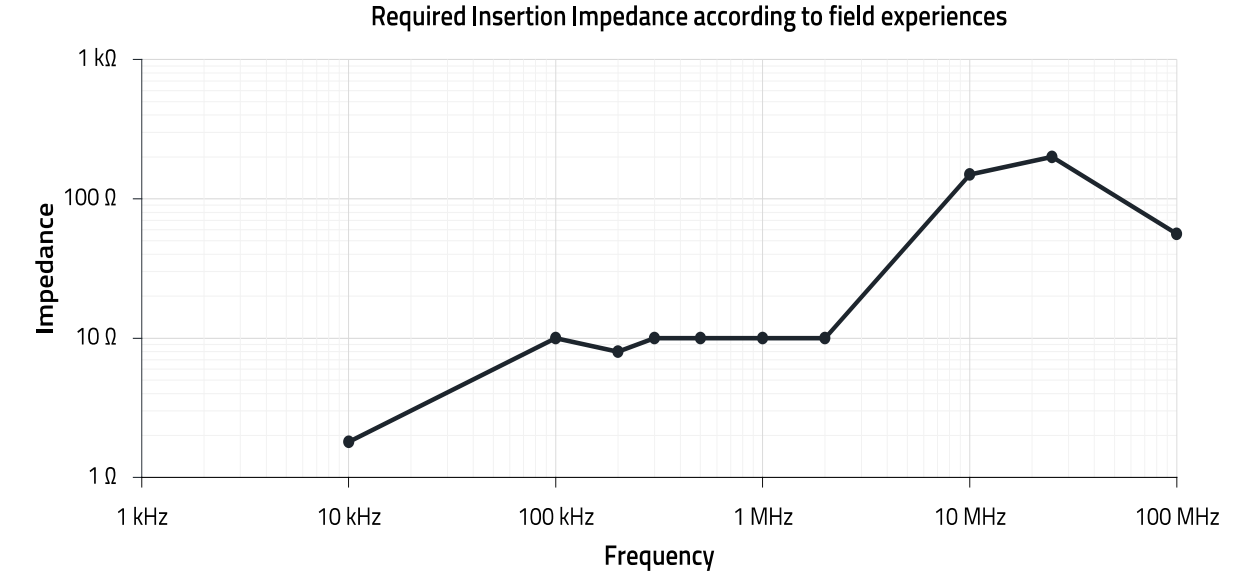
Figure 2: Overview of the required insertion impedance in the cable system
Figure 2 shows that the insertion impedance and thus the insertion loss must increase with increasing frequency and should reach its maximum at approximately 20 MHz. Since the source and sink impedances are not known, typical values are assumed, thus covering the "worst case":
- Source impedance: 0,1 Ω … 5 Ω
- Load impedance: 100 Ω… 2 kΩ.
An additional requirement for some cable harnesses of the electromobile application are the high supply voltages and the very high direct currents through the cables.
- Voltage range: 265 VAC – 880 VDC
- Current range: 48 A – 870 A
Thus, protective distances must be taken into account during installation due to the high voltage and attention must be paid to saturation effects of the sleeve material due to premagnetization by high currents.
3.2 Sleeve Materials and Essential Electrical Parameters for an efficient application
"Cable ferrites" are generally sleeves or rings that create a resistive ("ohmic") and inductive series impedance due to their magnetic material properties. This impedance is frequency dependent and depends on the properties of the material; this means that for effective attenuation, the interference frequency range and the material properties must match. The impedance of a ferrite / NC material is described via the complex permeability.
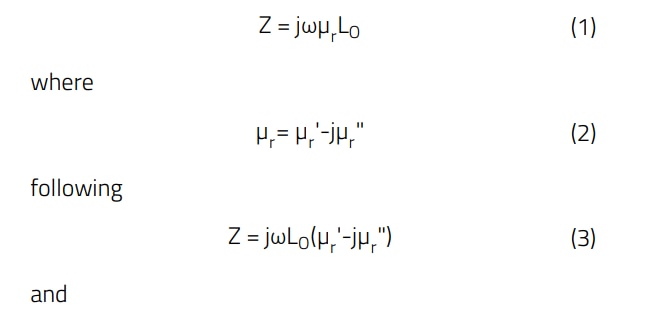

where
µr ' = Real part of the complex permeability (reactive)
µr " = Imaginary part of the complex permeability (resistive)
j = Operator denoting the imaginary part of the complex number
LO = Inductance of the "coil" without ferrite/NC (air core coil). The magnetic permeability thus splits into two components. The real component (µr ') represents the reactive part and is in phase with the alternating magnetic field, while the imaginary component (µr ") represents the losses and is out of phase with the alternating magnetic field.
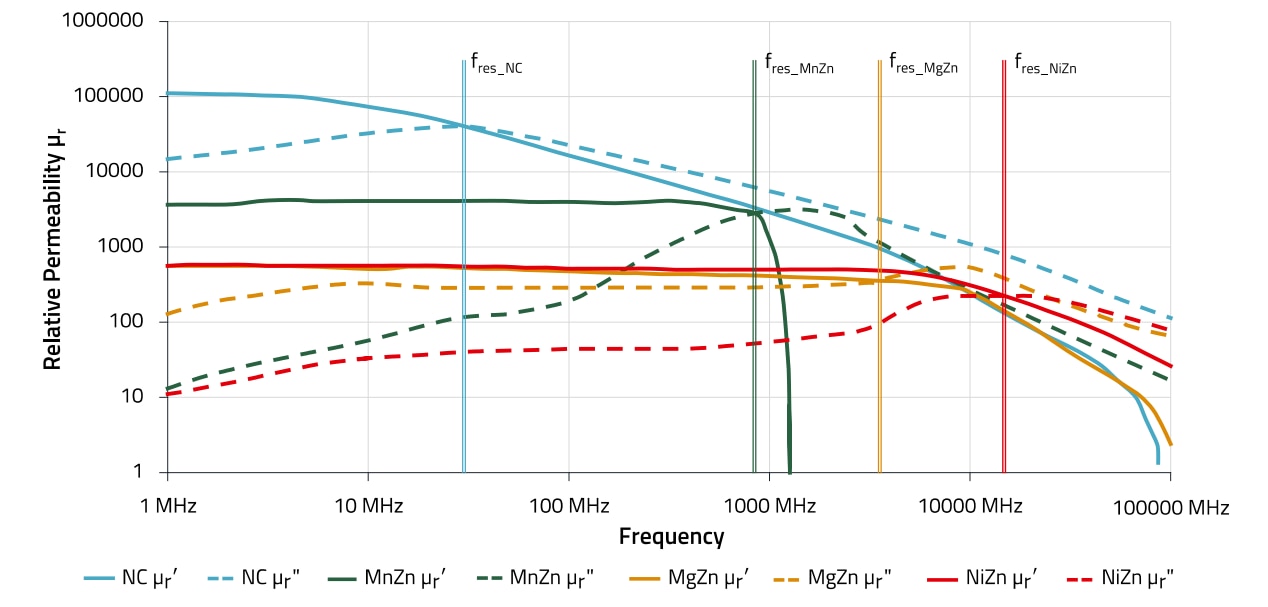
Figure 3: Comparison of the complex permeability of four different sleeve materials
Figure 3 shows the complex permeability of four different materials, nickel-zinc ferrite (NiZn), magensium-zinc ferrite (MgZn), manganese-zinc ferrite (MnZn) and a soft magnetic material with a nanocrystalline structure (NC). The following can be seen from the curves in Figure 3:
- The NC material has the highest permeability µr " in the frequency range up to 100 MHz.
- All four materials have a transition where µr " and µr ' cross. This is the so-called resonance range of the material. Below the range, the impedance of the material behaves predominantly inductively, in the resonance range and above resistively.
- If the resistive range of the materials is to be used as a component for the attenuation of "interference currents", there are roughly preferred frequency ranges:
- NiZn: above 5 MHz
- MgZn: above 1 MHz, broadband, similar to NiZn
- MnZn: 500 kHz to 5 MHz
- NC: Due to the high permeability, broadband up to approximately 100 MHz, whereby the permeability at typical 500 kHz has already decreased by a factor of 10, so that the use of NC is preferred in the frequency range up to approximately 1 MHz.
The impedance of sleeves for EMC applications is usually specified in data sheets at certain frequencies and is the scalar quantity representing the magnitude of the complex impedance vector. MgZn is a well-known material which can be used up to very high frequencies, typ. > GHz. However, the linearity of the impedance depends on linearity of the relative permeability of the respective material. As can be seen in Figure 3 compared to NiZn, MgZn has a pronounced resonance frequency at approx. 4 MHz. The permeability of NiZn crosses here at approx. 11 MHz. In general, with geometrically identical sleeves, typical curves of the initial permeability result as given in Figure 3. But in addition, the manufacturing tolerances of +/-25%, the frequency specifications according to the data sheet and possible material dependent range of ur due to mixing ratio variation must be taken into account. Only then can ferrite sleeves be directly compared with each other. For example, the initial permeabilities of some materials overlap, so that a preference for a particular material is not easy to choose, the following Table 1 shows the typical parameters “initial permeability µr,i” and “preferred frequency range” of different ferrite materials and the nanocrystalline material for comparison.

Table 1: Typical parameters “initial permeability µr,i” and “preferred frequency range” of different ferrite materials and the nanocrystalline material for comparison
3.3 Basic principle of a set up with a cable and a ferrite / NC sleeve
As already mentioned, ferrite sleeves for EMC applications are generally specified in terms of impedance, but the attenuation in the application is ultimately dependent on the system impedances (source, cable, sink). These impedances are usually complex and cannot be determined in practice. For practical applications, however, a laboratory setup can show which parameters have the greatest influence on the effectiveness of the interference suppression measure.
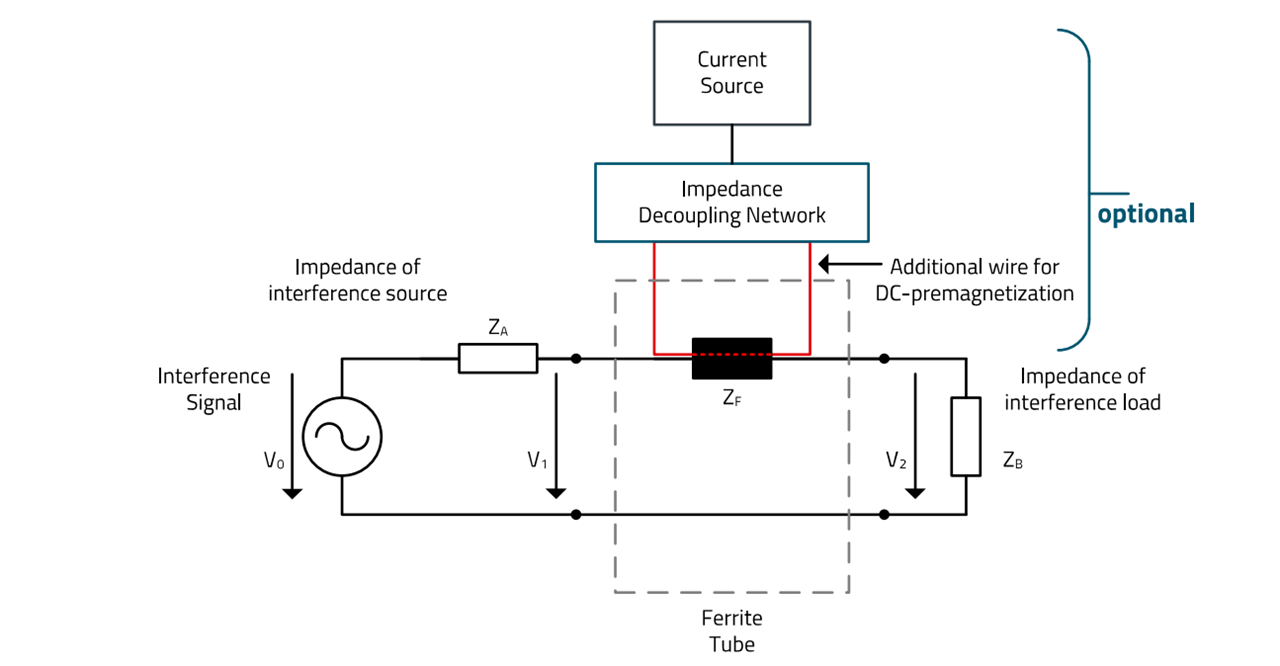
Figure 4: Functional diagram for determining parameters for attenuating high-frequency signals on cables using ferrite sleeves
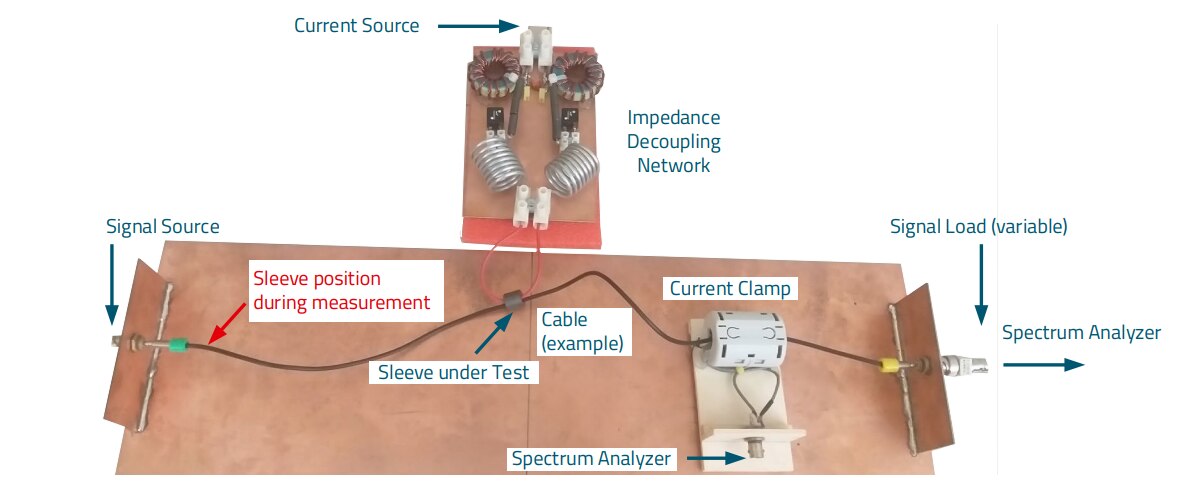
Figure 5: Laboratory set-up for determining parameters for the attenuation of high- frequency signals on cables using ferrite sleeves according to Figure 4
Figure 4 shows the functional circuit diagram. It is decisive for the function of the interference suppression measure that the source and sink impedances of the useful signal are not used for the determination of the attenuation, but the impedances of the interfering signal. In practice, the impedance of the interference source hardly differs from the impedance of the source of the wanted signal. It is different with the sink, here the impedance of the cable, the inductive and capacitive coupling parameters of the "cable environment" and finally the complex impedance of the useful signal sink have a great influence with regard to the highfrequency interference signal. Figure 5 shows the concrete laboratory setup of the system according to Figure 4. Explanation of the set-up:
- Signal Source: Signal generator of the spectrum analyzer is selected for the insertion loss (50 Ω). Alternatively, the square wave signal of a push-pull GaN buck converter can be connected as a source to assess the behavior at low source impedance (< 1 Ω)
- Cable (example): Testing with different cables possible (e.g. also coaxial, flat ribbon).
- Ferrite tube under test: Test specimen, ferrite sleeve in this example. The ferrite sleeve is positioned approximately 20 mm from the signal input. During the measurement, the cable and the ferrite sleeve are kept at a distance of 10 mm above the ground plane.
- Current Clamp: Current clamp for measuring the interference current from the cable. Calibration is carried out by a blank measurement without the test sample.
- Signal Load (variable): Load, impedance termination at the end of the cable. Can be selected variably to show the effect of different load impedances.
- Impedance Decoupling Network: Impedance decoupling of the current source in order not to corrupt the measurement result in case of premagnetization by the current source.
04. MEASUREMENTS
In order to show the influence of the most important parameters on the attenuation behavior, the attenuation behavior of the four ferrite materials was first compared in the frequency range between 100 kHz and 110 MHz. This showed that the two materials NC and MnZn are particularly suitable for the preferred low frequency range up to 50 MHz; these were compared in a further measurement with regard to their DC saturation behavior; in addition, the insertion loss was measured in the frequency range up to 10 kHz.
4.1 Comparison of the materials NiZn, MnZn, MgZn, NC
Insertion loss without premagnetization, cable (stranded wire) 1.5 mm2, inner diameter of ferrite sleeves approximately 6 – 8 mm, ferrite sleeve connected via cable with " ½ " turn, spectrum analyzer connected via a 50 Ω termination (not via current clamp), frequency ranges:
- 100 kHz – 10 MHz (Figure 7)
- 10 – 110 MHz (Figure 8)
The positioning of the ferrite sleeves is shown in Figure 6. The results of these measurements are shown in Figure 7 and Figure 8.
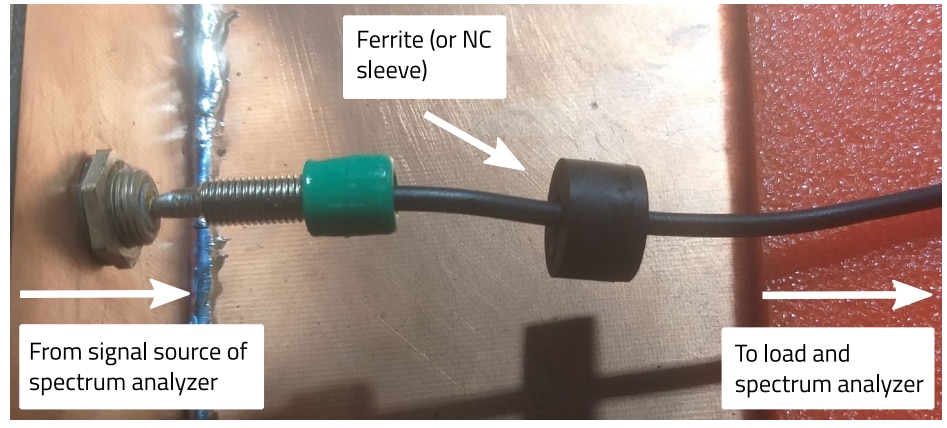
Figure 6: Positioning of the suppression sleeves in the structure according to Figure 5
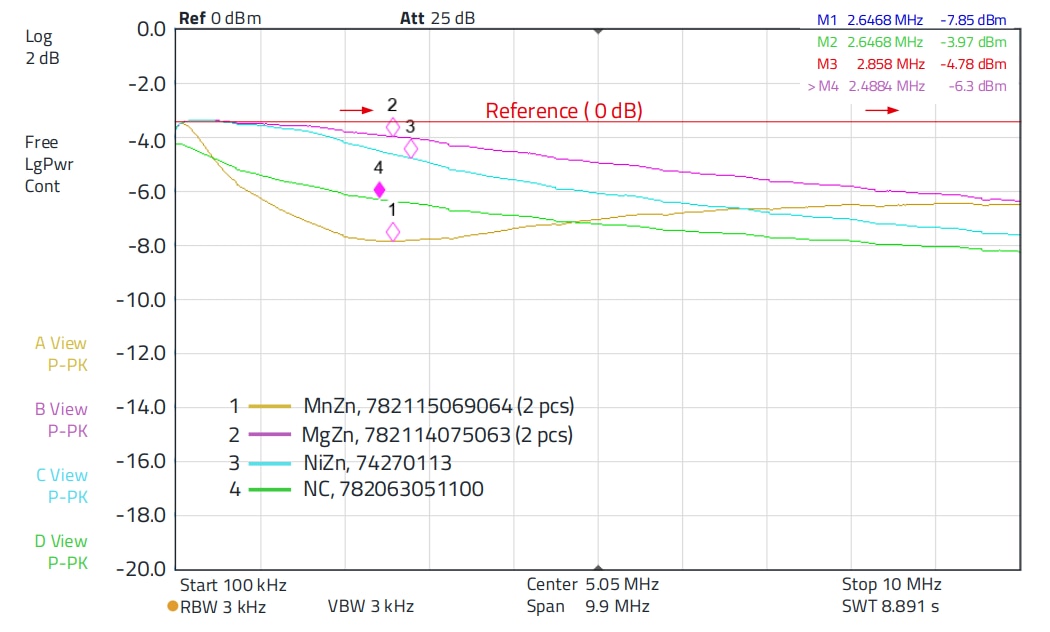
Figure 7: Insertion loss of the different suppression sleeves in the frequency range from 100 kHz to 10 MHz
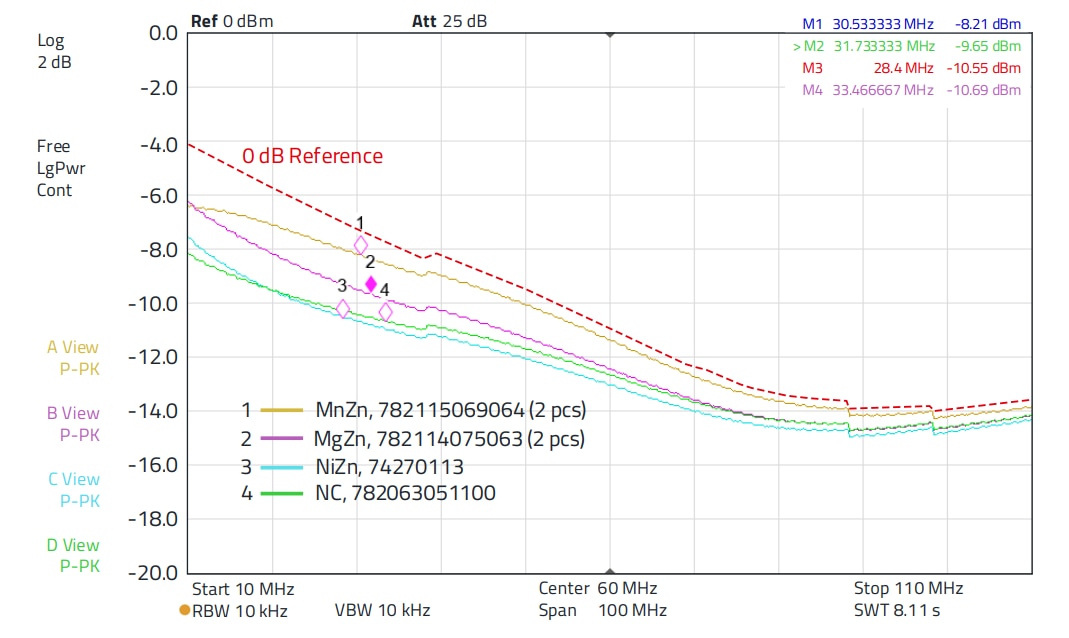
Figure 8: Insertion loss of the different suppression sleeves in the frequency range from 10 to 110 MHz
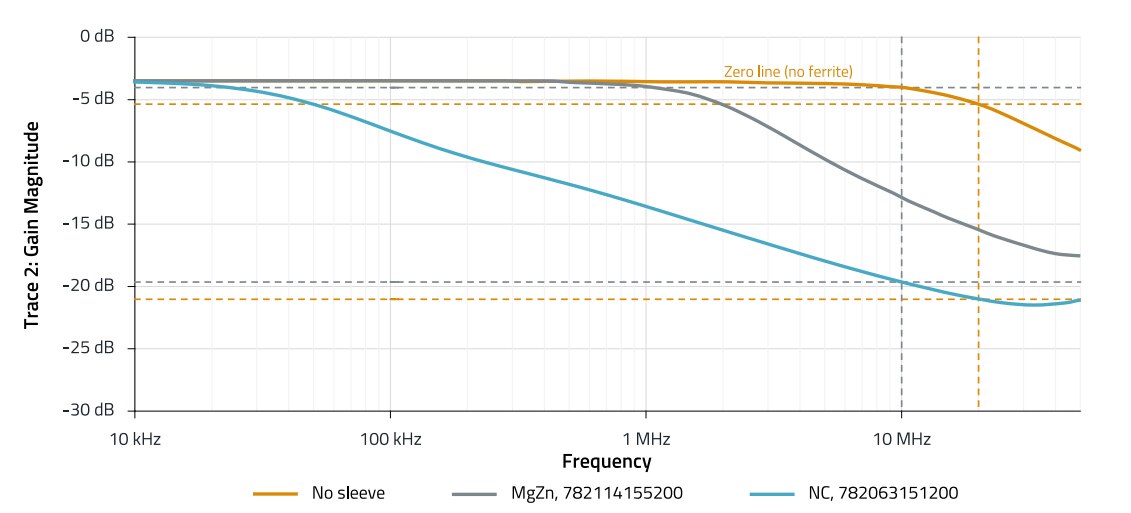
Figure 9: Comparison, insertion loss MgZn and NC in the frequency range from 10 kHz to 50 MHz
Interpretation of the curves in the range up to 10 MHz (Figure 7):
The MgZn material shows the lowest insertion loss over the entire frequency range, the NC material has high attenuation over the entire frequency range, in the range between 300 kHz and 4.5 MHz the MnZn material shows higher attenuation. MgZn and NiZn have only low attenuation in the frequency range below 2 MHz.
Interpretation of the curves in the range above 10 MHz (Figure 8):
NiZn and NC behave similarly and show almost equal attenuation between 10 MHz and 110 MHz, the attenuation of MgZn is slightly lower up to 60 MHz. MnZn has the lowest insertion loss over the entire frequency range. In the frequency range above 80 MHz, the parasitic capacitive couplings of the structure predominate, so that the differentiation of the attenuation properties is not possible here.
4.2 Comparison of the materials MgZn, NC in the frequency range above 10 kHz
Insertion loss without premagnetization, cable (stranded wire) 1.5 mm2, inner diameter of suppression sleeves approx. 15 – 16 mm, sleeve connected via cable with "1 ½ " turns, spectrum analyzer connected via a 50 Ω termination (not via current clamp), frequency range 10 kHz - 50 MHz. The measurement according Figure 8 shows the advantage of the NC material in the low frequency range. The NC sleeve shows an attenuation of approx. 2 dB from approx. 50 kHz, MgZn has reached this attenuation only from approx. 1.8 MHz
4.3 Comparison of the materials MgZn and NC in each case with/without DC bias magnetization
Set-up for measuring the insertion loss without and with premagnetization by direct current is shown in Figure 10.
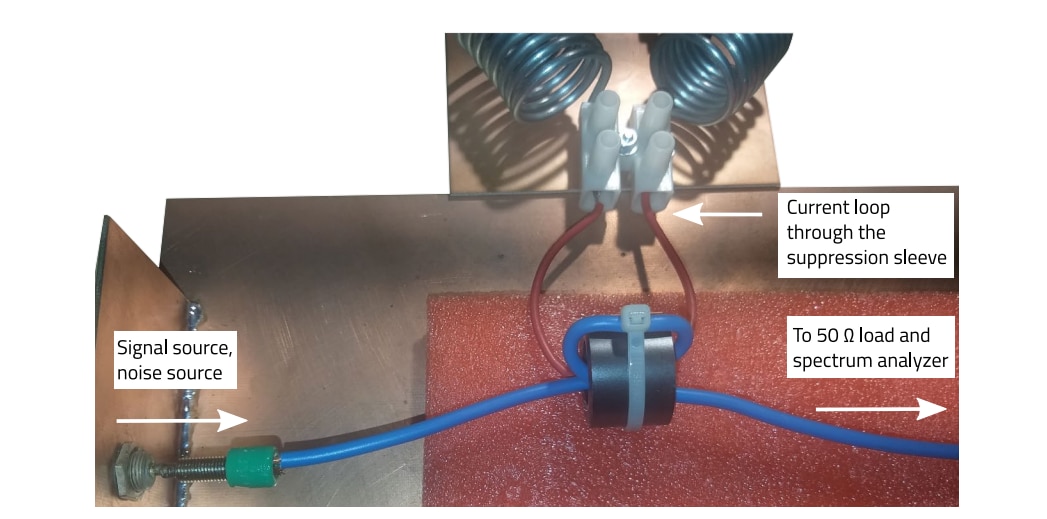
Figure 10: Set-up for measuring the insertion loss without and with premagnetization by direct current
Insertion loss with and without premagnetization, cable (stranded wire) 1.5 mm2 , inner diameter of ferrite sleeves approx. 15 – 16 mm, ferrite sleeve via cable with "1 ½ " turns, spectrum analyzer connected via a 50 Ω termination (not via current clamp), frequency ranges:
- MgZn, 10 kHz – 50 MHz (Figure 11), with / without premagnetization
- NC, 10 kHz – 50 MHz (Figure 12), with / without premagnetization
Figure 11 and Figure 12 clearly show the high "sensitivity" of nanocrystalline material (NC) to premagnetization by direct current. Already at a current of 3 A through the ferrite sleeve (Figure 12), the insertion loss at 10 MHz is reduced from 15 dB to 3 dB, at 10 A it is less than 1 dB. The reason for this is the high magnetic permeability of the nanocrystalline material ofµi = 30.000, compared to the magnetic permeability of the magnesium-zinc material of µi = 800. Due to the high magnetic permeability, the material saturates much faster. However, a comparison of the impedances from the data sheets in Figure 13 also shows the high impedance of the NC material in the lower frequency range up to 50 MHz. Another measurement with an impedance analyzer in the frequency range from 100 Hz to 50 MHz shows the impedances with the corresponding phase of the sleeves (Figure 14). The respective phase plateau shows the range of the resonance frequency, for NC material this is in the range between 1 kHz and 100 kHz, for MgZn material this is the range between 10 kHz and 2 MHz. In the platinum range of the phase and below, the material has a predominantly inductive effect, above that it has a predominantly resistive effect, i.e. it is lossy. The NC material is therefore more effective for the absorption of interference currents in the low frequency range of 10 kHz to 10 MHz and has a factor of 10 higher impedance than the magnesium-zinc material due to the already mentioned high permeability.
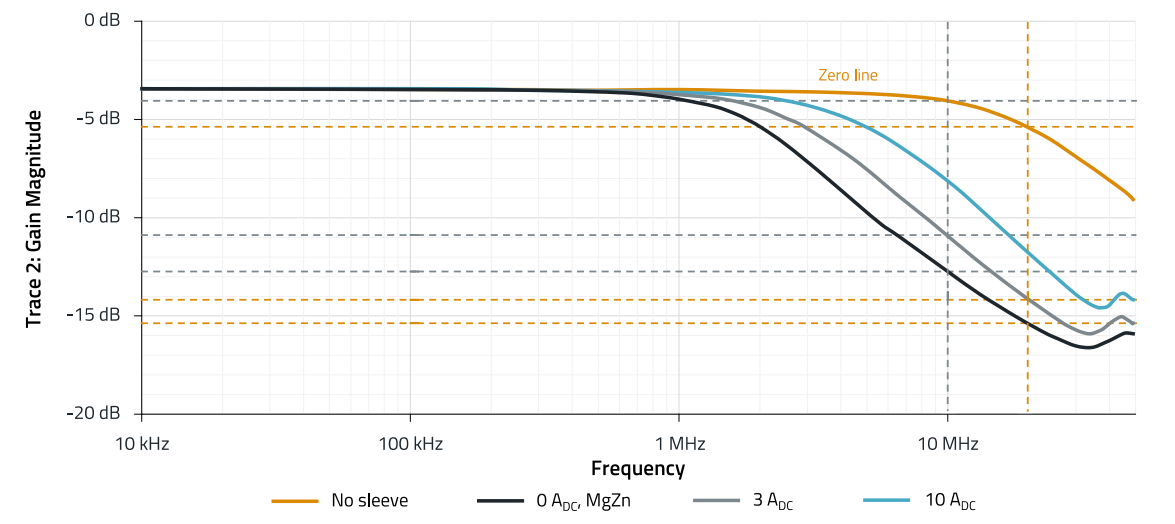
Figure 11: Insertion loss 10 kHz to 50 MHz, MgZn ferrite sleeve 782114155200, at 0 A, 3 A and 10 ADC premagnetization
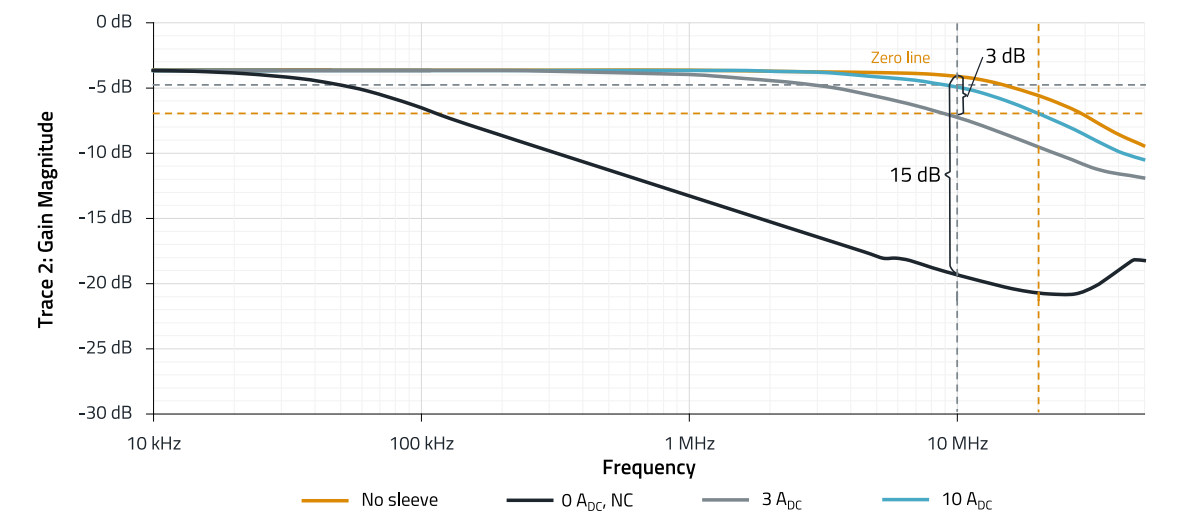
Figure 12: Insertion loss 10 kHz to 50 MHz, NC ferrule 782063151200, with 0 A, 3 A and 10 ADC premagnetization

Figure 13: Comparison of the impedance curves from the ferrite/sleeve data sheets
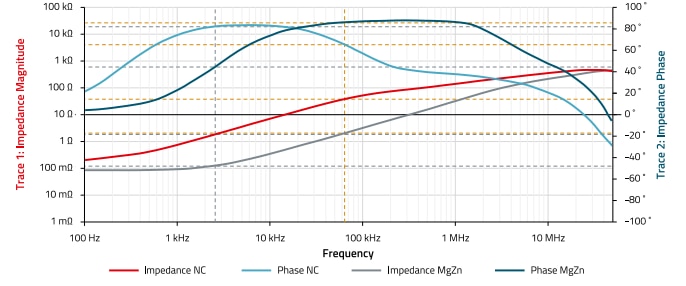
Figure 14: Impedance and phase of the sleeves WE-AENA, 782063151200, Nanocrystalline and WE-TEFA, 782114155200, Magnesium-Zinc, each with 2 turns
If, in the application of the sleeve, a high direct current is to be conducted through the sleeve, the static magnetic field in the sleeve must be compensated by the return conductor conducted to the load. Figure 15 shows the principle of current compensation.
4.4 Application of NC and MgZn ferrite sleeves with current compensation
If a suppression sleeve is used to attenuate interference, the bias magnetization must be low (typ. < 2 A), as shown in section 03. The magnetic field generated by the direct current flow through the conductor around which the suppression sleeve is located must be compensated or cancelled. The simplest way to do this is to route the return conductor (earth wire) through the sleeve as well. The following shows the insertion loss of the NC and MgZn ferrite sleeves in operation with current cancellation. Figure 15 shows the set-up. It shows that the current cancellation can almost completely compensate for the influence of the magnetic field saturation. Even if the forward and return conductors in the ferrite sleeve do not run parallel to each other but are separated by the signal conductor, the cancellation deteriorates only slightly(< 1 dB). Figure 16 shows the results. The application with current compensation has many advantages however:
- Due to the system, current cancellation is not possible everywhere, since a metal chassis often forms the return conductor and thus the "return current" cannot be conducted through the ferrite sleeve
- The insertion loss of a ferrite sleeve depends strongly on the "radiation impedance" of the cable. In HF terms, a cable is a monopole. Its footpoint impedance, i.e. the impedance at the radiation source, is strongly dependent on the wavelength of the interfering signal or the electrical length of the cable. The impedance varies from a few Ohms to several kΩ.
- In a set-up with current cancellation, no unbalanced interference components in the signal can be attenuated.
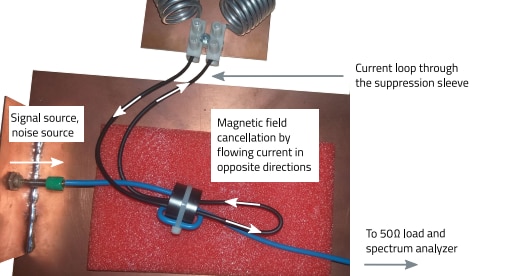
Figure 15: Measurement of the insertion loss of the sleeves with current cancellation, often referred to as current compensation
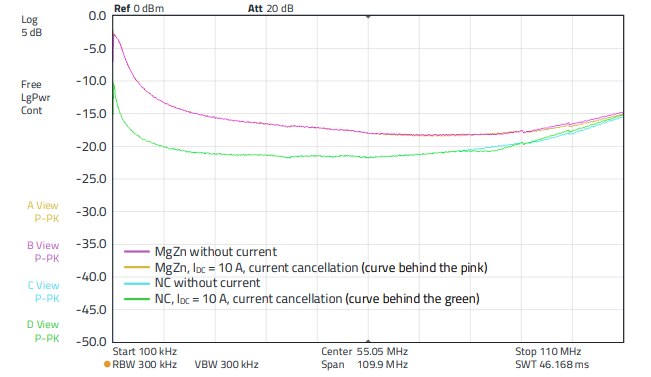
Figure 16: Insertion loss of suppression sleeves ordercode 782063151200, Nanocrystalline and WE-TEFA, ordercode 782114155200, Magnesium-Zinc, 2 turns each without current and with current cancellation, DC current: 10 A
However, inverters, switching regulators and similar power-switching electronics generate common-mode and push-pull interference due to the switching principle which have a considerable share in the interference, potential. The following laboratory set-up in sub-section 05 clearly shows the problem.
4.5 Application of the NC and MgZn suppression sleeves using a GaN-DC-DC converter as a signal source with asymmetrical interference potential feeding into a "twisted pair wire"
A GaN push-pull signal generator was used here as the signal source. Its duty cycle was set to 50%, and its clock frequency changed in steps of 0.5; 1; 2 and 4 MHz. The signal amplitude was 10 Vpp was applied to one pair of wires (length: 60 cm) feeding a 100 Ω load. Measurements were taken with a current clamp and a spectrum analyzer, as shown in Figure 17. The Measurements were carried out as follows:
- In each case before and after the ferrite, differential and common mode of one core: One wire through the current clamp.
- In each case before and after the ferrite, differential and common mode of one core: Two wires through the current clamp.
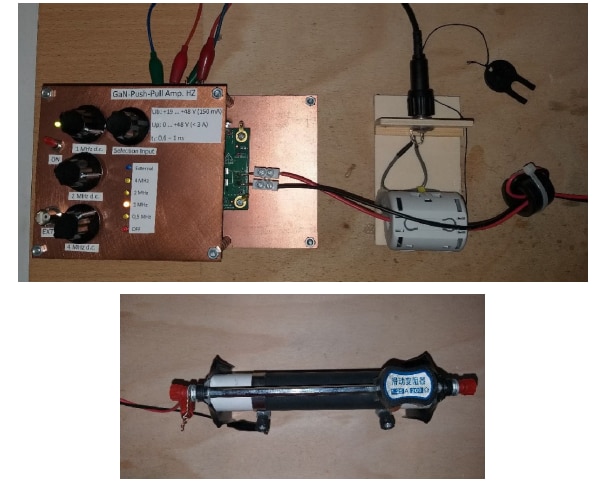
Figure 17: Set-up for measuring differential and common-mode insertion loss with a close-to-practice signal source (GaN push-pull output stage). Lower figure: Load resistor
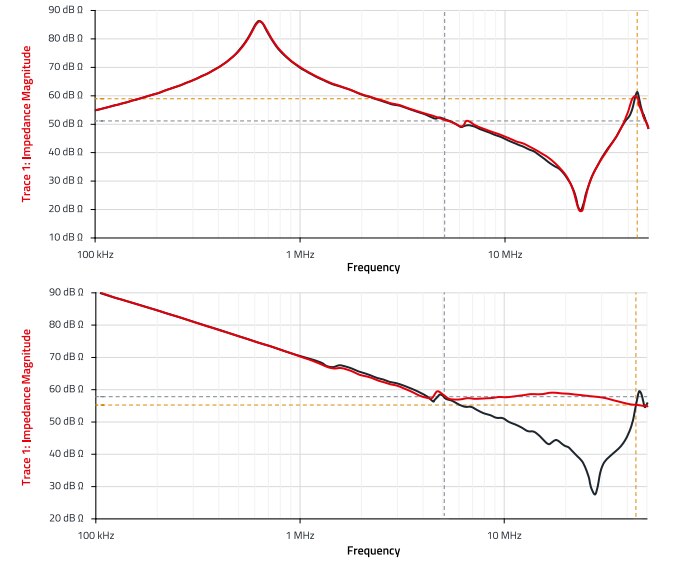
The results in Figure 18 show that in an RF-technically not terminated system neither in the CM nor in the DM defined insertion losses can be expected. The effect depends on the series connection of the generated impedance of the ferrite sleeve and the radiation resistance of the cable. To illustrate this problem, which has a direct influence on the interference suppression concept, the impedance of a twowire line (twisted pair) was measured; Figure 19 shows the configurations, Figure 20 shows the results. Note that the terms common mode (CM) and differential mode (DM) refer to the high-frequency signal, i. e. in practice to the interference signal generated by the source. The measurements in Figure 20 show the phase and the impedance. It can be seen that at the resonance points (Figure 20 top: 620 kHz, 23 MHz, 45 MHz, Figure 20 bottom: 25 MHz) the phase changes from a positive to a negative value or vice versa. If the phase changes from a positive to a negative value, the line behaves inductively before the resonance point and capacitively afterwards.

Figure 18: Left: CM. Right: DM
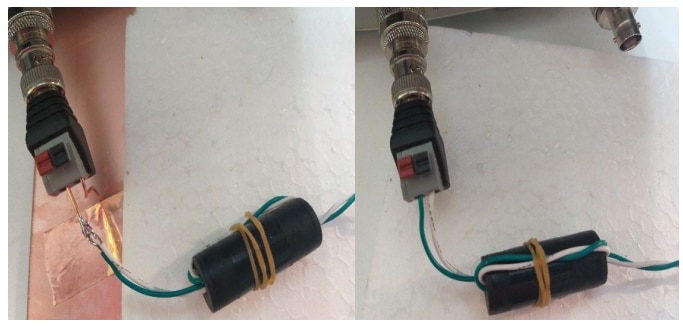
Figure 19: Configurations for the measurements. Left CM, i.e. wire ‘a’ and wire ‘b’ together against a ground plane on which the 2 m long twisted pair wire is positioned. Right DM, wire ‘a’ against wire ‘b’, without ground reference
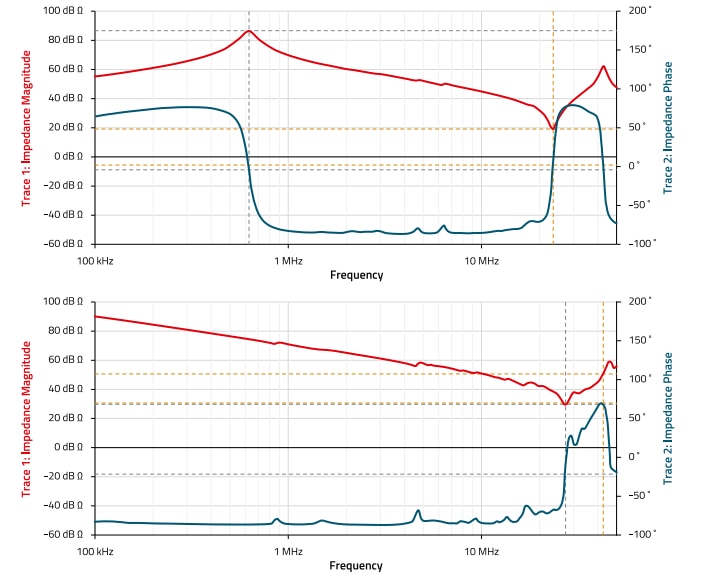
Figure 20: Impedance and phase, top: Twisted pair freely suspended, impedance between cores ‘a’ and ‘b’. Bottom: Twisted pair together, impedance between wires ‘a/b’ against ground plane (wire-surface distance: 4 cm)
If the polarity changes from a negative to a positive value, it is the other way round, capacitive before the resonance point, inductive afterwards. The greater the absolute difference of the phase jump, the higher the quality of the resonance point. This explains why the phase jump is not so pronounced in the cable with suppression sleeve, because the sleeve reduces the quality of the cable through its "damping", i.e. the resistive part µr " of the permeability. In both cases, the relatively high impedance of the wires is evident. The high impedance reduces the effect of a suppression sleeve inserted serially into the wire, as the ratio of wire impedance and sleeve impedance is too low. The measurement in Figure 21 shows the comparison without/with the NC sleeve. The setups correspond to those in Figure 20, i.e. above, differential mode (wire ‘a’ against ‘b’) below common mode (both wires together against ground). In the range of the low cable impedance and the relatively high impedance of the NC sleeves (compare Figure 14), an attenuation of up to 30 dB can be seen. The measurements in Figure 21 clearly show that attenuation of DM interference with "current compensated design", i.e. both wires through the ferrite, does not cause any attenuation over the entire frequency range between 100 kHz and 50 MHz. However, the measurements also show that in the case of common-mode application, i.e. both wires together against a ground plane, useful insertion loss can only be expected where the ratio between cable impedance and sleeve impedance is large enough. In Figure 20 below, this is the range between 5 MHz and 45 MHz. Figure 14 shows that in this frequency range the impedance of the NC material is higher, or increasing.
Figure 21: Top: Impedance wire ‘a’ against wire ‘b’, red curve: without ferrite, black curve with NC ferrite sleeve (2 × 782063151200) with 1 ½ turns. Bottom: Red curve: twisted pair together, impedance between cores ‘a/b’ against ground plane (core-surface distance: 4 cm). Black curve: Insertion of a NC ferrite sleeve (2 × 782063151200) with 1 ½ turns
Subsequently, the measurement range was extended to 100 MHz, and the reflection factor S11 was measured for a clearer analysis. Figure 22 shows the results. The results from Figure 21 are confirmed. To explain the S11 measurement: A higher value means a higher reflection at the "input" to the cable, i.e. less energy is radiated from the cable. On the differential mode application, the suppression sleeve has almost no useful influence, the common mode application on the other hand shows that the reflection factor increases by at least 5 dB, i.e. less "interference energy" is fed into the cable. The above measurements were carried out in the 50 Ω system, the cable was open at the end from an RF point of view.

Figure 22: S11 measurement. Left differential mode, wire ‘a’ against wire ‘b’, freely suspended. Right common mode, wires ‘a’ and ‘b’ together against ground plane
05. MEASUREMENT SETUP ACCORDING TO CISPR 25 AND INFLUENCING VARIABLES
In the following, the system will be considered as it is electrotechnical intended according to CISPR 25. Figure 23 shows the principle. The cable length is 1.5 m, laid vertically at a distance of 5 cm above a conductive, earthed ground plate.
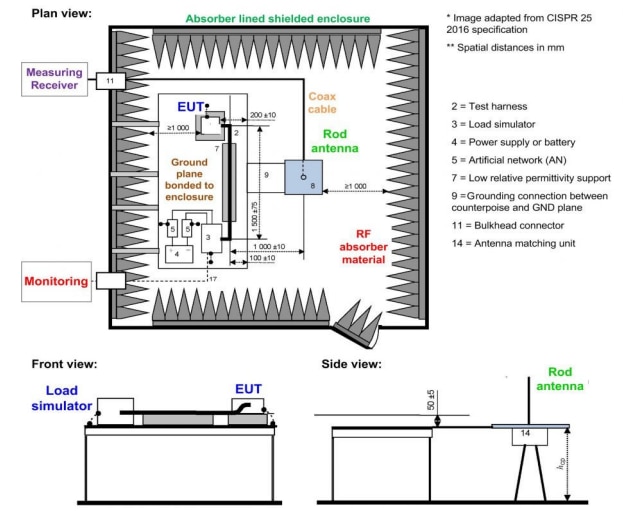
Figure 23: Structure of the radiated emission measurement according to CISPR 25
Only common mode was measured, i.e. both wires connected together at the RF signal source, measurement of the signal against the ground plate (GND reference). In contrast to the setup according to CISPR 25, the radiated emission (radio interference field strength) was not measured, but the reflection factor S11, which clearly shows which frequency ranges are preferentially radiated by the cable arrangement and the effect of measures taken by suppression sleeves. Polarization and alignment of antennas, environmental influences of the shielding cabin and similar effects therefore have no influence on the measurement result. Furthermore, a reflection measurement can be carried out directly in the vehicle as a single measurement, whereby all relevant coupling mechanisms of the system installation are included and the measurement is thus representative of the final system. Of course, the electronics must be voltagefree, otherwise the network analyzer will be damaged and furthermore the measurement result will be inaccurate in the case of low power. In practice, both the impedance of the load and that of the source in the interference frequency range are not defined, so that their influence is to be considered in more detail here. Furthermore, the frequency range to be measured was extended downwards to 150 kHz and limited upwards to 200 MHz. The reason is that in the case of the S11 measurement it can be seen how measures below 30 MHz influence the attenuation of the source signal, since no "radiated" emission is measured. The limitation to 200 MHz was chosen because above 200 MHz in most cases the radiation of electronic components is direct and in differential mode, and secondly, because of the relatively short wavelengths and consequently the high frequencies, the coupling influences of the assembly make reproducibility so difficult that meaningful results can hardly be expected.
5.1 Cable termination and its influence
The open line, the line terminated with ferrites and in each case S11 with the emission recorded via the H - field probe were measured in the near field (approx. 15 cm distance). The measurement set-up was according to Figure 24, the results without termination are shown in Figure 25, the results with termination in Figure 26. As can be seen in Figure 25, S11 is the quasi "mirrored" curve of the emission profile at the abscissa axis (frequency).

Figure 24: Measurement setup for evaluating the influence of termination impedances on the reflection factor and the comparison S11 with H - field (near field)

Figure 25: Measurement results of the influence of termination impedances on the reflection loss, open cable end, measured via S11 and with an H - field probe

Figure 26: Measurement results of the influence of termination impedances on the reflection attenuation, cable end damped, terminated with ferrite and measured via S11 and with an H - field probe
Of course, the curves do not match exactly because the transmission factors are different, a conducted reflection measurement differs considerably in its measurement procedure from a measurement with H - field probe in the near field of the signal source (wire, line). The following measurements show the profiles with terminated line, i.e. at the end, after 1.5 m, the line was damped, “terminated” with ferrite. The bandwidth of the resonances in the S11 measurement according to Figure 26 are clearly more pronounced, the quality of the resonances has increased. The upper resonance has shifted by 5 MHz to 130 MHz, which can be explained by a change in the electrical length of the line. Overall, the termination leads to a reduction in the emission of the H - field, as the termination absorbs part of the energy. The essential question that arises is how the measure "applying a ferrite sleeve to a cable" depends on the load impedance. Load impedance is the impedance that "sees" the high-frequency interference signal and not the useful signal. To show this impedance dependence, an "HF-suitable"potentiometer (variable ohmic resistance) was attached to the end of the cable. The impedance was varied until the curve of the received interference level over the frequency, measured with the H - field probe, was as straight as possible, i.e. "matching" prevailed. For comparison, the emission spectrum with an open line and with a short circuit to ground was also included. Figure 27 shows the measurement results. The line terminated with 250 Ω at the end results in a flat curve of the emission, the difference between "open" and"to ground" is high. If we look at the cursors 1 → 2 and 1 → 3, we get differences of 13 dB and 16 dB, i.e. almost 30 dB between open and short-circuited to ground.

Figure 27: Emission spectrum recorded with an H - field probe
5.2 At which terminating impedance does the ferrite sleeve work best?
Based on the findings from section 5.1, the emission spectrum was measured at different termination impedances and "with and without suppression sleeve". Two WE- AENA Axial EMI Suppression Nanocrystalline, ordercode 782063151200, were used as suppression sleeves. The setup is shown in Figure 28 for clarification, the measurement results are shown in Figure 29.

Figure 28: Setup for measuring the emission spectrum with/without NC suppression sleeve, taking into account the RF termination impedance
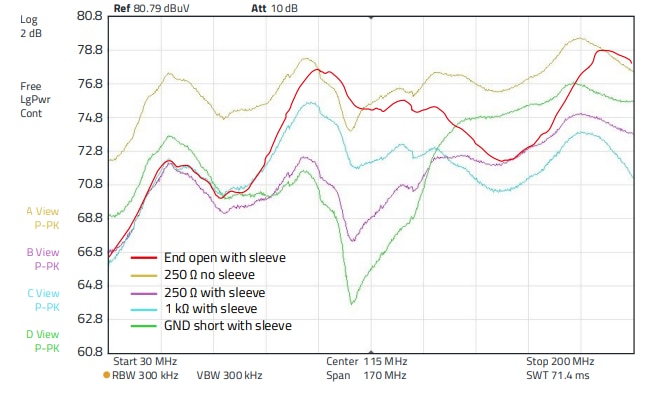
Figure 29: Results for measuring the emission spectrum with/without NCsuppression sleeve taking into account the RF termination impedance. Since the spectrum analyzer can only display a maximum of 4 curves at the same time, one curve (red: end open with sleeve) was added graphically
The influence of the terminating impedance is clearly visible even with the suppression sleeve applied, the scaling of the emission axis in Figure 29 is 2 dBµV / div.
- 30 to 64 MHz: suppression sleeve brings significant improvement between 4 and almost 6 dB compared to emission without the sleeve. The impedance-dependent difference is 2 dB. 95 to 112 MHz: With the line open at the end, the difference with/without sleeve is marginal. With decreasing termination impedance, the emission also decreases. With a short circuit at the end of the line, the difference to the open end is 7 dB, at 112 MHz it is up to 12 dB.
- 166 to 183 MHz: Here, an increased emission is seen with an open - and a somewhat lower one with a shortcircuited line. Impedance terminations cause a lower emission, with the 1 kΩ termination causing the lowest emission.
Summary of the results: RF short-circuited and open lines are difficult to control over frequency because of the standing waves on the line.
Depending on the frequency range, a suppression sleeve can even increase the emission. Therefore, HF-technically open and short-circuited should be avoided. HF-technically open and short-circuited lines can also be: Open: T-lowpass filter Short: π-lowpass filter Overall, a termination in the range of the line impedance, here roughly between 100 Ω and 1 kΩ, gives the best attenuation result, or the lowest emission spectrum over the frequency in the range between 30 and 200 MHz.
5.3 Effect of the set-up according to 5.2 with push-pull/GaN signal source, with/without NC suppression sleeve
The GaN push-pull amplifier was again used as the source, the clock frequency was 1 MHz (DC 50%), amplitude 10 Vpp. Figure 30, Figure 31 and Figure 32 show the results. Two WE-AENA Axial EMI Suppression Nanocrystalline, ordercode 782063151200 sleeves were again used. The two sleeves applied one behind the other cause an insertion loss of approx. 5 - 8 dB. When the cable is short-circuited to earth, two frequency ranges show significant level increases or a reduced effect of the suppression sleeves. In the range between 30 to 60 MHz the level increase is approx. 2 - 4 dB, in the frequency range between 150 to 230 MHz the increase is up to 5 dB. As already mentioned, the short circuit is to be understood "RF-technically", i.e. as a capacitor, part of a π -filter.
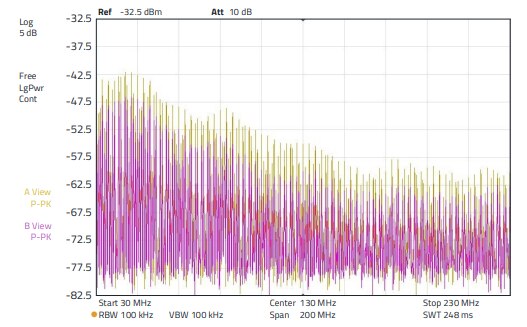
Figure 30: Beige spectrum: Without sleeve, RL = 250 Ω. Purple spectrum: With sleeve, RL = 250 Ω
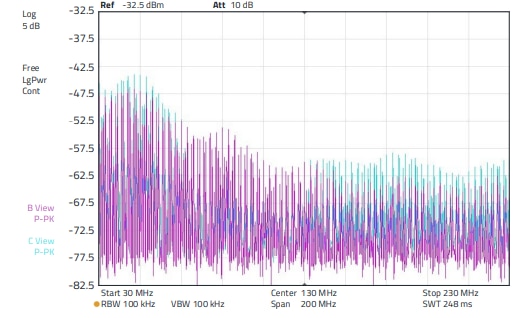
Figure 31: Purple spectrum: With sleeve, RL = 250 Ω. Blue spectrum: With sleeve, RL = 0 Ω, i.e. HF short circuit to ground
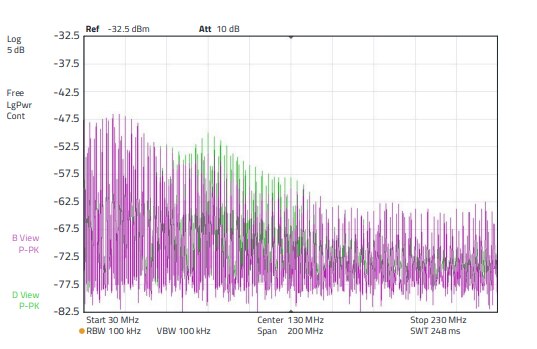
Figure 32: Purple spectrum: With sleeve, RL = 250 Ω . Green spectrum: With sleeve, RL = open
Here, too, there is an increase in the interference level, but in the range between 70 to 150 MHz, the range that had the lowest level in Figure 30. The level increase is up to 5 dB. The measurements clearly show that, depending on the termination impedance of the cable, the application of a suppression sleeve does not always lead to the desired success. The cable termination impedance must also be taken into account - however, this is often not the case in practice and so success depends on chance. Another series of measurements shows the emission spectrum as a function of the termination impedance and the location dependence. Here the H - field probe was positioned at different locations along the cable. The following Figure 33, Figure 34 and Figure 35 show the problem. In the lower frequency range between 30 to 150 MHz, the emission at the location at 70 cm is up to 5 dB higher, in the frequency range above that it is up to 13 dB at the location at 120 cm. If the cable is short-circuited to ground at the end by RF technology, the result is as shown in Figure 34. Here, too, there are serious differences in emission depending on the position of the probe along the line. At 70 cm it is up to 10 dB and at 15 cm, in the frequency range between 120 to180 MHz, even up to 20 dB. Figure 35 shows how the impedance spectrum behaves in the case of a 250 Ω termination. It can be clearly seen that the amplitude curve of the emission spectrum remains the same. With increasing distance, only the amplitude of all discrete frequencies (harmonics of the spectrum) is reduced. Remaining non-linearities result from the mismatch of the generator or the interference source to the line; in addition, no reactance matching was carried out at the sink.

Figure 33: Emission spectrum with two WE-AENA Axial EMI Suppression Nanocrystalline, ordercode 782063151200 sleeves, line open at the end, measured with H - field probe. Left: Beige, emission at 70 cm. Purple, emission at 120 cm. In the illustration on the right, only the positions of the two curves are interchanged (beige in front) so that the difference in each case can be seen

Figure 34: Emission spectrum with two WE-AENA Axial EMI Suppression Nanocrystalline, ordercode 782063151200 sleeves, line at the end HF-technically short to ground, measured with H - field probe. Left: Blue, emission at 70 cm. Green, emission at 15 cm. In the illustration on the right, only the positions of the two curves are interchanged (green in front) so that the difference is visible
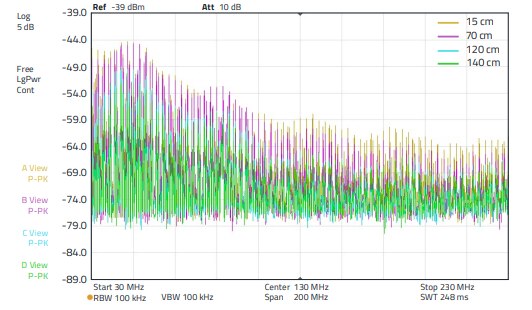
Figure 35: Emission spectrum with two WE-AENA Axial EMI Suppression Nanocrystalline, ordercode 782063151200 sleeves, cable terminated with 250 Ω at the end, measured with H - field probe
The following section 06 will briefly explain why the insertion loss of the suppression sleeve depends on the terminating impedance of the cable and what the frequency- and location-dependent amplitude curve along the line is all about - a little antenna theory.
06. THE CABLE AS AN ANTENNA
A cable or a piece of wire over a ground plane, can be seen as a transmission line, that supplies a load at its end with the energy from its signal source. But a cable or a piece of wire can also radiate electromagnetic waves, just as an antenna can, a dipole. The reader may wonder why I am going into the basics of field theory and transmission theory here. Well, this is necessary to understand why a cable sometimes emits RF energy and sometimes does not and why a ferrite sleeve sometimes attenuate the emission and sometimes does not. Only by understanding the cause of the phenomena can efficient solutions be found that always work and not "sometimes they don't". The cable is only "half" a dipole, a monopole. The monopole needs a reference ground plane for its function, which is the "mirror image" of the other half of the dipole, i.e. the radiation behavior of the monopole antenna must be considered together with its ground plane (Figure 36).

Figure 36: The monopole antenna, derived from the dipole antenna
The monopole has an antenna length of λe / 4 when tuned, where λe is the effective wavelength of the monopole. Parameters that take on the effective wavelength are:
- Loss resistances (material properties)
- Shortening factor (physical to electrical length)
- Wire length in relation to wire thickness (degree of slenderness)
- Dielectric permittivity εr of the insulation material (capacitance, insulation losses if applicable)
- Area, shape, conductivity of the reference ground plane
An essential property of the monopole is the so-called current and voltage distribution over its length in relation to the signal with which the antenna is fed, i.e. in practice the "interference signal". This property results in the important parameters of antenna gain ("radiation performance") and radiation resistance (impedance) for the monopole. The following is an overview (see Table 2). Where there is a current minimum, there is a voltage maximum and vice versa.
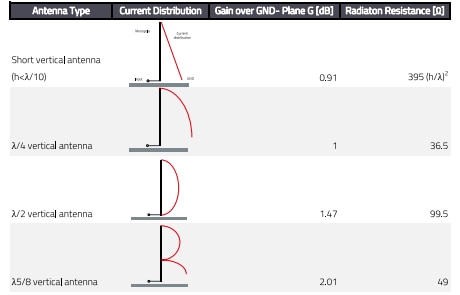
Table 2: Characteristics of the various monopoles
In practice, the length of the cable is not tuned to a "transmission frequency", but an interference signal unknown in its power and frequency is coupled into a cable unknown in its radiation performance. This results in a radiation pattern of unknown properties. A high radiation of the interfering energy occurs when the wavelength of the interfering energy has nλ / 4, i.e. multiples of a quarter of the electrical length of the wire. The radiation resistance of a monopole antenna is a measure of the radiation of electromagnetic energy into space. It is a fictitious resistance and is measured for the λ / 4 - monopole at the footpoint together with the always present loss resistances as a component of the footpoint resistance. The radiation resistance RS is calculated for the monopole with
RS = 1600(hw/λ) 2 →[Ω] (5)
where hw: Effective length of the antenna / wire λ : Wavelength of the supplied signal.
The effective antenna length hw is usually smaller than the physical length of the antenna. It is determined by a comparison of the area of the current covering over the length of the antenna into a rectangle of equal area (integral), see Figure 37.
Thus, the radiation resistance changes not only as a function of the wire length, but also as a function of the wavelength of the applied signal. Examples:
λ / 4 antenna: hw = 0.64 h(phys.), RS = 36 Ω at 50 MHz approx. length = 1,5 m
λ / 8 antenna: hw = 0.32 h(phys.), RS = 9 Ω at 50 MHz approx. length = 0,75 m
λ / 20 antenna: hw = 0.5 h(phys.), RS = 1 Ω at 50 MHz approx. length = 0,3 m.
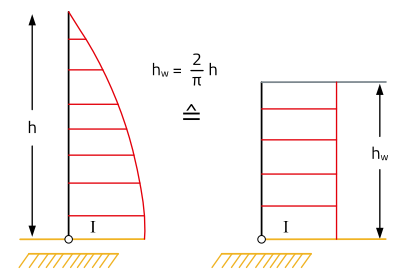
Figure 37: Physical and effective antenna height of the monopole
Furthermore, the "footpoint resistance" of an antenna is generally not purely resistive, i.e. real. Most of the time it has inductive or capacitive reactive components, so it is correct to speak of footpoint impedance. This results in the following impedance curves according to Figure 38.

Figure 38: Left: Footpoint resistance RE (real component) and Right: footpoint reactance XE (reactive component) of a thin monopole over the normalized physical length I / λ0. If the monopole, or in our case the wire, is fed with a broadband signal, the “interference signal”, it becomes clear that the radiated amplitude spectrum cannot be radiated evenly over the frequency
In practice, such a piece of wire can be both, "a little" antenna (monopole) and "a little" transmission line - depending on the impedance conditions, one or the other will predominate. If a two-wire line is pulled apart in such a way that two wires of equal length are created at the feed point to the left and right, this does not change the line properties significantly from an electrical point of view. The resulting structure, the dipole, has almost the same properties as the original line, with the exception of the radiation resistance. If one takes half of it, i.e. a wire over a conducting plane, the same picture emerges, a transmission line, or a monopole (Figure 39).
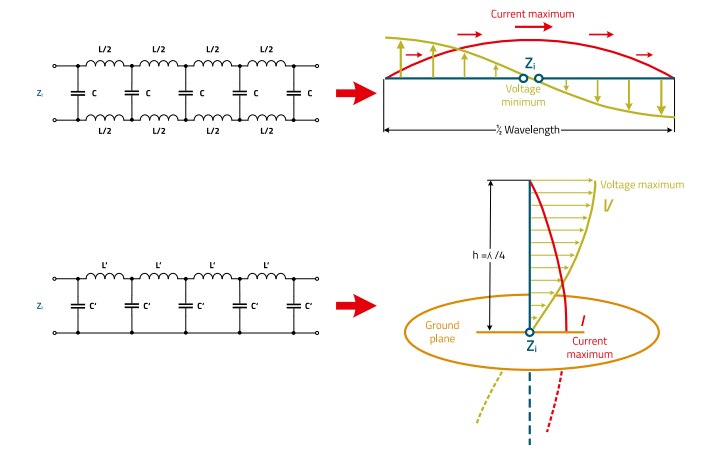
Figure 39: Analogy of the lossless symmetrical line to the dipole and from the lossless asymmetrical line to the monopole
For the case of the antenna, part of the high-frequency electrical energy supplied to the wire is radiated into the surrounding space, for the case of the line, part of the energy reaches the connected consumer. But to which parts this happens depends on the electrical parameters of the transmission system - mainly on the terminating impedance, as shown in the previous measurements. All in all, the following picture emerges: With an RF-technically open line end, the structure radiates as a monopole when the wavelength and wire length are matched. The rest of the signal energy is reflected and can couple in the near-field range.
Figure 40 illustrates this situation. For termination impedances that are in the rough range of the transmission line impedance and for short circuits, the structure acts predominantly as a transmission line over a ground plane. Depending on the matching, part of the energy will reach the load (terminating impedance), part will be reflected in the transmission line and part will be radiated over the transmission line.
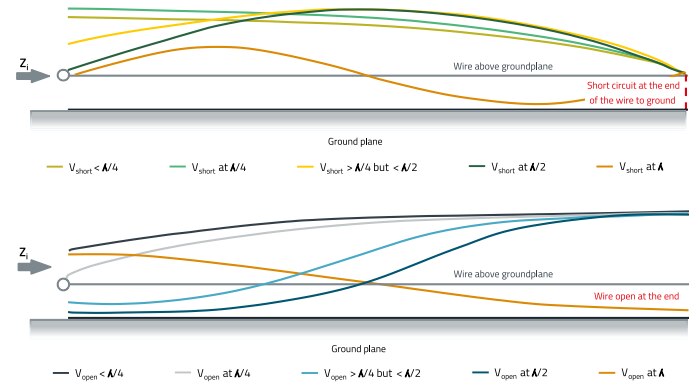
Figure 40: Tuning behavior of an open and a short-circuited transmission line of length up to above one GND layer (ground plane)
The proportions depend on the wavelength of the signal and on the mentioned electrical parameters of the transmission system and for the case of "EMC consideration" the system fed with a broadband signal, e.g. with a "residual interference is signal" of a buck converter, i.e. the harmonics of the switching signal, which can range from a few kHz to the range of several hundred MHz.
07. SUMMARY, HOW TO DO IT RIGHT?
How should the user arrange and connect the suppression sleeve, the cable, the source and termination impedances in order to obtain the best result in reducing his interference emission and which material should he choose? To answer these questions, a "recipe-like" Table 3 with brief explanations will serve in the following.
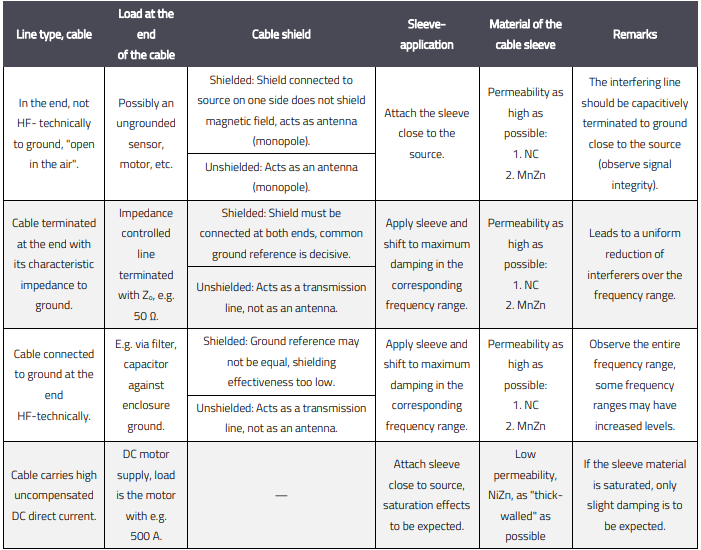
Table 3: Concept for interference reduction of high-frequency interferers via cables
The concept in Table 3 is primarily based on the source and load impedances. As a rule, the impedances of the interference sources are low (typ. < 10 Ω); the load impedances, on the other hand, can vary over a wide range. According to these conditions, the interference suppression measure must be adapted because, as shown in the previous chapters, the cable changes its radiation behavior depending on the load impedance. The application-related impedance of the cable is almost irrelevant, because the cable impedance at the interference frequency must be taken into account and not, for example, the characteristic impedance of the cable at its signal frequency (e.g. USB with 90 Ω). In consideration of these facts, the suppression sleeve can be used effectively to reduce the unwanted radiation. A high permeability of the ferrite material in the interfering frequency range is always desirable. However, should high direct currents flow through the cable, a high permeability quickly leads to saturation of the ferrite sleeve. Accordingly, in this case, tests must be carried out in practice on the effectiveness, because often 3 - 4 dB insertion loss at a certain frequency is sufficient to achieve the goal. In standard applications, without DC bias, in order to achieve high insertion loss, the impedance of the load at the end of the cable must be known. As mentioned above, it is the impedance at the interference frequency range to be attenuated, not the characteristic impedance of the cable.
Definitions:
Cable: The medium carrying the RF interference to be reduced (signal wire, DC line, shielded cable,…).
Source: Origin of the useful and the interfering signal at the beginning of the cable.
The aim of this interference suppression measure is to keep the current of the interference signal through the cable as low as possible and to get the voltage divider ratio between the impedance of the cable section with the ferrite sleeve and the connecting cable as high as possible. Figure 41 illustrates this situation.
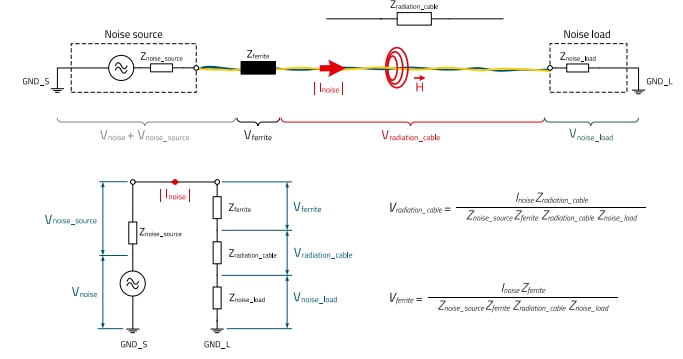
Figure 41: Impedance ratios of the entire system consisting of interference source, ferrite sleeve, cable and interference sink
Essential questions for effective interference suppression are therefore:
a) How do the impedances divide up? From the picture in Figure 41 on the left and the formulas next to it, one can clearly see that
- if Zradiation_cable, i.e. the radiation impedance of the cable is high, the impedance of the ferrite sleeve must also be very high to achieve effective attenuation.
- if Znoise_load is small, e.g. because of the input capacitance of a π-filter, the cable or the line is short-circuited at the end. The interference voltage is now divided between the impedances of the source, ferrite sleeve and cable. Again,the impedance ratios are crucial, bearing in mind that the impedance, i.e. the radiation resistance of the cable, depends on the wavelength of the interference frequency. It may therefore make sense to replace the filter at the input of the load with a simple LC low-pass filter in order to keep the input impedance high
b) How can the interference current be kept as low as possible?
The actual problem, the cause of the interference emission, is the interference current Inoise (see Figure 15). The lower the interference current, the lower the interference emission will be. Thus, the interference current must be reduced as much as possible. This is again related to the "operating mode" of the cable at the interference frequency. If the cable works as a λ / 4 antenna, the impedance at the beginning of the cable will be very low and a ferrite sleeve near the source will increase the impedance of the cable and thus significantly reduce the emission. On the other hand, a capacitor at the end of the cable will significantly increase the interference current and thus the interference radiation (Figure 39), since the impedance is high here. The effect can be expected in the range of multiples of λ / 4. The cable behaves in the opposite way via a ground plane when it operates as a "transmission line" (Figure 40). A ferrite sleeve placed close to the source has its best effect when the wavelength of the interfering signal is in multiples of λ / 2 and the cable is terminated at the end, e.g. with a capacitor, against GND (ground). However, if the cable is "RF open" at the end, the ferrite sleeve should be placed in the middle of the cable length to increase the impedance. A capacitor at the end of the cable increases the interference current (Figure 40 lower picture). c) Is GND_S equal to GND_L? In Figure 41, the interference source has "GND_S" as ground reference, the interference sink "GND_L". Under ideal conditions, GND_S = GND_L, i.e. the interference source and sink have the same ground reference, e.g. a low-impedance contact to a metal chassis. If this is not the case, e.g. if the GND is a cable (ground return conductor), it will contribute to the interference emission - usually in the same ratio as the signal line itself. In this case, the following aspects need to be considered:
- In general, the interference current is symmetrical (common mode), the interference current is the same at the signal conductor and at the "ground return conductor". The suppression sleeve should be placed over both conductors. This results in additional current compensation for the useful signal and the suppression sleeve is not premagnetized or even saturated by the useful signal.
- If the interference current is unbalanced (differential mode), i.e. as a current loop, a separate suppression sleeve must be fitted over both conductors
- Capacitors to the respective reference ground generally only bring about a noticeable improvement here if they can be connected to ground immediately after the suppression sleeve, which is often mechanically difficult to realize.
In practice, the operating mode of the cable is often difficult to identify because the interference levels are often distributed over a wide frequency range, so that the cable works both as an antenna and as a transmission line. If the emission levels of the interference radiation are high (typ. 5 - 10 dB above the limit value), it makes sense in this case to reduce the emission in the interference source itself, as experience has shown that this is the lesser effort.
A.1 References
[1] Adrian Suarez, Jorge Victoria, Antonio Alcarria, Jose Torres, Pedro A. Martinez, Julio Martos, Jesus Soret, Raimundo GarciaOlcina, Steffen Muetsch. Characterization of Different Cable Ferrite Materials to Reduce the Electromagnetic Noise in the 2 –150 kHz Frequency Range, Materials 2018, 11, 174; doi:10.3390/ma11020174
[2] Karl Rothammel, DM2ABK, Antennenbuch, 7. Ausgabe, Deutscher Militärverlag, Berlin 1969
[3] Melvin M. Weiner, Monopole Antennas, Library of Congress Cataloging-in Publication Data, ISBN: 0-8247-0496-7, New York 2003
[4] Thomas Brander, Alexander Gerfer, Bernhard Rall, Heinz Zenkner, Trilogy of Magnetics, 4th edition, Würth Elektronik, Swiridoff Verlag, ISBN-10: 3899291514, ISBN: 978-3-89929-157-5
IMPORTANT NOTICE
The Application Note is based on our knowledge and experience of typical requirements concerning these areas. It serves as general guidance and should not be construed as a commitment for the suitability for customer applications by Würth Elektronik eiSos GmbH & Co. KG. The information in the Application Note is subject to change without notice. This document and parts thereof must not be reproduced or copied without written permission, and contents thereof must not be imparted to a third party nor be used for any unauthorized purpose. Würth Elektronik eiSos GmbH & Co. KG and its subsidiaries and affiliates (WE) are not liable for application assistance of any kind. Customers may use WE’s assistance and product recommendations for their applications and design. The responsibility for the applicability and use of WE Products in a particular customer design is always solely within the authority of the customer. Due to this fact it is up to the customer to evaluate and investigate, where appropriate, and decide whether the device with the specific product characteristics described in the product specification is valid and suitable for the respective customer application or not. The technical specifications are stated in the current data sheet of the products. Therefore the customers shall use the data sheets and are cautioned to verify that data sheets are current. The current data sheets can be downloaded at www.we-online.com. Customers shall strictly observe any product-specific notes, cautions and warnings. WE reserves the right to make corrections, modifications, enhancements, improvements, and other changes to its products and services. WE DOES NOT WARRANT OR REPRESENT THAT ANY LICENSE, EITHER EXPRESS OR IMPLIED, IS GRANTED UNDER ANY PATENT RIGHT, COPYRIGHT, MASK WORK RIGHT, OR OTHER INTELLECTUAL PROPERTY RIGHT RELATING TO ANY COMBINATION, MACHINE, OR PROCESS IN WHICH WE PRODUCTS OR SERVICES ARE USED. INFORMATION PUBLISHED BY WE REGARDING THIRD-PARTY PRODUCTS OR SERVICES DOES NOT CONSTITUTE A LICENSE FROM WE TO USE SUCH PRODUCTS OR SERVICES OR A WARRANTY OR ENDORSEMENT THEREOF. WE products are not authorized for use in safety-critical applications, or where a failure of the product is reasonably expected to cause severe personal injury or death. Moreover, WE products are neither designed nor intended for use in areas such as military, aerospace, aviation, nuclear control, submarine, transportation (automotive control, train control, ship control), transportation signal, disaster prevention, medical, public information network etc. Customers shall inform WE about the intent of such usage before design-in stage. In certain customer applications requiring a very high level of safety and in which the malfunction or failure of an electronic component could endanger human life or health, customers must ensure that they have all necessary expertise in the safety and regulatory ramifications of their applications. Customers acknowledge and agree that they are solely responsible for all legal, regulatory and safety-related requirements concerning their products and any use of WE products in such safety-critical applications, notwithstanding any applications-related information or support that may be provided by WE.
CUSTOMERS SHALL INDEMNIFY WE AGAINST ANY DAMAGES ARISING OUT OF THE USE OF WE PRODUCTS IN SUCH SAFETY-CRITICAL APPLICATIONS.
DIRECT LINK
ANP115 | Cable Ferrites and Nanocrystalline Sleeves for Automotive Applications
USEFUL LINKS:
Application Notes : https://we-online.com/en/support/knowledge/application-notes
Services: https://we-online.com/en/products/components/service
Contact : https://we-online.com/en/support/contact
CONTACT INFORMATION
Würth Elektronik eiSos GmbH & Co. KG
Max-Eyth-Str. 1, 74638 Waldenburg, Germany
Tel.: +49 (0) 7942 / 945 – 0
Email: appnotes@we-online.de

.png-1440x400x2.png?sv=2016-05-31&sr=b&sig=UJlHFSW1sCvuHxjXfe5CBgDNXU1frXnioUb1%2Fk29JOk%3D&se=2024-12-05T23%3A59%3A59Z&sp=r&_=L5pYvXu9yoR7UaNALnHlRQ==)
