This project shows how to build an acceleration measurement system using a Raspberry Pi single-board computer together with an integrated electronics piezoelectric (IEPE) accelerometer sensor connected to a MCC 172 DAQ HAT (Hardware Attached at Top) board. IEPE sensors can measure acceleration, pressure, or force. They contain built-in independence conversion electronic, which converts the signal from the piezo sensor to a low-impedance voltage signal.
The project uses the model 805 accelerometer 500G IEPE T05-3 (data sheet) from TE connectivity to sense accelerations, vibrations, or mechanical shocks. Its output connects to the channel 0 of a MCC 172 IEPE measurement DAQ HAT from Measurement Computing Corporation (MCC), which is mounted on top of a Raspberry Pi.
The MCC 172 has two input channels for sound and vibration measurements with IEPE sensors. It features one 24-bit A/D per channel with a maximum sampling rate of 51.2 kSPS per channel. The 805-0500 device is a 3-pin IEPE low-cost accelerometer well suited for embedded applications using TO-5 header. It has a dynamic range of ±500g and a bandwidth of up to 12kHz.
The Raspberry Pi should have a working copy Raspbian OS installed. The project also requires the GIT version control system, the Python standard library, and the MCC DAQ HAT library from MCC.
Setting Up Software and Hardware
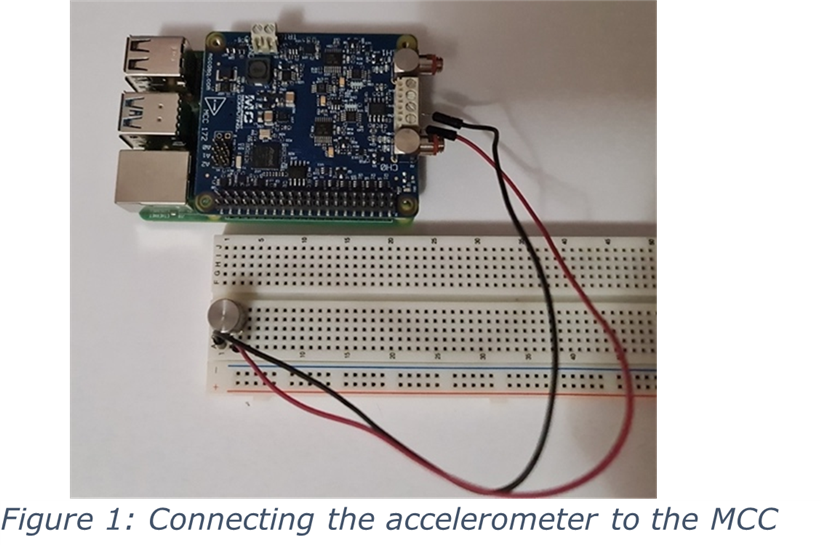
First, we set up the library for the HAT, following the instructions outline in the readme.md file in the library’s GIT repository. For other tasks, or more information, visit the MCC DAQ HAT Library documentation. Next, we need to download the files main.py and daqhats_utils.py from Digilent’s website and place them in the project’s folder. For this project, we mount the accelerometer on a breadboard and connect the outputs of the device to the channel 0 screw terminals on the MCC 172.
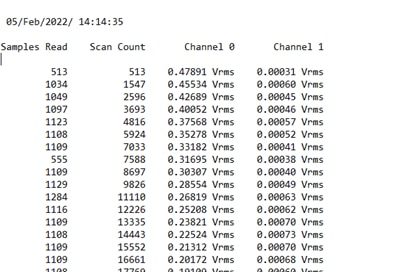
Inside the main.py script, we read the conversion result from the board, check for any overruns, and increment the number of samples read. Finally, we display the last samples on the screen, and calculate and show the RMS (Root Mean Square) voltages. The function will also write all results into a log file. Once done, the loop starts over.

Running the Project
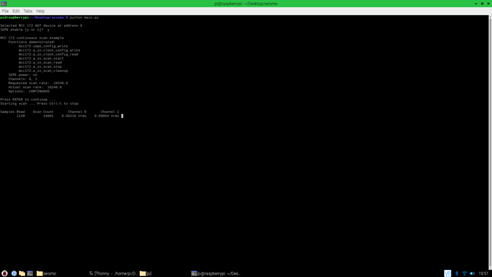
Having everything in place, we launch the script. It displays some board information, creates the log file, and finally displays the raw values and the RMS voltages.


You can get all the project details and the source code on Digilent’s blog.


