element14 Community
element14 Community
    Register Log In
  • Site
  • Search
  • Log In Register
  • About Us
  • Community Hub
    Community Hub
    • What's New on element14
    • Feedback and Support
    • Benefits of Membership
    • Personal Blogs
    • Members Area
    • Achievement Levels
  • Learn
    Learn
    • Ask an Expert
    • eBooks
    • element14 presents
    • Learning Center
    • Tech Spotlight
    • STEM Academy
    • Webinars, Training and Events
    • Learning Groups
  • Technologies
    Technologies
    • 3D Printing
    • FPGA
    • Industrial Automation
    • Internet of Things
    • Power & Energy
    • Sensors
    • Technology Groups
  • Challenges & Projects
    Challenges & Projects
    • Design Challenges
    • element14 presents Projects
    • Project14
    • Arduino Projects
    • Raspberry Pi Projects
    • Project Groups
  • Products
    Products
    • Arduino
    • Avnet Boards Community
    • Dev Tools
    • Manufacturers
    • Multicomp Pro
    • Product Groups
    • Raspberry Pi
    • RoadTests & Reviews
  • Store
    Store
    • Visit Your Store
    • Choose another store...
      • Europe
      •  Austria (German)
      •  Belgium (Dutch, French)
      •  Bulgaria (Bulgarian)
      •  Czech Republic (Czech)
      •  Denmark (Danish)
      •  Estonia (Estonian)
      •  Finland (Finnish)
      •  France (French)
      •  Germany (German)
      •  Hungary (Hungarian)
      •  Ireland
      •  Israel
      •  Italy (Italian)
      •  Latvia (Latvian)
      •  
      •  Lithuania (Lithuanian)
      •  Netherlands (Dutch)
      •  Norway (Norwegian)
      •  Poland (Polish)
      •  Portugal (Portuguese)
      •  Romania (Romanian)
      •  Russia (Russian)
      •  Slovakia (Slovak)
      •  Slovenia (Slovenian)
      •  Spain (Spanish)
      •  Sweden (Swedish)
      •  Switzerland(German, French)
      •  Turkey (Turkish)
      •  United Kingdom
      • Asia Pacific
      •  Australia
      •  China
      •  Hong Kong
      •  India
      •  Korea (Korean)
      •  Malaysia
      •  New Zealand
      •  Philippines
      •  Singapore
      •  Taiwan
      •  Thailand (Thai)
      • Americas
      •  Brazil (Portuguese)
      •  Canada
      •  Mexico (Spanish)
      •  United States
      Can't find the country/region you're looking for? Visit our export site or find a local distributor.
  • Translate
  • Profile
  • Settings
Raspberry Pi
  • Products
  • More
Raspberry Pi
Raspberry Pi Forum RPI Pico & ST7789 Display
  • Blog
  • Forum
  • Documents
  • Quiz
  • Events
  • Polls
  • Files
  • Members
  • Mentions
  • Sub-Groups
  • Tags
  • More
  • Cancel
  • New
Join Raspberry Pi to participate - click to join for free!
Featured Articles
Announcing Pi
Technical Specifications
Raspberry Pi FAQs
Win a Pi
Raspberry Pi Wishlist
Actions
  • Share
  • More
  • Cancel
Forum Thread Details
  • Replies 15 replies
  • Subscribers 661 subscribers
  • Views 16458 views
  • Users 0 members are here
  • st7789
  • rpi pico
Related

RPI Pico & ST7789 Display

scottiebabe
scottiebabe over 3 years ago

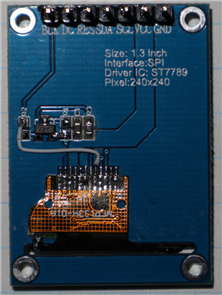
I purchased an off brand ST7789 1.3" Display a few months ago and recently decided it was time to try it out.


I did not realize it at the time but there isn't a consistent pinout between display boards. As it turns out the board I purchased did not pin out the chip-select (CS) line.


The ST7789 display driver will function without a CS line, however you need to configure the SPI mode (idle state, edge polarity) to communicate with the display. In most cases, I suppose that would be easy enough to change the display driver.


Now I wanted to make use of this display with a PI Pico and Micropython. Pimoroni provide a Micropython release with a small number additional libraries on top of MicroPython : https://github.com/pimoroni/pimoroni-pico (unlike CircuitPython which is significantly different from MicroPython).


I was trying to get their example code for one of their displays: https://shop.pimoroni.com/products/1-3-spi-colour-lcd-240x240-breakout to function with my off brand display. Unfortunately, I could not find a way to change the SPI operating mode of the display driver unless I wanted to compile their distribution from source (which I didn't want to do), the SPI initialization was all buried in C code.


An intsructables author provided a wonderful guide to breaking out the chip-select line: https://www.instructables.com/Adding-CS-Pin-to-13-LCD/  Many thanks. In the process of modify my display I learned a few things the hard way:

  • Rotated R1 90' to bypass the NPN switch
  • Tossed R2 away and used this as the CS pad
  • Be carful with getting the display too hot. The adhesive that held the display in place virtually no longer exists now image
  • Be carful cleaning! Or don't clean at all. I ended up relocating the flux residue with isopropyl from the PCB to inside the display housing and its now a little merky image

image


After the display modifications the display came to life!


You don't have permission to edit metadata of this video.
Edit media
x
image
Upload Preview
image


I have never used one of these displays before, but I have to say I am impressed. I was able to get 35 FPS out of a 240x240 display running over SPI.


I still don't know what the best way to add graphics to the PICO is. The image I showed in the video was created with ffmpeg outputting a raw video frame:


ffmpeg -vcodec png -i img.png -vcodec rawvideo -f rawvideo -pix_fmt rgb565 img.raw


Of this random image cropped down to 240x240:

image

Loading the image from flash was very slow.


Update: Image Loading Speed

The framebuffer for the ST7789 is stored big-endian so when I was loading the Image I had endian swap in python which was really slow. I can endian swap the raw image file format using dd:

dd conv=swab if=img.raw of=img2.raw

Now loading the image is now significantly faster:

t1 = time.ticks_us()
with open('img2.raw', 'rb') as f:
    for j in range(0,240,24):
        display_buffer[480*j:(480*(j+24))] = f.read(240*48)

display.update() # only update display once now, remove those tabs!
print((time.ticks_us() - t1)/1000)


Which now runs in 232 ms 85 ms and appears more as a transition animation versus terribly slow code.


Update: Overclocking in MicroPython

One can adjust the system clock frequency in MicroPython by issuing the following command:

machine.freq(190_000_000) # set system clock in Hz


When MicroPython alters the system clock frequency, it also reconfigures the peripheral clock source from clk_sys to the external crystal oscillator.

image


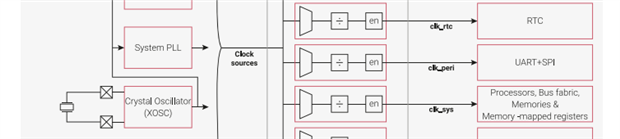
So, if you want to maintain a high-speed SPI clock frequency, you need to set the clock mux back to clk_sys yourself by:

mem32[0x40008000+0x48] = 0x800


With the Pico running at 190 MHz I achieved the following:

     Rainbow Spinner: 53 FPS

     FFT Demo: 16 FPS

     Image Load + Draw: 56 ms (49ms letting the garbage collector run before the load)


Of course, there are no guarantees this will always work for every Pico and or display.

  • Sign in to reply
  • Cancel
Parents
  • scottiebabe
    scottiebabe over 3 years ago

    Pimoroni Thermometer Demo


    Original source code: https://github.com/pimoroni/pimoroni-pico/blob/main/micropython/examples/pico_display/thermometer.py


    I modified this sample application to run on a 240x240 display. This really only involved creating a display object from the 240x240 driver class. I also removed the sleep statement for the demo to run as fast as possible.

    You don't have permission to edit metadata of this video.
    Edit media
    x
    image
    Upload Preview
    image

    Sorry I bumped the board slightly out of focus. This is another neat example of what kind of performance you might see using uPython for graphics on a Pico.


    The modified code I used:

    # This example takes the temperature from the Pico's onboard temperature sensor, and displays it on Pico Display Pack, along with a little pixelly graph.
    # It's based on the thermometer example in the "Getting Started with MicroPython on the Raspberry Pi Pico" book, which is a great read if you're a beginner!
    
    from machine import Pin
    import utime
    import gc
    from breakout_colourlcd240x240 import BreakoutColourLCD240x240
    
    rst = Pin(13,Pin.OUT)
    rst.value(1)
    
    width = BreakoutColourLCD240x240.WIDTH
    height = BreakoutColourLCD240x240.HEIGHT
    
    display_buffer = bytearray(width * height * 2)  # 2-bytes per pixel (RGB565)
    display = BreakoutColourLCD240x240(display_buffer)
    
    # reads from Pico's temp sensor and converts it into a more manageable number
    sensor_temp = machine.ADC(4)
    conversion_factor = 3.3 / (65535)
    temp_min = 25
    temp_max = 60
    bar_width = 5
    
    # Set the display backlight to 50%
    display.set_backlight(0.5)
    
    temperatures = []
    
    colors = [(0, 0, 255), (0, 255, 0), (255, 255, 0), (255, 0, 0)]
    
    def temperature_to_color(temp):
        temp = min(temp, temp_max)
        temp = max(temp, temp_min)
    
        f_index = float(temp - temp_min) / float(temp_max - temp_min)
        f_index *= len(colors) - 1
        index = int(f_index)
    
        if index == len(colors) - 1:
            return colors[index]
    
        blend_b = f_index - index
        blend_a = 1.0 - blend_b
    
        a = colors[index]
        b = colors[index + 1]
    
        return [int((a[i] * blend_a) + (b[i] * blend_b)) for i in range(3)]
    
    while True:
        # fills the screen with black
        display.set_pen(0, 0, 0)
        display.clear()
    
        # the following two lines do some maths to convert the number from the temp sensor into celsius
        reading = sensor_temp.read_u16() * conversion_factor
        temperature = 27 - (reading - 0.706) / 0.001721
    
        temperatures.append(temperature)
    
        # shifts the temperatures history to the left by one sample
        if len(temperatures) > width // bar_width:
            temperatures.pop(0)
    
        i = 0
        for t in temperatures:
            # chooses a pen colour based on the temperature
            display.set_pen(*temperature_to_color(t))
    
            # draws the reading as a tall, thin rectangle
            display.rectangle(i, height - ((round(t)-20) * 4), bar_width, height)
    
            # the next tall thin rectangle needs to be drawn
            # "bar_width" (default: 5) pixels to the right of the last one
            i += bar_width
    
        # draws a white background for the text
        display.set_pen(255, 255, 255)
        display.rectangle(1, 1, 100, 25)
    
        # writes the reading as text in the white rectangle
        display.set_pen(0, 0, 0)
        display.text("{:.2f}".format(temperature) + "c", 3, 3, 0, 3)
    
        # time to update the display
        display.update()
    
        # Run Full Speed!

    • Cancel
    • Vote Up 0 Vote Down
    • Sign in to reply
    • Cancel
Reply
  • scottiebabe
    scottiebabe over 3 years ago

    Pimoroni Thermometer Demo


    Original source code: https://github.com/pimoroni/pimoroni-pico/blob/main/micropython/examples/pico_display/thermometer.py


    I modified this sample application to run on a 240x240 display. This really only involved creating a display object from the 240x240 driver class. I also removed the sleep statement for the demo to run as fast as possible.

    You don't have permission to edit metadata of this video.
    Edit media
    x
    image
    Upload Preview
    image

    Sorry I bumped the board slightly out of focus. This is another neat example of what kind of performance you might see using uPython for graphics on a Pico.


    The modified code I used:

    # This example takes the temperature from the Pico's onboard temperature sensor, and displays it on Pico Display Pack, along with a little pixelly graph.
    # It's based on the thermometer example in the "Getting Started with MicroPython on the Raspberry Pi Pico" book, which is a great read if you're a beginner!
    
    from machine import Pin
    import utime
    import gc
    from breakout_colourlcd240x240 import BreakoutColourLCD240x240
    
    rst = Pin(13,Pin.OUT)
    rst.value(1)
    
    width = BreakoutColourLCD240x240.WIDTH
    height = BreakoutColourLCD240x240.HEIGHT
    
    display_buffer = bytearray(width * height * 2)  # 2-bytes per pixel (RGB565)
    display = BreakoutColourLCD240x240(display_buffer)
    
    # reads from Pico's temp sensor and converts it into a more manageable number
    sensor_temp = machine.ADC(4)
    conversion_factor = 3.3 / (65535)
    temp_min = 25
    temp_max = 60
    bar_width = 5
    
    # Set the display backlight to 50%
    display.set_backlight(0.5)
    
    temperatures = []
    
    colors = [(0, 0, 255), (0, 255, 0), (255, 255, 0), (255, 0, 0)]
    
    def temperature_to_color(temp):
        temp = min(temp, temp_max)
        temp = max(temp, temp_min)
    
        f_index = float(temp - temp_min) / float(temp_max - temp_min)
        f_index *= len(colors) - 1
        index = int(f_index)
    
        if index == len(colors) - 1:
            return colors[index]
    
        blend_b = f_index - index
        blend_a = 1.0 - blend_b
    
        a = colors[index]
        b = colors[index + 1]
    
        return [int((a[i] * blend_a) + (b[i] * blend_b)) for i in range(3)]
    
    while True:
        # fills the screen with black
        display.set_pen(0, 0, 0)
        display.clear()
    
        # the following two lines do some maths to convert the number from the temp sensor into celsius
        reading = sensor_temp.read_u16() * conversion_factor
        temperature = 27 - (reading - 0.706) / 0.001721
    
        temperatures.append(temperature)
    
        # shifts the temperatures history to the left by one sample
        if len(temperatures) > width // bar_width:
            temperatures.pop(0)
    
        i = 0
        for t in temperatures:
            # chooses a pen colour based on the temperature
            display.set_pen(*temperature_to_color(t))
    
            # draws the reading as a tall, thin rectangle
            display.rectangle(i, height - ((round(t)-20) * 4), bar_width, height)
    
            # the next tall thin rectangle needs to be drawn
            # "bar_width" (default: 5) pixels to the right of the last one
            i += bar_width
    
        # draws a white background for the text
        display.set_pen(255, 255, 255)
        display.rectangle(1, 1, 100, 25)
    
        # writes the reading as text in the white rectangle
        display.set_pen(0, 0, 0)
        display.text("{:.2f}".format(temperature) + "c", 3, 3, 0, 3)
    
        # time to update the display
        display.update()
    
        # Run Full Speed!

    • Cancel
    • Vote Up 0 Vote Down
    • Sign in to reply
    • Cancel
Children
No Data
element14 Community

element14 is the first online community specifically for engineers. Connect with your peers and get expert answers to your questions.

  • Members
  • Learn
  • Technologies
  • Challenges & Projects
  • Products
  • Store
  • About Us
  • Feedback & Support
  • FAQs
  • Terms of Use
  • Privacy Policy
  • Legal and Copyright Notices
  • Sitemap
  • Cookies

An Avnet Company © 2025 Premier Farnell Limited. All Rights Reserved.

Premier Farnell Ltd, registered in England and Wales (no 00876412), registered office: Farnell House, Forge Lane, Leeds LS12 2NE.

ICP 备案号 10220084.

Follow element14

  • X
  • Facebook
  • linkedin
  • YouTube