shabaz designed a Data Acquisition Board (DAB ) for the Pico: Data Acquisition Board for Pi Pico . In this post, I'll measure the analogue front-end, and show how it behaves within its +- 4V range.
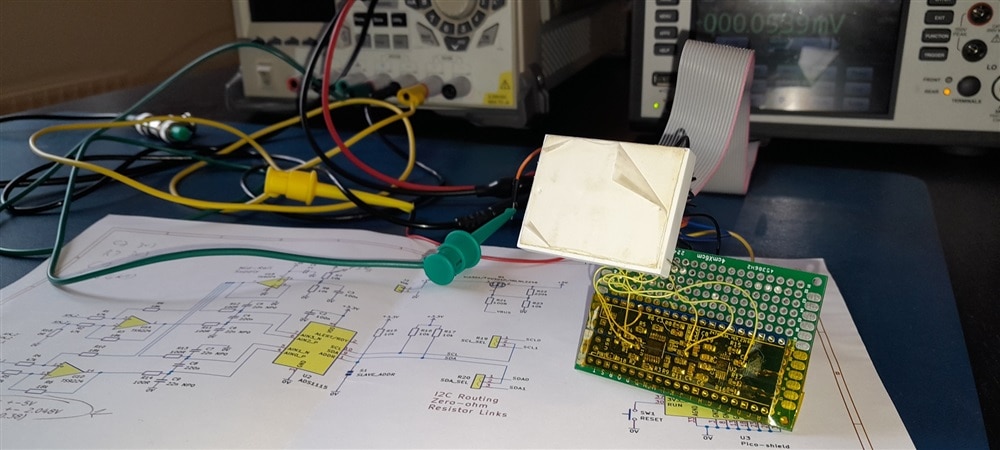
I've attached probes to the main points of interest. Then applied input values between +4 V and -4 V, in steps of 0.5 V.
The data is collected in a spreadsheet to try and spot trends and stability.
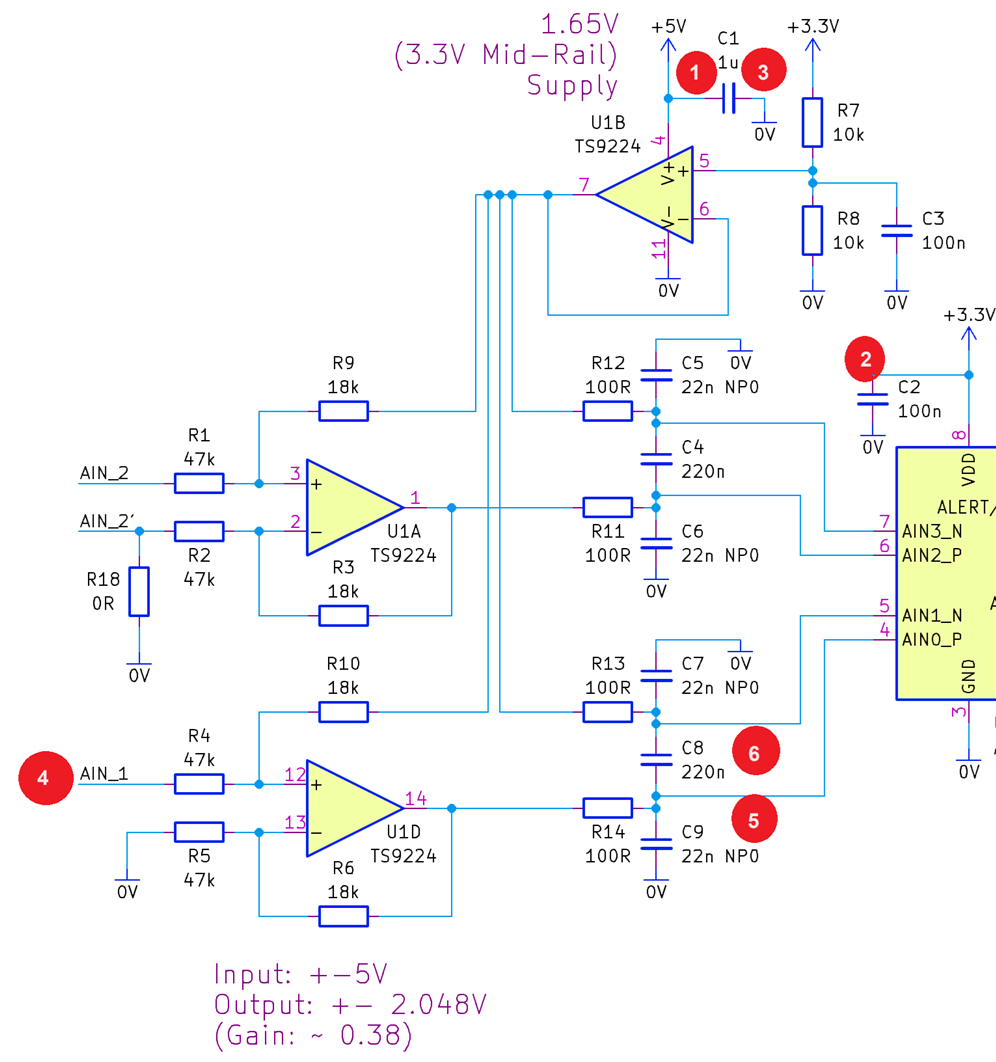
Measurement points
| 1 | 5V | supply | power |
| 2 | 3.3V | supply | power |
| 3 | GND | supply | power ground |
| 4 | AIN_1 | test voltage | input |
| 5 | AIN1_P | opamp U1D out | output |
| 6 | AIN1_N | opamp U1B out | virtual ground |
Test results and calculations
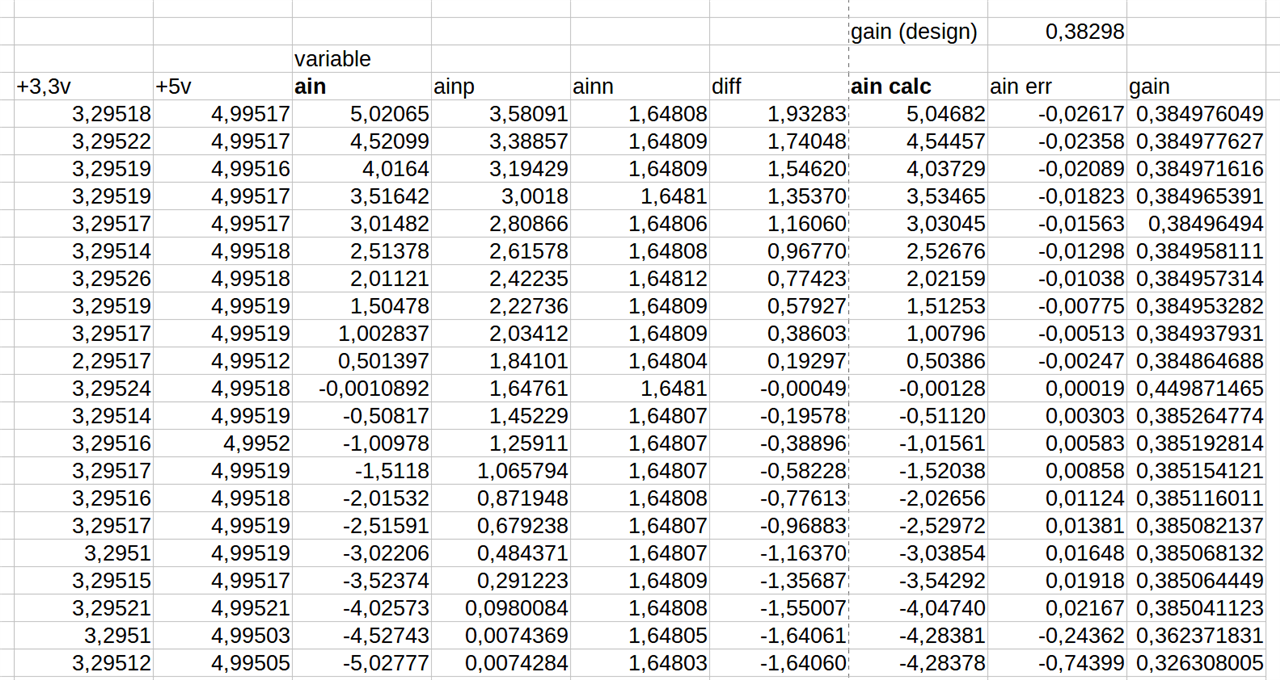
- The first 5 columns reflect the testing points of the previous chapter (without GND), and are all measured (in V).
- diff: ainp - ainn, in essence, it is input * gain, measured
- ain calc: diff * theoretical gain, (circuit gain, based on resistors used, is 0.38298), should ideally match ain
- ain err: ain - ain calc. How much does the calculated ain differ from the actual input
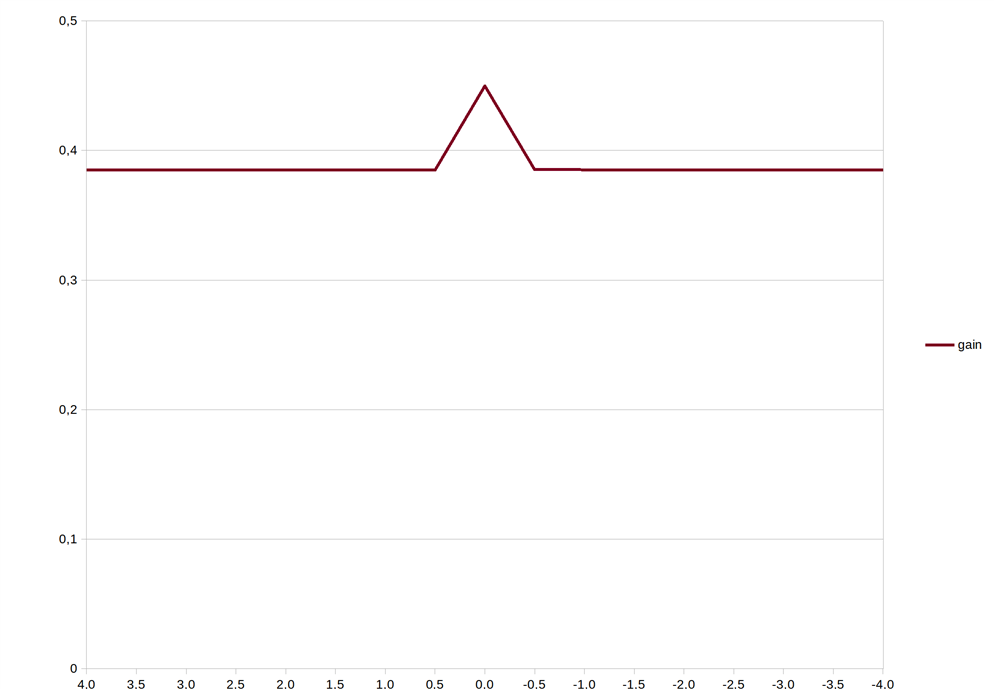
- gain: what is the actual gain of U1D at each sample
Graphs and trends
Error
Let's first look at the error across the range:
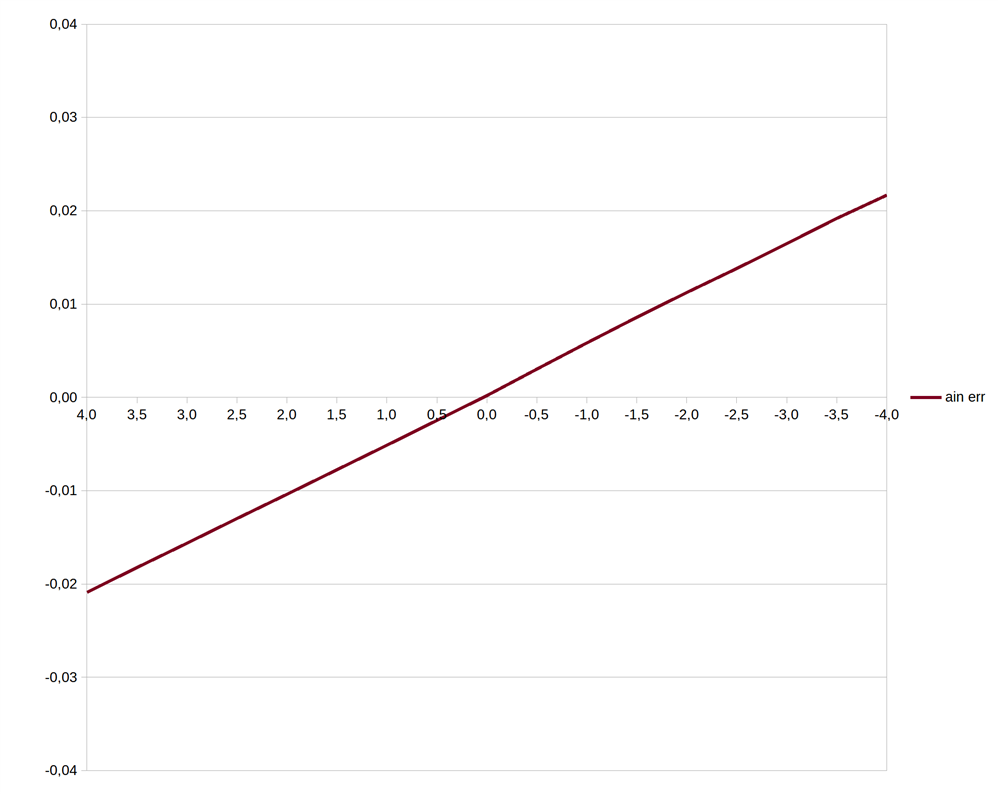
This is very linear. and crosses at 0V input. That points to (discuss if you have a different opinion):
- no offset error
- the gain isn't 0,38298, but closer to 0.385
Here is the same graph if I set the gain for calculations to 0.385:
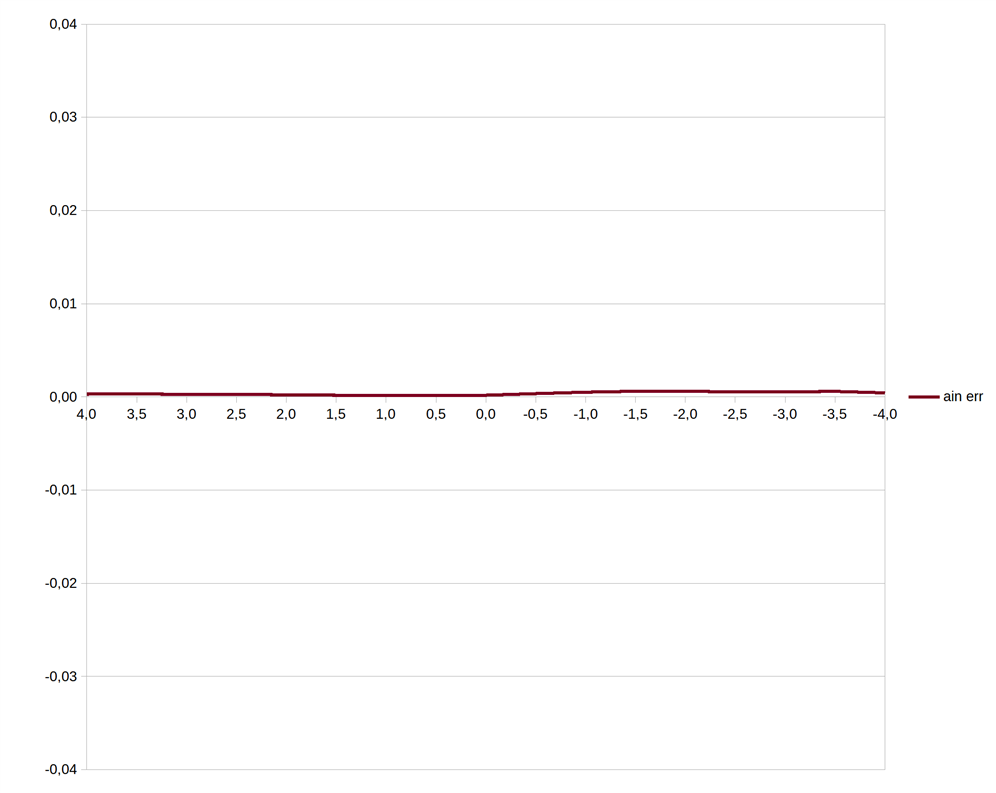
This is good news for calibration algorithms. Easy to program as a function. No lookup tables needed.
Gain
The gain is also consistent across the range. I blame the peak at 0 to calculation error factor (discuss). Everything is close to 0 at that point.
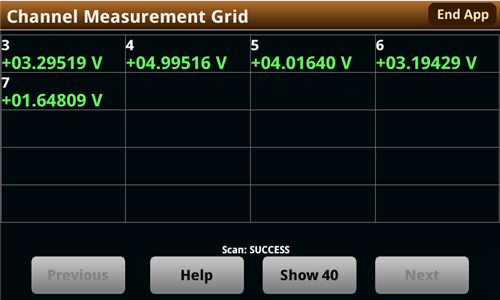
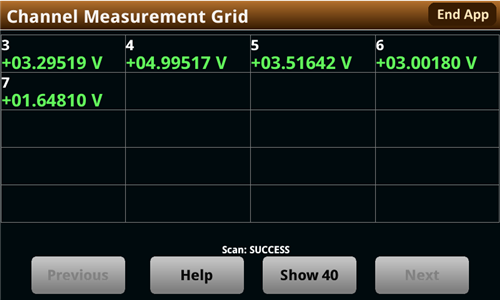
I did double-check the values though.
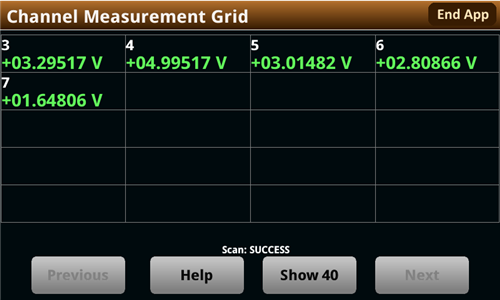
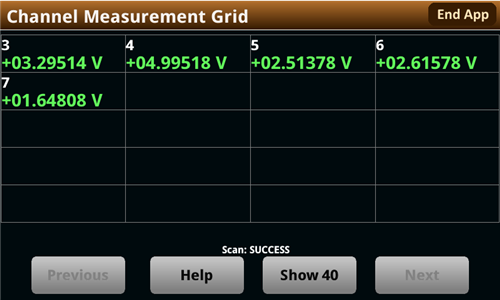
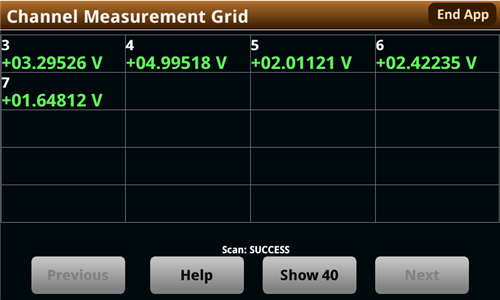
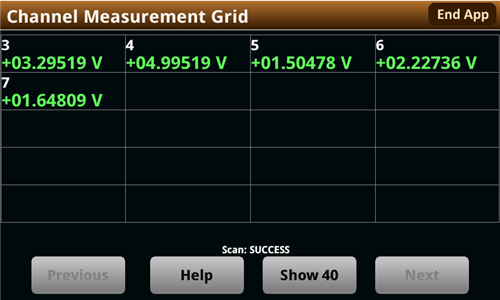
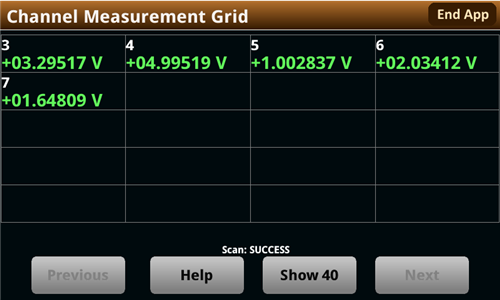
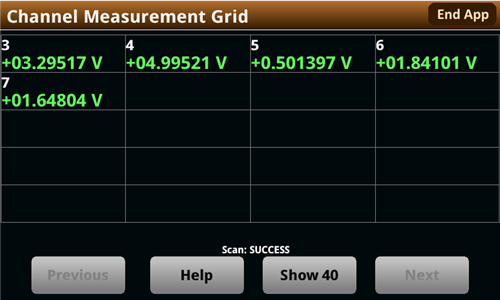
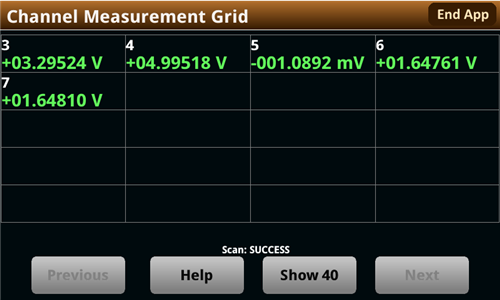
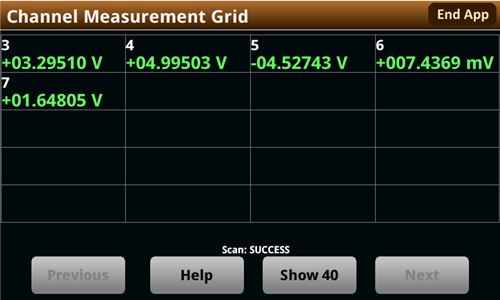
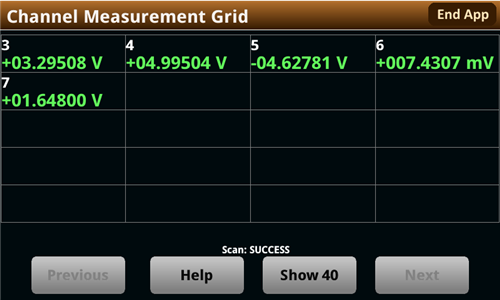
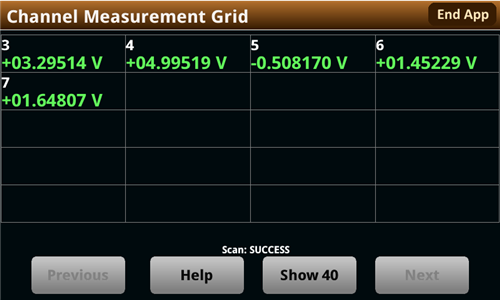
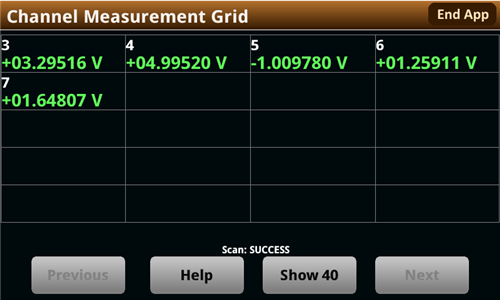
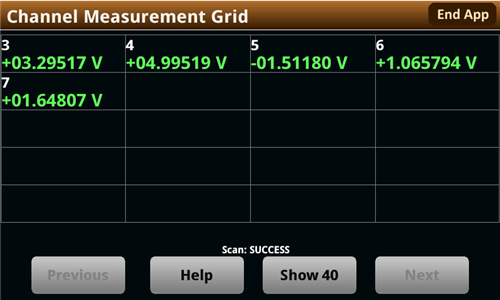
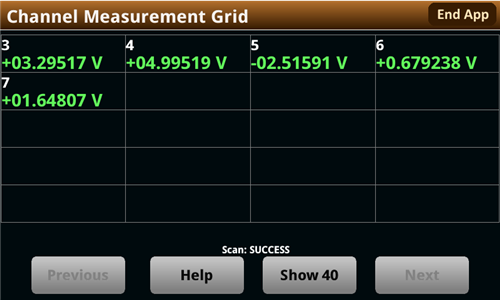
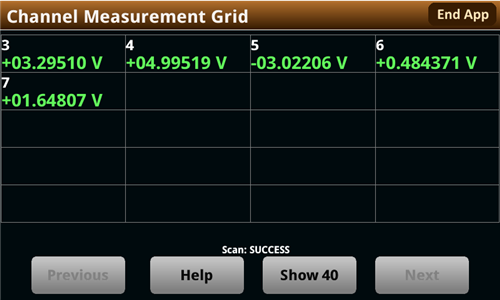
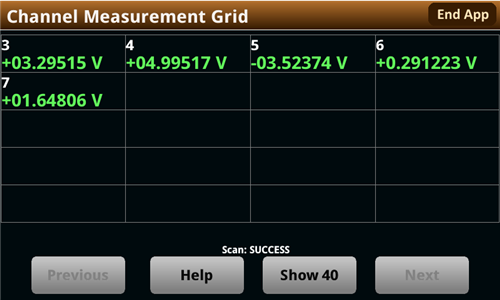
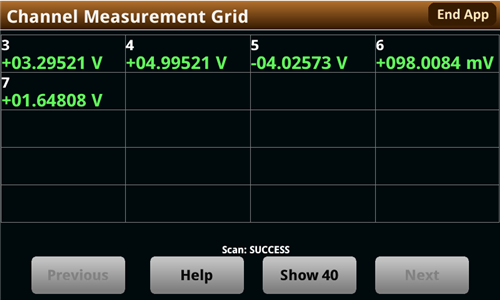
Here are all measurements:


And the spreadsheet:

