


Introduction
In this blog I will utilise the 3 Series MDO to collect data from a Flux Probe or Air Gap Search Coil installed inside a generator and utilise the maths within the scope to carry out an analysis of the signal. This test again involves taking the 3 Series MDO out to a location as well as some bench work with a Flux Probe Analyser. I also aim to utilise the TekScope Anywhere software a little more.
Where as the previous blog looked at partial discharge data that represented the condition of the insulation in the high voltage stator winding, the Flux Probe looks at data that represents the condition of the insulation in the low voltage rotor winding, and specifically the insulation between each turn within the winding coils. This picture of a rotor rewind in progress, shows the parts of a rotor winding and the inter-turn insulation I am monitoring.

The Flux Probe is in actual fact a small inductive pickup installed on one of the stator wedges and picks-up the magnetic field of the rotor winding as it spins past. Each coil of the rotor winding induces a pulse into the Flux Probe, that is picked up by a bespoke analyser or an oscilloscope.


The amplitude of the pulse is a representation of the number of turns within that coil and should the insulation be damaged, then a smaller pulse will be observed for that coil.
As the rotor winding is made up of two identical halves, known as poles, a comparison of the pulses from one pole to the other should produce a match. If differences are seen, this is indicative of an inter-turn fault in the winding.
Flux Probe Data Capture from a Generator
The Flux Probe data is usually captured from a generator at the same time as capturing the partial discharge data, it is just another bit plugged into another sensor. Where as partial discharge data collection is slow and time consuming to analyse, Flux Probe data capture is done within seconds and the analysis is almost instant. The setup for the data capture can be seen below.

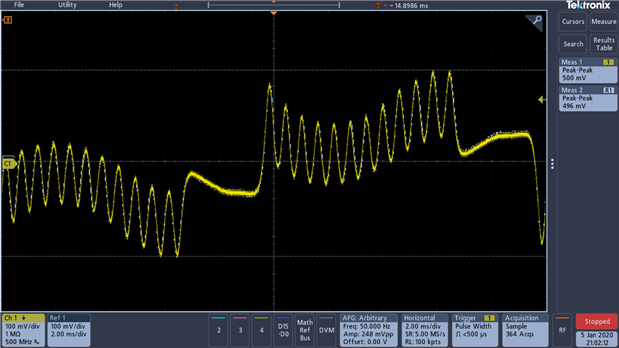
A closer picture of the signal on the screen.

The screen capture from the oscilloscope shows the peak to peak measurement applied to the waveform. This actually gives me an immediate problem as the 86 mV measured is too low of a signal for the RFA-II analyser to work correctly.


You can see in the bottom right corner, that the software is reporting that the signal is too low for analysis. The data table contains no detail, and you can see that the waveform on the plot does not fill up much of the plot. So this leaves it just with the 3 Series MDO to carry out the analysis. The analysis is carried out by subtracting the original waveform from a copy of that waveform that has been inverted and displaced by 10 ms.
The quick way to carry out a comparison on site, and the way I have achieved it with my other oscilloscopes, is to save the waveform into one of the reference channels and reconfigure to lay the signals over one another and carry out a visual comparison as seen in the screenshot below.

This is pretty messy and not that easy to analyse, so I wanted to take a look at the maths functions to see if I could carry out a better analysis without using my tired old eyes. To save doing this on site whilst I am collecting other data, the file captured is saved as a 'isf' file that can be recalled back onto the oscilloscope and also played back via the built-in waveform generator.
Off-site Analysis of Waveform
The first attempt at analysis was utilising the oscilloscope itself and playing the signal back into one of the channels. It was at this point that I realised I had only saved the signal out on site with a memory depth of 1 kpts. Whilst this gave me an acceptable screen on site, playback from the waveform generator was not good at all. Unperturbed by this slight gaff, I looked at the math functions available to carry out the analysis with.

The scope has a number of trigonometric functions built into it, but nothing I could figure out how to use to shift the waveform along by 10 ms or 180 degrees. The Picoscope software has a time delay function built into it that allows a waveform to be moved along the horizontal axis, but it would appear that the 3 Series MDO does not posses a comparable feature. The analysis on the Picoscope is shown below for comparison with the red line at the bottom the result of the maths carried out on the waveform. The signal can also be smoothed out in the Picoscope using the digital filters built in to it, something else the 3 Series MDO does not appear to have.

This takes me back to see if I can improve on the visual comparison of the waveforms. To improve the playback, I utilised some other Flux Probe signals I have captured a while back with a different oscilloscope.

The analysis starts out the same as before, by saving the signal into one of the reference channels. After inverting channel 1, I can then visually align the reference channel and channel 1 to obtain the visual comparison. A maths channel can then be added to subtract the reference channel from the channel 1. The signal is a little bit tricky to stabilise and I ended up setting the trigger to a pulse width trigger. If the channel is not stabilised and aligned with the reference, then the maths channel does not subtract the peaks as desired.
| {gallery} Analysed Flux Signal |
|---|
Flux Probe Signal on Channel 1 laid over Reference Channel |
Maths analysis added at 100 mV/div |
Maths analysis added at 500 mV/div |


The maths channel added at the same voltage setting as the waveforms, shows quite a lot of noise and is difficult to interpret. A higher voltage setting can be used for the channel, that gives a clearer picture, but obviously would loose some resolution and cause smaller faults to be missed.
To see how this would work in practice, I modified one of the 'csv' files within Excel to create an apparent fault. The fault is circled in the Excel screenshot below. The peak was initially at -0.246 V and was taken down to -0.205 V. a difference of 41 mV or 16.675.

| {gallery} Flux Probe Signal with Fault |
|---|
Faulted Flux Probe Signal with Channels Overlain |
Faulted Flux Probe Signal with Maths channel at same voltage |
Faulted Flux Probe Signal with Maths at higher voltage |


Visually, the difference in the signals on the peak furthest to the right is reasonably clear on the traces. The addition of the maths channel at the same voltage does provide a little verification and the effect of increase the voltage on the maths channel shows the resolution lost.
Playing the Signal back into the RFA-II Analyser
Analysis of the Flux Probe Signal was a little disappointing with the 3 Series MDO, so I hoped to utilise the waveform generator some more by playing the captured signals back into the RFA-II Flux Probe Analyser. The signal was fed straight into the RFA-II from the waveform generator and also fed into channel 1 of the oscilloscope for confirmation of the signal applied.

Analysis with the RFA-II is usually automatic, although a manual analysis to detect peaks is available and the option to change the level of attentuation. Initially, I tried to play back the first the signal from the data collection at 300 mVpp, which is the minimum voltage level required by the RFA-II, but this also failed to produce an analysis.

Increasing the voltage output eventually allows the RFA-II to detect the signal, but it still cannot determine the peaks and the waveform produced is a little erratic. I presume that this is due to the lower memory depth used for the signal collection, so I went back to the previous Flux Probe signals and in particular the one that I had added a fault to.
| {gallery} RFA-II Analysis Fail |
|---|
Peak detect fail message on RFA-II |
Manual peak detect of waveform |
RFA-II Analysis of Flux Probe Signal |


You can see in the final screen shot that the Rotor Flux software is reporting quite large shorts on a number of tgh coils, which does not match the visual analysis on the oscilloscope. This is likely to be due to the methodology of playing back the signal via the waveform generator from the initial capture and I don't believe it is an actual issue with the oscilloscope.
The flux probe signal with the 16.67% fault added to it was next to be played back into the RFA-II. I payed this back at both 1 kpts and 10 kpts memory depth to get an idea of the differences. The RFA-II did pick up the faults played back by the oscilloscope although the results for the 1 kpts signal were closer to the 16.67% failure than the results for the 10 kpts signal.
| {gallery} RFA-II analysis of fault |
|---|
Faulted Flux Probe Signal at 1 kpts into RFA-II |
Faulted Flux Probe Signal at 10 kpts into RFA-II |
Signal quality for leading coils at 1 kpts |
Signal quality for leading coils at 10 kpts |
RFA-II Comparison of signals |


Visually, the difference in the signal quality can be seen in the plots for the leading coils, with the 10 kpts signal, not surprisingly producing a smoother looking waveform. The RFA-II can also show the differences between different signals collected as seen in the last plot.
Conclusions
The oscilloscope can capture the data from a Flux Probe installed in a generator. Disappointingly, it did not offer the maths functionality that I would have liked to carry out the analysis of the waveform within the oscilloscope. Some analysis can be done, but it is a little tricky and time consuming and the results were not fantastic. Ultimately, the Picoscope offers better analysis due to the extra delay function and built in filters that the 3 Series MDO does not offer.
I could play back the signals into the RFA-II without any real issue. Pleasingly, the RFA-II did respond to faults deliberately put into the signal. Modification of this signal within Excel was much easier than partial discharge signals. Whilst the waveform generator struggles with some waveforms due to its relatively low number of points, as long as the rotor flux signal is recorded with enough detail in the first place, it can successfully play it back.
It would be good at some point to return to the site and take a recording of the flux probe signal with an amplifier and using a higher memory depth and repeat the playback into the RFA-II to see if the results are more consistent with the traces on the oscilloscope. Unfortunately, work constraints probably won't allow for this within the roadtest period.
Top Comments