RoadTest: Test out the Raspberry Pi Compute Module 5 Development Kit!
Author: vlasov01
Creation date:
Evaluation Type: Connectors & Cable
Did you receive all parts the manufacturer stated would be included in the package?: True
What other parts do you consider comparable to this product?: CM4 Dev Kit
What were the biggest problems encountered?: Too many ideas to test
Detailed Review:
Smart homes produce a lot of data and a lot of rules. Is a window open while the heat pump is running? Is the outdoor air worse than the indoor air, so the air exchanger should stay off? Why did the electricity bill jump? Why one automation failes after the last upgrade? Hardcoded automations answer the questions I thought of in advance. I want a house that can also reason about the ones I did not.
I also want it private and local as much as possible. Camera frames, door events and energy data should stay at home, not go to a cloud API all the time.
That is the idea behind PiSoul, my Home Guardian project: Home Assistant, a vision pipeline and a small local LLM, all running on a Raspberry Pi Compute Module 5 dev kit.
LLM inference on a CM5 is an unusual use of the board. The CM5 has a VideoCore VII GPU, but llama.cpp cannot use it productively today (see finding 12), so inference runs on 4 Cortex-A76 cores, with 4 GB of RAM shared with everything else. I could not find much data on it, so I measured it. This post covers the architecture and my benchmark results. I hope it saves someone some time and gives new ideas.
Everything runs as containers on the CM5, deployed with Terraform (templated Quadlet units pushed over SSH). Home Assistant stays the brain. The LLM is one more component that Home Assistant calls when a rule is not enough.
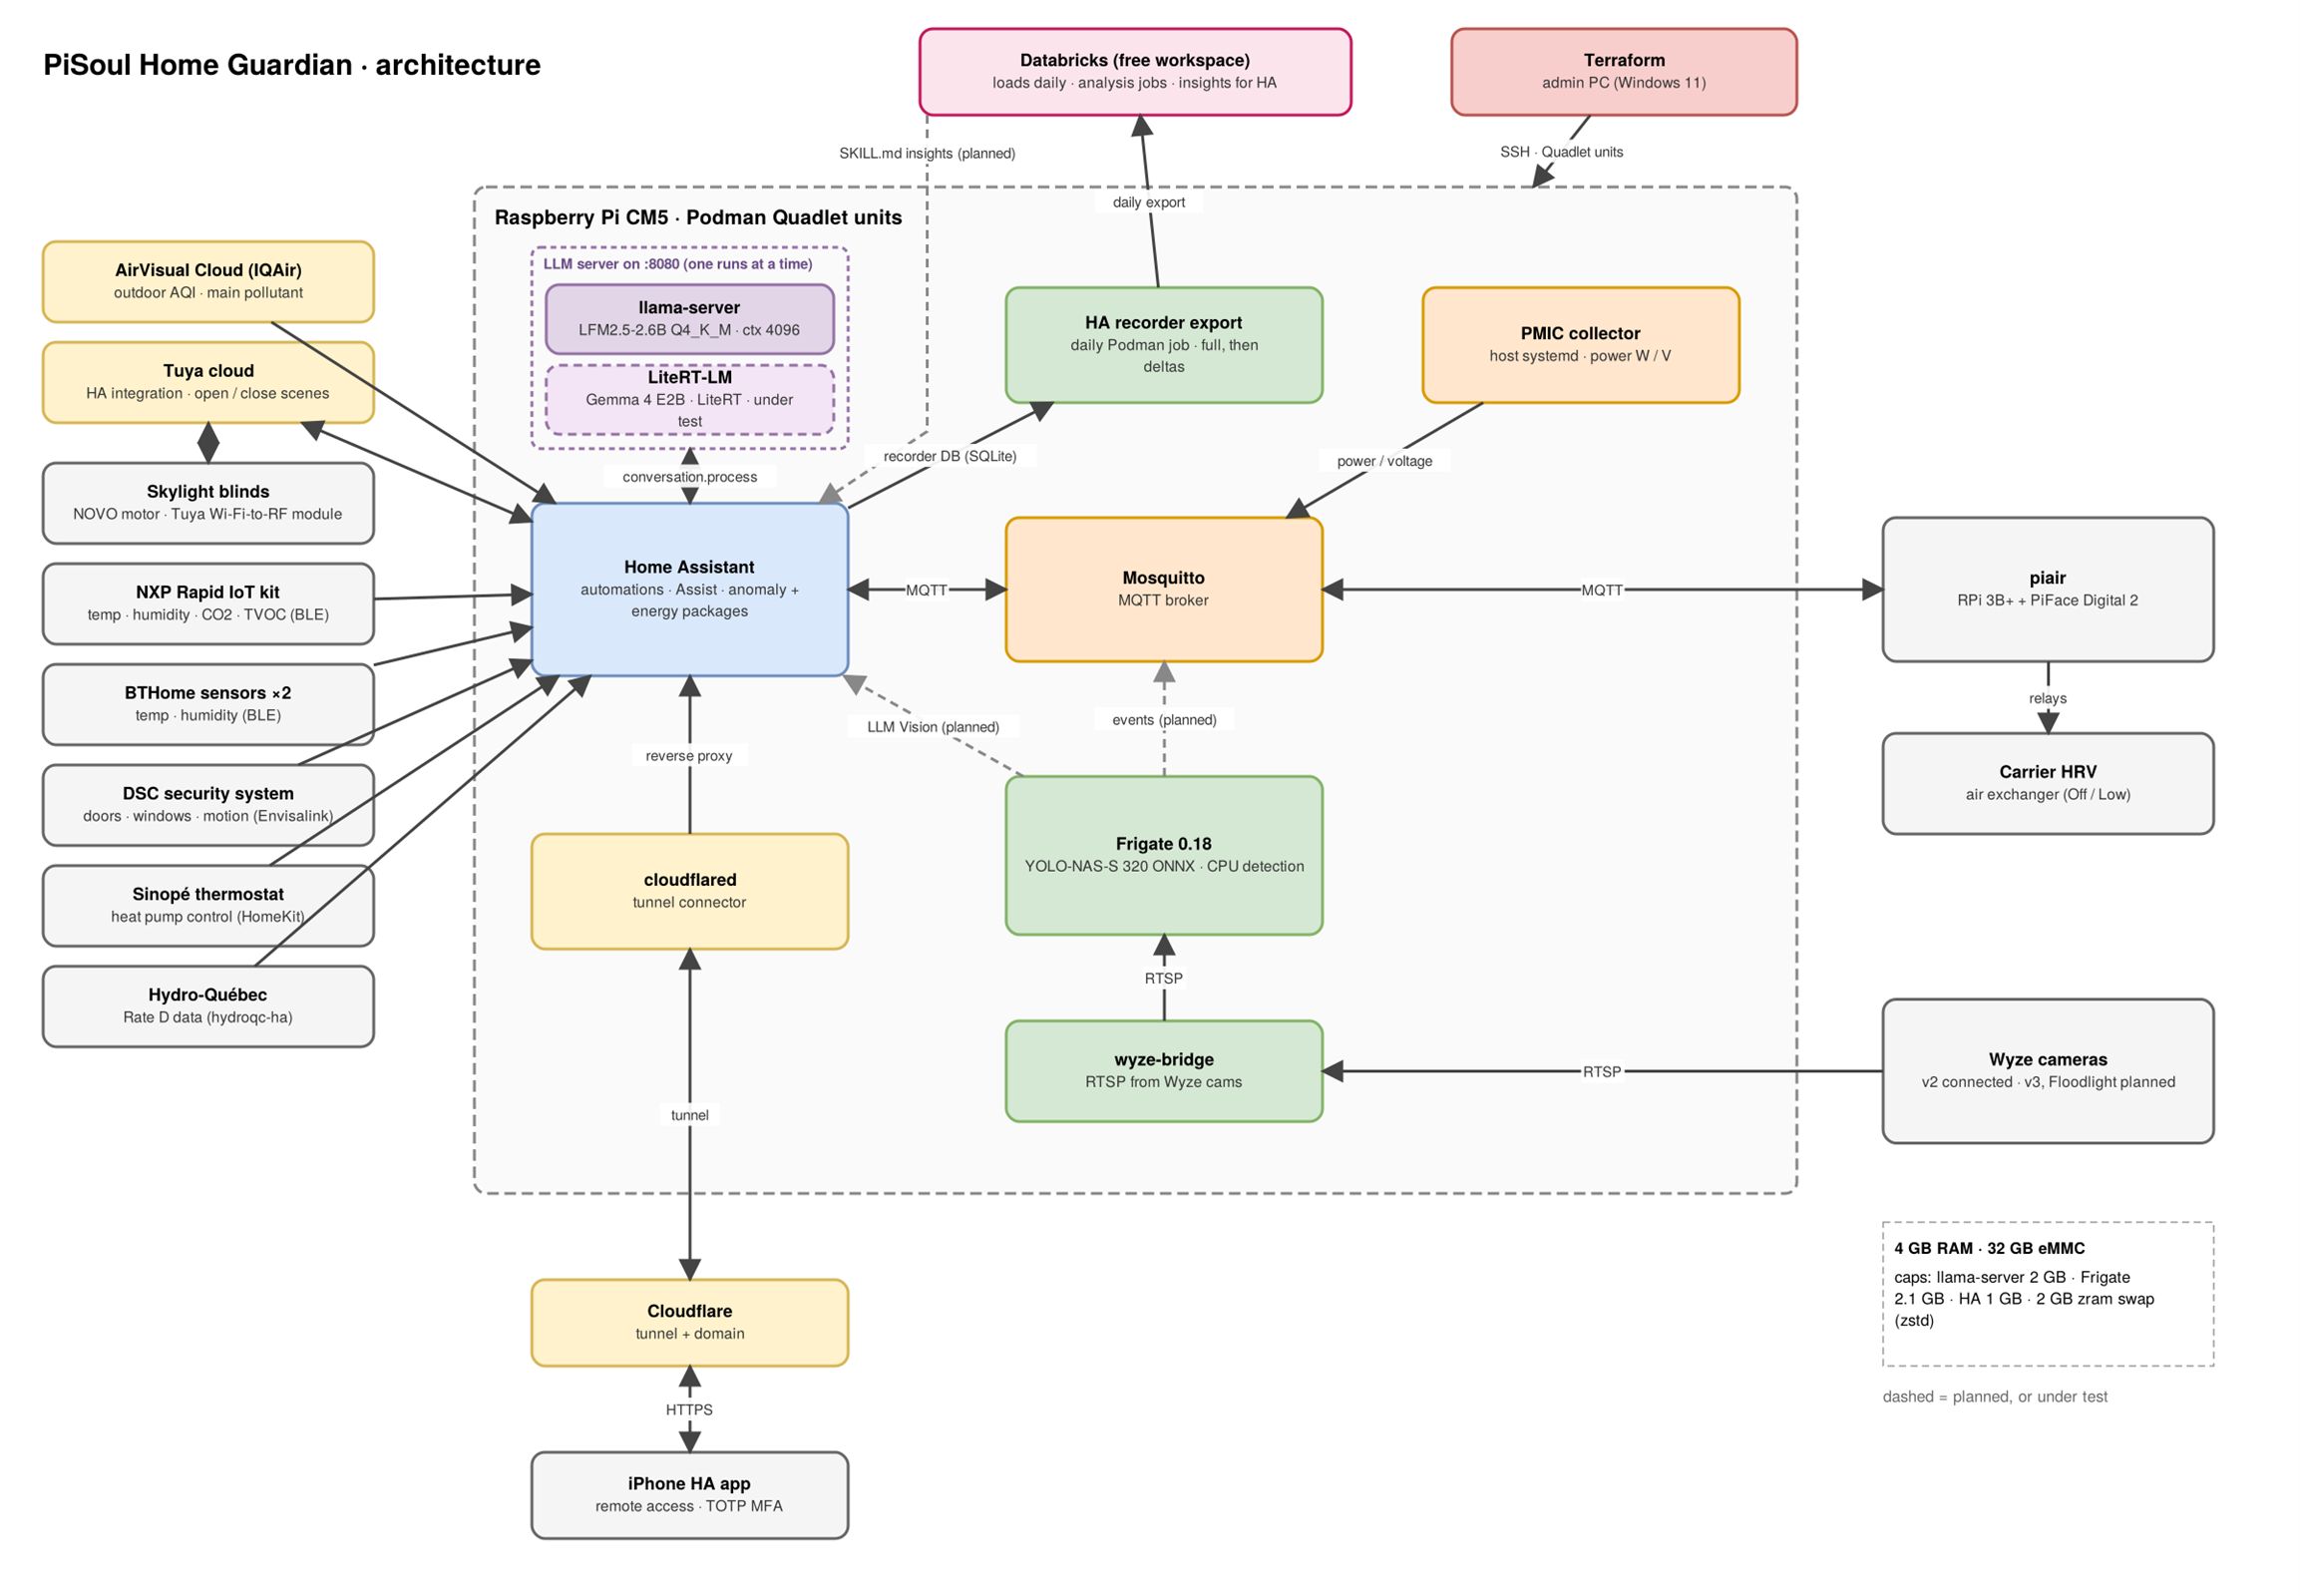
Figure: PiSoul architecture diagram
Key components on the CM5
HA recorder export and Databricks Lahehouse. A daily Podman job (full export on the first run, then deltas) sends the Home Assistant recorder data to a free Databricks workspace, where scheduled jobs load and analyse it. My recorder keeps only 7 days on CM5, so the export builds the long-term history that the database itself does not keep due memory constraints. Once a few more days of history have accumulated, Home Assistant will pull the insights back as a SKILL.md every day for the LLM to use. That last step is still planned.
Air exchanger and AirVisual Cloud. The Home Assistant AirVisual Cloud integration (IQAir) gives my automation its outdoor air quality, and it plays a key role in running the air exchanger. If the air outside is worse than the air at home, for example because of forest-fire smoke or other pollution, the exchanger should not run, and should wait for a better time. The integration polls the cloud. With a free Community API key (limited to 10,000 calls a month) it updates about every 5 minutes, so the outdoor reading can be a few minutes old. The key is valid for 12 months and must be renewed before it expires.
Around the CM5
The LLM is called through Home Assistant's conversation.process. Today it powers an energy and anomaly detection package, and the result is sent to my phone as a notification.
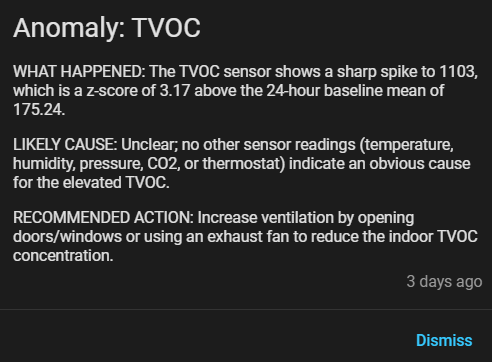
Figure: Home Assistant anomaly notification
The llama-server container is deliberately small: a 2 GB memory cap and --ctx-size 4096. The Exec line also sets --threads 2 --threads-batch 4, flash attention (-fa on) and a q8_0 KV cache. Reasoning is switched off (--reasoning off --reasoning-budget 0), because for notifications and tool calls I do not want thinking tokens.
The official llama.cpp server image has no llama-bench in it, so I run the benchmark from the full image in a throwaway rootless Podman container, with the same models directory mounted read-only.
To get repeatable numbers, my script does this each time:
llama-bench sweepsTwo terms used below:
System: CM5 dev kit, 4 GB RAM, 32 GB eMMC, Cortex-A76 x4 at up to 2.4 GHz, kernel 6.18 (rpt-rpi-2712), model lfm2.5-2.6b-q4_k_m.gguf.
The scripts are here: [link to scripts - TODO]
This is the most useful result so far.
|
Threads |
pp (tokens/s) |
tg (tokens/s) |
|---|---|---|
|
1 |
7.8 |
4.5 |
|
2 |
16.2 |
6.7 |
|
3 |
23.4 |
6.3 |
|
4 |
28.5 |
5.7 |
Prompt processing is compute-bound and scales almost linearly with cores. Generation is memory-bandwidth-bound. It peaks at 2 threads and gets slower after that. So one thread count is a compromise for both, and llama.cpp has separate settings for the two phases: --threads for generation and --threads-batch for prompt processing. Using 2 and 4 gives the best of both.
I tried six combinations of -b (512, 1024) and -ub (128, 256, 512). Prompt speed was 16.2 tokens/s in all of them. The workload is compute-bound, so I left the defaults.
|
Configuration |
pp at depth 0 |
pp at depth 1024 |
tg at depth 0 |
tg at depth 1024 |
|---|---|---|---|---|
|
no flash attention, f16 |
15.4 |
13.8 |
6.8 |
6.2 |
|
flash attention, f16 / f16 |
16.1 |
15.4 |
6.8 |
6.0 |
|
flash attention, q8_0 / q8_0 |
15.8 |
13.9 |
6.7 |
6.2 |
|
flash attention, K q8_0 / V f16 |
16.0 |
14.7 |
6.9 |
6.3 |
Everything is within about 10%. On 4 GB of RAM I keep q8_0 for the memory savings.
With 2048 tokens already in the context, generation dropped from 6.6 to 5.3 tokens/s. On this board, long prompts are expensive, and I keep them as short as I can.
These are 5-minute soaks of back-to-back requests (about 350-token prompts, 128 generated tokens) against a test container started with the same flags as my Quadlet. For the Frigate rows, one camera had already been running for 5 minutes before the test started. Most runs were in the evening or at night, when the camera sees little, so these are quiet-scene numbers (finding 13 covers a busier scene).
|
Setting |
Frigate (1 camera) |
TTFT |
pp |
tg |
CPU temp (mean / max) |
PMIC power |
|---|---|---|---|---|---|---|
|
|
stopped |
12.4 s |
28.9 |
6.6 |
65 / 72 C |
6.4 W |
|
|
running |
13.0 s |
27.5 |
6.2 |
67 / 73 C |
6.3 W |
|
|
stopped |
12.4 s |
28.7 |
5.8 |
66 / 73 C |
6.2 W |
|
|
running |
13.0 s |
27.5 |
5.4 |
68 / 73 C |
6.1 W |
Before I added --threads-batch 4, prompt processing ran at about 15 tokens/s. Now it runs at about 29. Two threads for generation beats four by 12 to 14% at the same prompt speed, so --threads 2 --threads-batch 4 stays. In a quiet scene, one Frigate camera costs only about 5% of prompt speed and 7% of generation speed (finding 13 covers a busier scene). In my first test it looked much worse (about 40%), because I measured one minute after starting Frigate while its startup work was still running. With a 256-token prompt (my 20-minute run), time to first token with Frigate running was 9.7 s. So when you test let other services settle before you measure.
This fits the Frigate-on-CM5 benchmarks by ralphjy. He found that CPU detection with even one camera already pushes the 1-minute load average above 3 on the 4 cores, and power goes from about 2.9 W idle to about 6.7 W. With one camera the effect on the LLM is small, but I expect more cameras on CPU detection to cost more. That test is still on my list.
With Frigate running, I also compared three values of --threads-batch, keeping --threads 2 for generation (5-minute soaks, 256-token prompts):
|
|
TTFT |
pp |
tg |
PMIC power |
CPU temp (mean / max) |
|---|---|---|---|---|---|
|
2 |
16.7 s |
15.8 |
6.3 |
5.6 W |
62 / 68 C |
|
3 |
12.0 s |
22.2 |
6.3 |
6.0 W |
66 / 69 C |
|
4 |
9.7 s |
27.3 |
6.2 |
6.2 W |
66 / 71 C |
Prompt speed grows almost linearly with the batch thread count, and time to first token falls from 16.7 s to 9.7 s, while generation speed stays the same within the noise. The extra threads cost about 0.6 W and 3 C at the peak, but the energy per prompt token stays about the same (0.18 to 0.19 J), so the same work just finishes sooner. With Frigate running, --threads-batch 4 is still the best choice. The last row matches my 20-minute run (27.4 tokens/s, 9.7 s), so the result repeats.
llama-server opened 4 slots by default. With 1, 2 and 4 concurrent requests, TTFT went from 9 s to 19 s to 37 s, so the cores are simply shared. The server does not get faster with more requests. I plan to serialize my LLM calls in Home Assistant instead of firing them in parallel.
I sent a shared 750-token system prompt with different questions. Only about 236 tokens were reused from the cache on every follow-up request, so most of the prompt was processed again. LFM2 is a hybrid (convolution plus attention) model, which I suspect limits cache reuse, but I have not confirmed it.
TODO: investigate the llama.cpp options for this. At about 29 tokens/s, every 100 prompt tokens that are not cached cost me about 3.5 seconds.
At 4 threads the SoC reached 76 C in the llama-bench sweeps. In the 5-minute soak runs with continuous requests, it averaged 65 to 68 C and peaked at 72 to 73 C. The clock stayed at 2.4 GHz and the throttle flag stayed clear in every run. The board has an active fan, which averaged 4,200 to 5,200 RPM (faster with Frigate running). In a 20-minute soak with Frigate running (my production configuration), the temperature averaged 69 C and peaked at 74.4 C, and the fan averaged about 5,300 RPM. Generation speed was about 3% lower in the second half of that run than in the first half (6.09 against 6.26 tokens/s), with the clock unchanged at 2.4 GHz. I do not know why yet.
The soak script samples as root, so it can read vcgencmd and log the throttle flags.
This one changed how I design the project. At the speeds above, prompt tokens are the budget. If the semantic layer I give the LLM (my Home Assistant ontology) is 1500 tokens long, I pay about 50 seconds before the first word, so every entity and rule in it has to justify its place.
With the whole stack running, the 2 GB zram swap device (zstd) held about 0.8 GB of swapped-out pages. zramctl showed 784 MB of data compressed to 227 MB, about 3.5 to 1, so that swap cost only about 235 MB of real RAM. The most RAM zram has used since boot is about 0.6 GB.
This is how llama-server, Frigate and Home Assistant fit together on 4 GB. It also means the board is already under memory pressure before the LLM does any work.
TODO: measure how much of the model stays resident under memory pressure. Finding 11 shows what the pressure costs in speed.
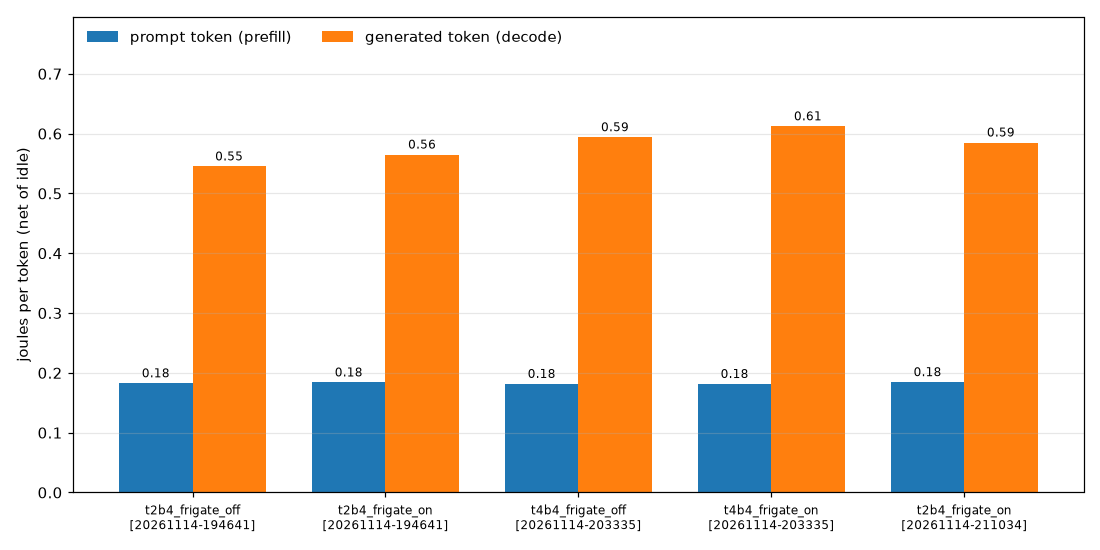
The PMIC reported about 6.1 to 6.4 W during the soak runs. Net of the idle power I measured with the LLM stopped, reading the prompt cost about 0.18 J per prompt token, and writing cost about 0.55 to 0.59 J per generated token at 2 threads and 0.59 to 0.61 J at 4 threads. So 2 threads wins on speed and slightly on energy. A typical request (350 prompt tokens, 128 generated tokens) costs about 135 J, roughly 0.04 Wh. Frigate did not change the energy per token: the cores are saturated either way, so total power stays near 6 W. The PMIC figure is a sum of the SoC-side rails, so it reads lower than a wall meter would.
With Frigate running, available memory bottomed out at 0.7 to 0.8 GB (1.3 to 1.5 GB without it), and swap use rose to about 1.1 GB, of which zram held about 320 MB of real RAM. Swap traffic stayed small, about 100 MB read back and 70 MB written over a 20-minute run, so there was no thrashing, and generation speed lost only 5 to 7% with Frigate running. llama-server's resident memory was 2.0 to 2.2 GB, right at its 2 GB container cap, so a larger context will need a higher cap.
The CM5 has the same VideoCore VII GPU as the Raspberry Pi 5, with Vulkan 1.2 support. So I checked whether llama.cpp can use it.
The short answer is no, not usefully for now, and the reason is the GPU's limits, not the ARM64 architecture. llama.cpp has a Vulkan backend. On the Pi 5's V3D 7.1 GPU (the CM5 uses the same SoC), a mid-2026 bug report lists a 16 KB shared-memory limit, at most 256 invocations per workgroup, and no fp16, int8 or integer-dot support. With stock llama.cpp, the matrix multiplication pipelines either fail to build or the output is garbled. With the reporter's patches, a 1.1B TinyLlama Q4 model produced coherent text at about 0.15 tokens/s, against 11 to 16 tokens/s on the CPU. Other measurements point the same way: one project measured a 1B model decoding about 15 times slower on the V3D with its own Vulkan backend, and a sentence-embedding test through llama.cpp's Vulkan backend found it 25 to 44 times slower than the CPU. The GPU also shares the same LPDDR4X memory as the CPU, and generation is limited by memory bandwidth, so it has no extra bandwidth to offer.
The GPU may still help with other work. An August 2026 post by Igalia describes experimental WebGPU support in the V3DV driver, which lets Google's LiteRT run models on the VideoCore VII. Their demo runs object detection on the GPU while a language model runs on the CPU. That is the same idea as the Frigate offload in What's Next. I have not tested any of this on my CM5, and, as far as I could find, none of Frigate's documented detector types targets the VideoCore GPU.
TODO: build llama.cpp with the Vulkan backend and measure it on my CM5.
TODO: test Frigate detection on the GPU, in three steps. First, measure how much of Frigate's CPU cost is detection, by running the LLM soak with Frigate's detection switched off. Second, run a detector model on the GPU through LiteRT and compare its inference time with the time Frigate reports for its CPU detector. Third, only if that looks promising, try to connect it to Frigate, which would take extra work because Frigate has no built-in detector for this GPU.
I tried splitting the four cores between llama-server and Frigate, using taskset for llama-server and a CPU set for the Frigate container. These are 5-minute soaks with one Frigate camera and 256-token prompts:
|
Setting |
llama-server cores |
Frigate cores |
TTFT |
pp |
tg |
PMIC power |
|---|---|---|---|---|---|---|
|
unpinned (run twice, as a control) |
0-3, batch 4 |
0-3 |
9.6 s / 9.9 s |
27.5 / 26.8 |
6.2 / 6.3 |
6.2 / 6.3 W |
|
pin A |
0-2, batch 3 |
3 |
11.4 s |
23.1 |
6.3 |
6.0 W |
|
pin B |
0-1, batch 2 |
2-3 |
16.4 s |
16.1 |
6.4 |
5.5 W |
|
pin D |
0-3, batch 4 |
2-3 |
10.4 s |
25.9 |
6.0 |
6.3 W |
Pinning llama-server to fewer cores behaves like using fewer batch threads: prompt speed falls in proportion and generation speed does not change. No pinned setting beat the unpinned one. The two unpinned runs agree within 4%, so the differences are real. I keep the defaults.
Frigate's side is harder to read. These runs were after sunset, and it gets dark in Montreal soon after 5 PM in mid-November, so the camera sees less detail and fewer changes. The scene was quiet and Frigate made almost no detections (about 0.1 per second), so its processed and skipped frame rates stayed the same in every setting, and its detector time jumped between 120 and 770 ms without a clear pattern, because Frigate averages it over very few detections. An earlier midday run with more motion (about 1 detection per second) looked different, although it is not a clean comparison, because I polled Frigate's stats more often in it. Prompt speed was 22% lower and generation speed 19% lower than in the quiet evening, and Frigate's detector took 2.6 times longer than with the LLM stopped (319 ms against 122 ms). Pinning Frigate to a single core then gave the LLM about 17% faster generation, but Frigate's detector took 1,381 ms and it processed about half as many frames. So the cost is real when the camera sees activity (finding 14 measures it across a day), and pinning only moves it from the LLM to Frigate.
TODO: replay a recorded video through Frigate so its load is identical in every run, and measure the detector time under each pinning.
To separate the time of day from everything else, I scheduled the same 5-minute soak (production settings, one Frigate camera, 256-token prompts) six times over a day while I was away. The camera sees more in daylight, and Frigate's detection rate tracks it:
|
Local time |
Frigate detections/s |
Frigate CPU |
TTFT |
pp |
tg |
J per generated token |
|---|---|---|---|---|---|---|
|
22:16 (night) |
0.00 |
79% |
9.5 s |
27.7 |
6.4 |
0.57 |
|
09:05 |
0.48 |
120% |
10.4 s |
25.6 |
5.8 |
0.64 |
|
11:35 |
0.40 |
111% |
10.3 s |
25.8 |
6.0 |
0.63 |
|
13:35 |
0.75 |
142% |
11.5 s |
23.6 |
5.8 |
0.66 |
|
15:35 |
1.04 |
168% |
12.4 s |
21.8 |
5.1 |
0.79 |
|
20:05 (night) |
0.00 |
79% |
9.8 s |
26.9 |
6.4 |
0.57 |
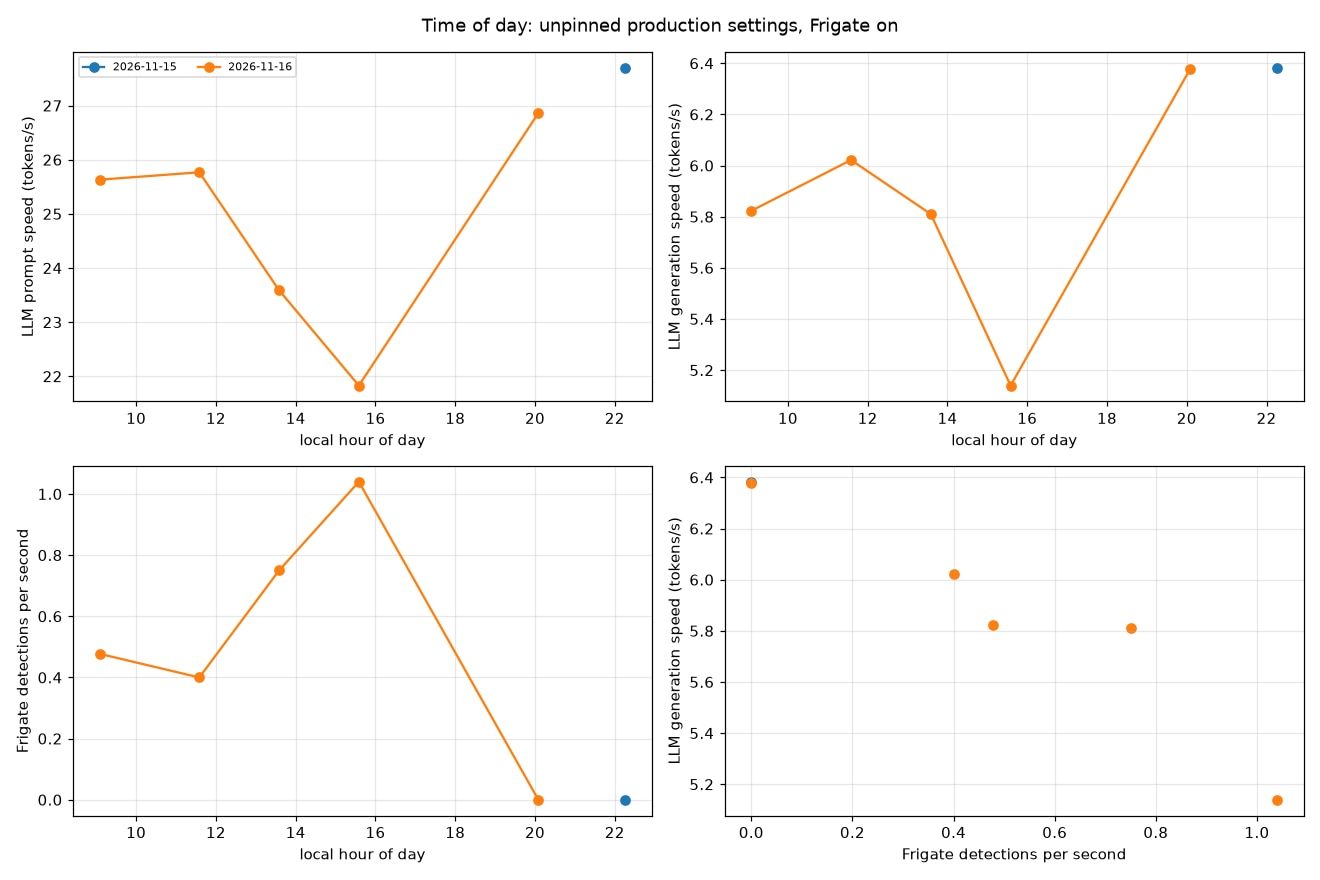
Figure: time of day chart
The more Frigate detects, the slower the LLM, roughly in a straight line. At about one detection per second, prompt speed is 21% lower than at night (21.8 against 27.7 tokens/s), generation speed is 19% lower (5.1 against 6.4), and the wait for the first token is 31% longer (12.4 s against 9.5 s). Power stays at about 6.2 to 6.3 W throughout, so each token costs more energy: 0.79 J against 0.57 J per generated token. At 15:35, generation speed also fell from 5.7 to 4.2 tokens/s between the first and second half of the run. Frigate suffers too. Its reported detector time was about 300 to 330 ms in the runs with detections, against about 120 ms when it was quiet or the LLM was stopped. Its frame handling worsens as well: at 15:35 it processed 1.8 of the camera's 3.2 frames per second and skipped 1.3, against 2.6 of 3.3 processed and 0.7 skipped at night. Temperature barely changed: the CPU averaged 64 to 66 C and peaked at 70.5 to 71.6 C in all six runs, and the clock stayed at 2.4 GHz. The fan was faster only at 15:35 (about 4,950 RPM, against 4,350 to 4,430 in the other runs).
So the first-token wait for a 256-token prompt ranges from 9.5 s to 12.4 s depending on what the camera sees. Available memory also fell across the schedule, from 743 MB at 22:16 to 373 MB at 20:05, with swap peaking at about 1.3 GB.
TODO: find out whether something grows in memory over the day.
Google's Raspberry Pi and LiteRT post made me curious about a different stack, so I ran Gemma 4 E2B with LiteRT-LM in the same kind of test container, with the same 2 GB memory cap and 2.5 GB swap limit, Frigate running and 256-token prompts. The runs were scheduled in the same way for several days. LiteRT-LM has no thread option, while llama.cpp uses 2 threads here.
|
Measure |
llama.cpp, LFM2.5-2.6B (6 runs) |
LiteRT-LM, Gemma 4 E2B (5 runs) |
|---|---|---|
|
TTFT |
10.67 s |
5.24 s |
|
Generation |
5.93 tokens/s |
7.29 tokens/s |
|
Energy per generated token |
0.64 J |
0.44 J |
|
PMIC power |
6.26 W |
5.15 W |
|
Max CPU temperature |
71.3 C |
67.9 C |
|
Peak process memory (RSS) |
1.98 GB |
1.43 GB |
|
Lowest available memory |
531 MB |
1,389 MB |
|
Frigate detector time |
250 ms (120 to 330) |
1,723 ms (143 to 3,934) |
|
Frigate CPU |
117% |
104% |
|
Busiest scene (detections/s) |
1.04 |
0.24 |
The last row matters. The Gemma runs happened on a quieter day, and finding 14 shows that a busy scene slows llama.cpp by about 20%, so this table flatters Gemma. A fairer comparison uses two runs in a quiet scene, with no detections:
|
Measure |
llama.cpp, LFM2.5-2.6B (22:16) |
LiteRT-LM, Gemma 4 E2B (22:41, 3 requests) |
|---|---|---|
|
TTFT |
9.5 s |
5.1 s |
|
Generation |
6.4 tokens/s |
7.2 tokens/s |
|
Energy per generated token |
0.57 J |
0.44 J |
|
PMIC power |
6.25 W |
5.13 W |
|
Peak process memory (RSS) |
2,029 MB |
1,272 MB |
Gemma still wins: the first token arrives 47% sooner, generation is 13% faster, and it uses 18% less power and 37% less memory. The Frigate detector average of 1,723 ms comes from two runs on 18 November (09:40 and 12:08) that both report exactly 3,934.38 ms, which looks like a stuck statistic and not a real measurement. In the other Gemma runs the detector took 143 to 347 ms, about the same as next to llama.cpp.
I also pinned Gemma to cores, as I did with llama.cpp in finding 13:
|
Setting |
TTFT |
Generation |
Frigate detector time |
|---|---|---|---|
|
Gemma, unpinned (10 runs) |
5.26 s |
7.26 tokens/s |
143 to 347 ms |
|
Gemma on cores 0-1 (5 runs) |
7.57 s |
6.93 tokens/s |
433 ms |
|
Gemma on cores 0-1, Frigate on cores 2-3 (5 runs) |
7.33 s |
6.94 tokens/s |
617 ms |
|
llama.cpp, unpinned (6 runs) |
10.67 s |
5.93 tokens/s |
120 to 330 ms |
The lesson is the same as before. Pinning Gemma to two cores made the first token 44% slower and generation 5% slower, and it did not help Frigate: its detector time went up. Gemma's power fell from 5.26 W to 4.93 W, but only because it was doing less work.
These are speed and resource numbers only. I have not compared answer quality or tool calling, and the two stacks differ in model, runtime and tokenizer, so a 256-token prompt is not the same number of tokens for both. That is why I compare time to first token and not prompt tokens per second. One scheduled Gemma run (14:00 on 18 November) never started.
TODO: compare the answer quality and tool calling of LFM2.5 and Gemma 4 E2B on my real Home Assistant prompts.
--threads and --threads-batch separately for llama.cpp. This was my cheapest win.llama-bench. Use the full image for tests.A 2.6B model on a CM5 is usable for short, notification-style prompting. It runs at about 6 to 7 tokens/s for output, but a 256-token prompt waits 9.5 to 12.4 seconds for the first token, depending on how busy the Frigate camera is. For my use case (anomaly detection and energy insights) that is fine due their asynchronous nature, but not for a voice assistant yet. The biggest gains came from understanding what limits each phase and from keeping the prompts short. A different stack was faster and lighter on the same board: in quiet-scene runs, Gemma 4 E2B on LiteRT-LM reached the first token in 5.1 s against 9.5 s and generated 13% faster (7.2 against 6.4 tokens/s), at 0.44 J against 0.57 J per generated token. I have not yet compared the quality of its answers.
I would be happy to compare numbers with anyone running LLMs on a CM5 or Pi 5. What settings and models work best for you?
Thank you to the element14 community for your questions and feedback, and a special thank you to ralphjy for his CM5 benchmarking work that made mine easier to put in context.


