


This blog post is part of a collection, click here for links to the entire set, and a review of the products.
Introduction
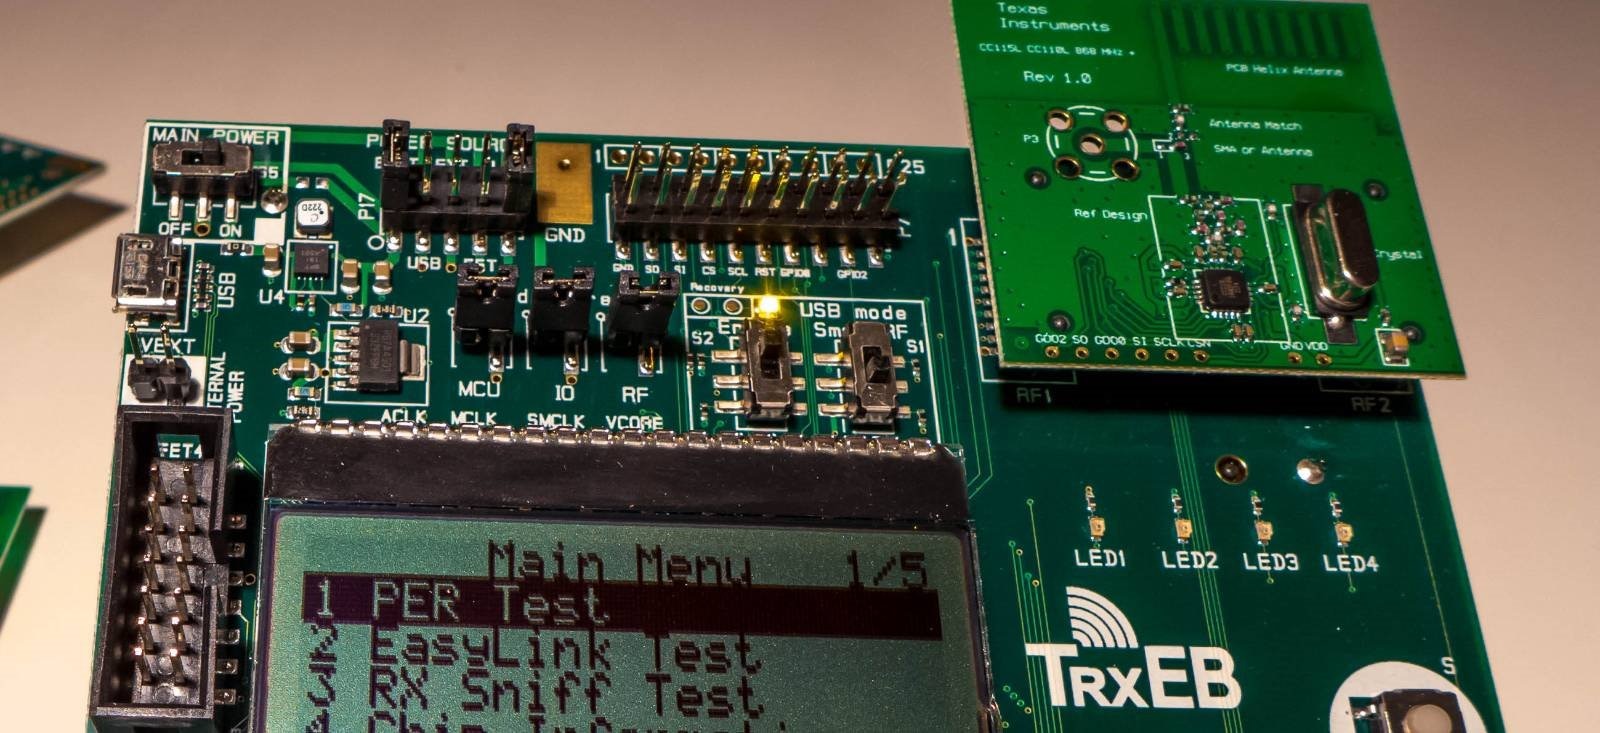
The Texas Instruments CC11xL devices are very low cost sub-1GHz ISM band transceiver/receiver/transmitter integrated circuits. These devices are good for IoT applications and are available as individual chips, or on a small board ready for integrationsmall board ready for integration or on a BoosterPack BoosterPack (Arduino-like shield board) or as part of a full development kitfull development kit. See here for an introduction to the development kit for these chips.
This post investigates the RF output from the TI devices using an Agilent/Keysight spectrum analyzer.
Replacing the Antenna
The radio evaluation modules that are supplied as part of the development kit have an on-board PCB trace antenna with exceptional performance in real-world experiments; I was able to maintain a reliable packet transmission from my home to the next street.
I decided to move the small 100pF capacitor from position 2-3 and move it to position 1-2 (see the circled area in the photo below) in order to disable the on-board PCB antenna, and direct the transmission into an RF connector. This would allow me to be able to connect up a spectrum analyzer and view the transmitted signal.
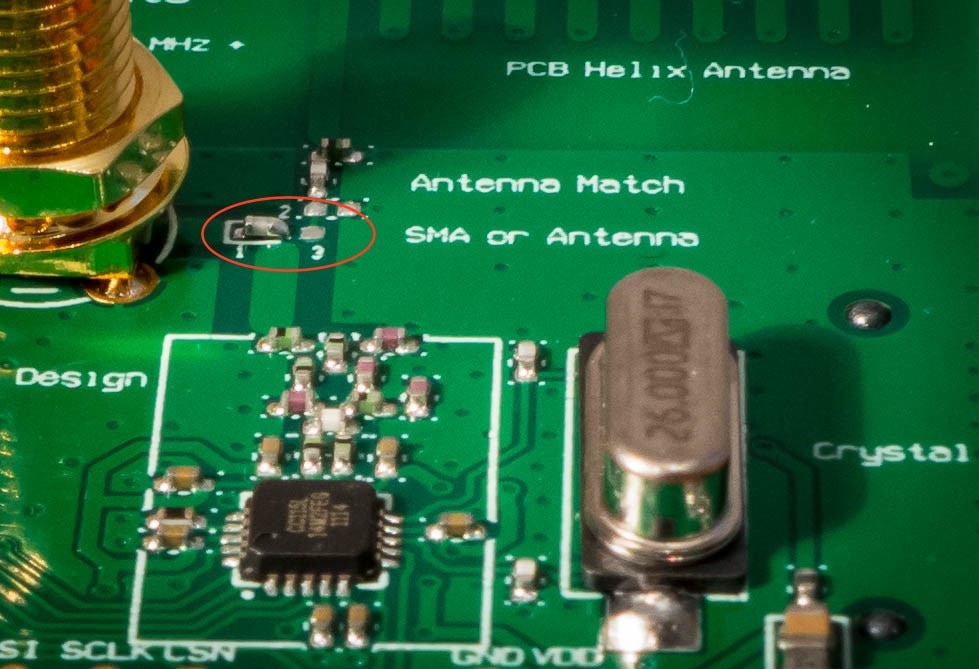
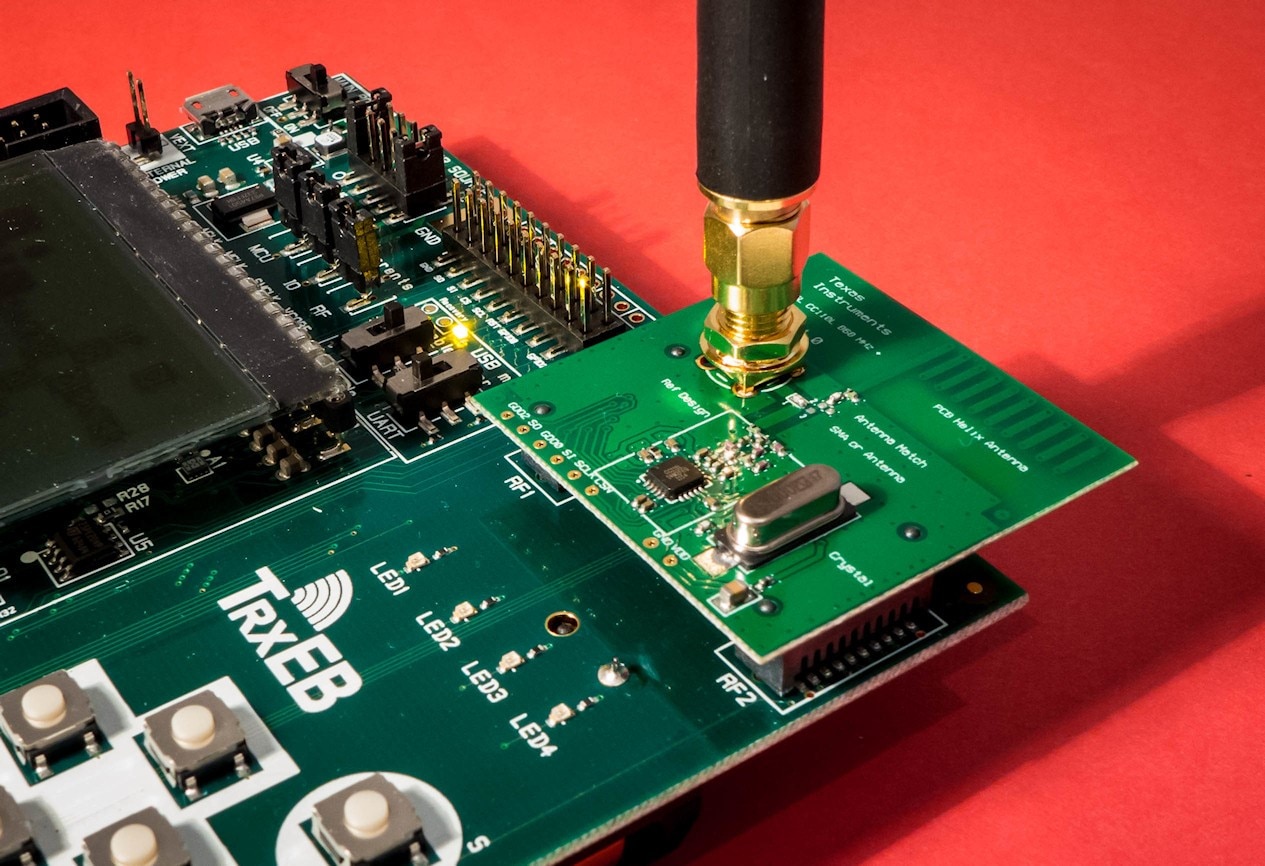
It also provides the opportunity to be able to test other antennas too, as shown in this photo:
The N9322C spectrum analyser provides modulation analysis capabilities, and FM modulation analysis and occupied bandwidth measurements were explored earlier however this time Frequency-Shift Keying (FSK) was explored since the Texas Instruments chips provide this capability.
Observing the Output
It proved possible to generate an eye diagram, nicely showing the frequency deviation and the clean output. As you may expect from the clean image, this is from a very high output (-10dBm).
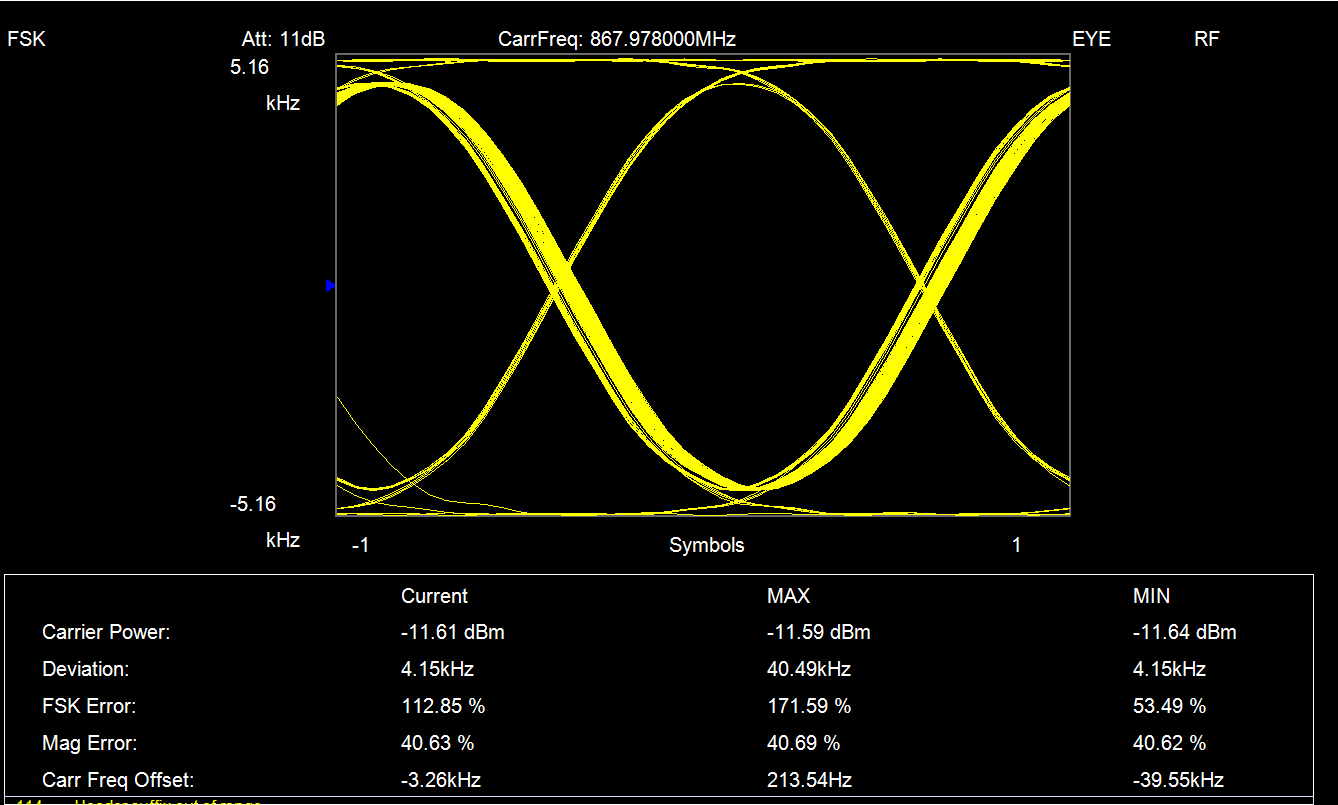
It is more interesting to progressively drop the input to a more realistic signal:
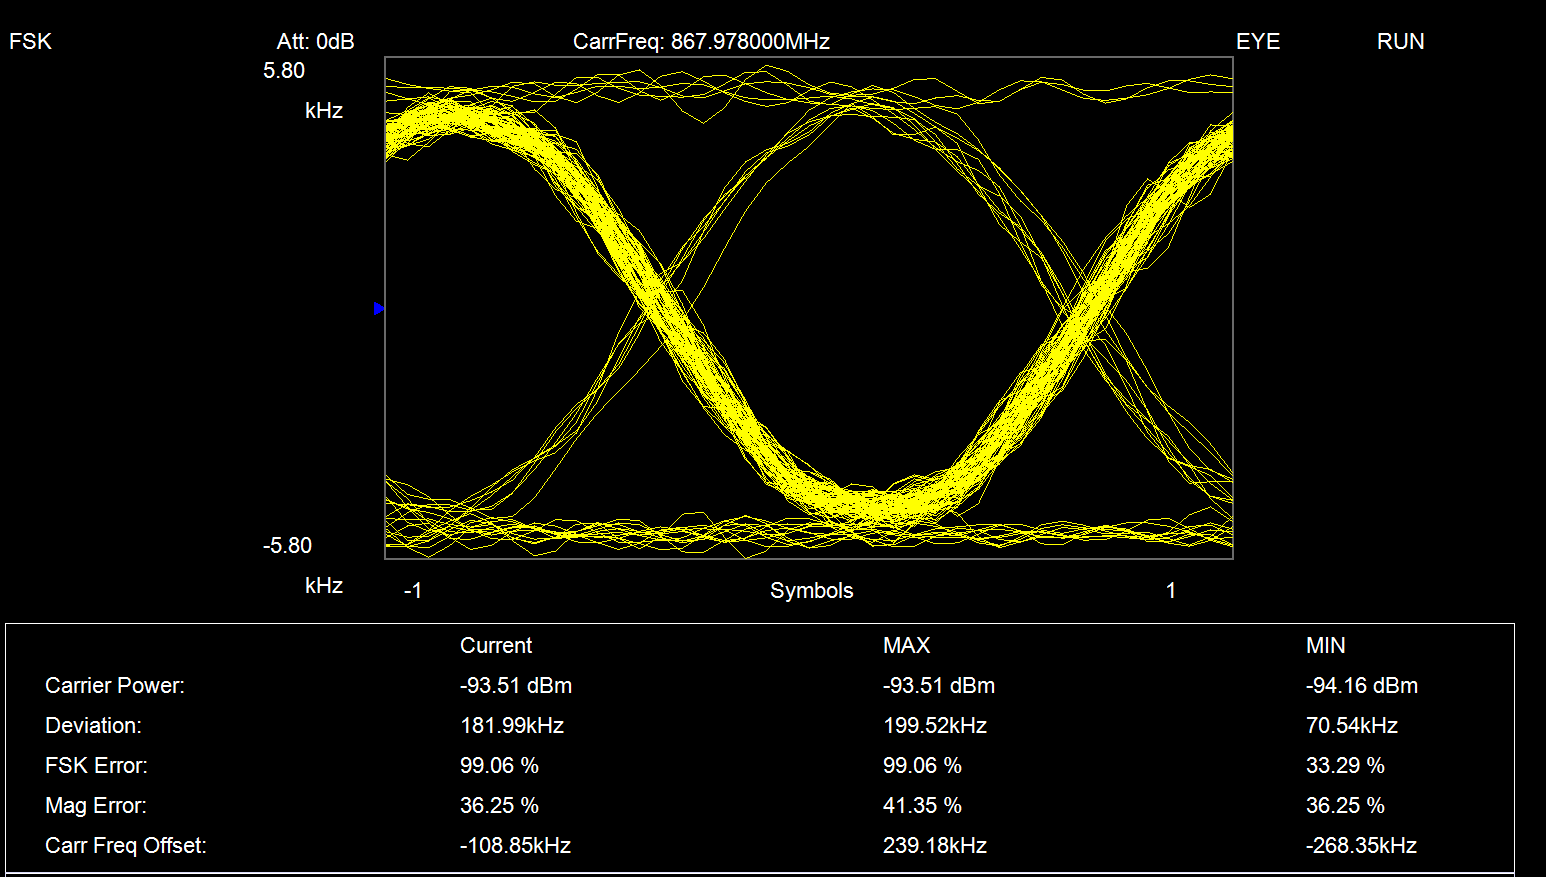
To perform the attenuation, see here for information. If you’re wondering why the eye diagram is eye-shaped across a radio transmission, it is because the TI CC11xL chips perform frequency transitions in-between the FSK frequencies. This is an option on the TI chips. If it is disabled, this is the result:

It’s also interesting to see the comparison in the spectrum view as shown below. Here you can see the raw FSK signal in blue, and the smoothed transition (also known as Gaussian FSK or GFSK) in yellow. GFSK clearly has far less spread than the usual frequency-shift keying.

Summary
This was just a quick look at the interesting spectrum shaping capabilities of the Texas Instruments chips. I’m extremely excited to have the opportunity to examine these devices in detail. I can see them easily being put to hundreds of uses, and so some time spent learning about them will prove extremely valuable for me and hopefully for others too. I know many people have already gained experience with these devices, and I hope others investigate them too. To do that, the full development kitfull development kit is the best way in my opinion (and is cost-effective for what you get – we have purchased many of them), but the BoosterPack BoosterPack / LaunchPad LaunchPad ensemble would be useful too, so you may want both.
Top Comments