


Table of Contents
Introduction
Due to customer requests, the MXO 4 now supports a fully log-log spectrum output display! I was keen to try it out. This ultra-short blog post shows some example screenshots! Or just check out the equally brief (4-minute) video:
What is it?
Most spectrum analyzers display the spectrum with a logarithmic vertical axis (indicating power, or occasionally amplitude), but the horizontal frequency axis is normally linear. While that’s fine for many use-cases, sometimes it is either highly desirable, or required, for that axis to be in log format. One ‘required’ example is for EMC pre-compliance testing.
Some ‘highly desirable’ examples involve audio testing. When examining frequency response, it can be quicker, and more intuitive, to be using a log axis. The MXO 4’s high resolution ADC and integrated high-resolution waveform generator makes it extremely attractive for audio work, and now the log-log spectrum further solidifies such use-cases.
What does it look like?
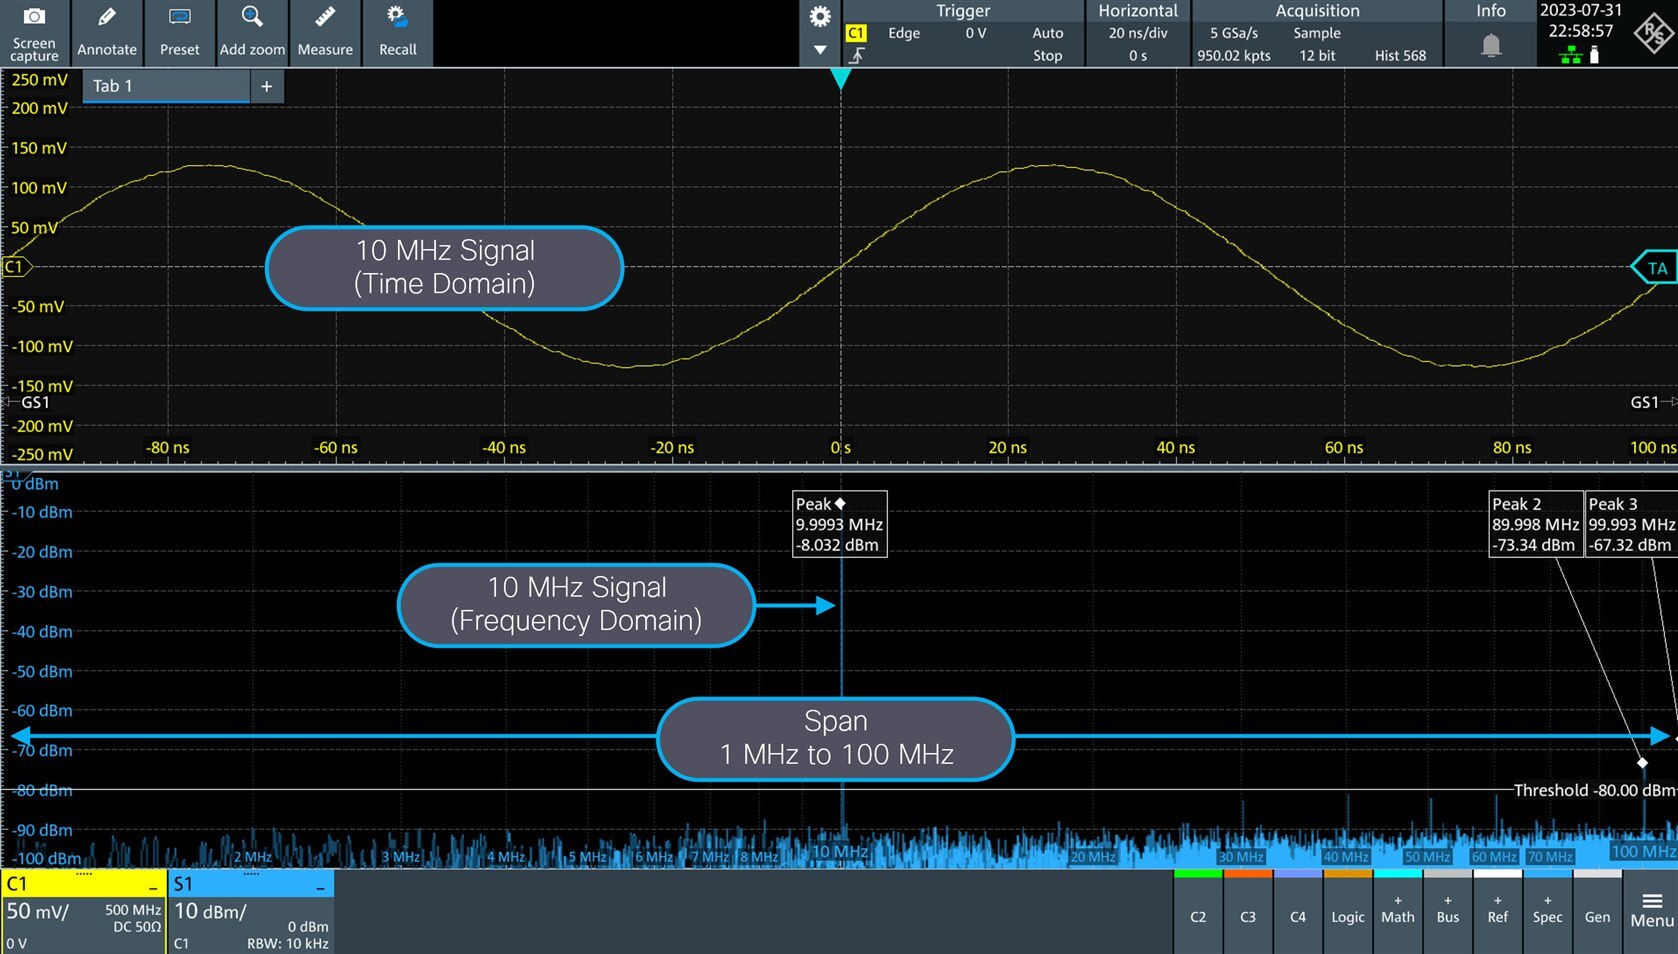
The screenshot below shows a 1-100 MHz span, and a 10 MHz signal of interest. Normally it would be squashed up on the left, but now it’s in the center. Often detail is squashed at the low frequency end of spectrum traces, but now all the low-frequency content is easier to visually resolve.
High frequency content is sometimes spaced too far apart for easy visualization, so again the log frequency feature comes to the rescue here.
EMC Pre-Compliance Testing
Check out the full written review, or the video review, for more detail. Now, the MXO 4 is getting to be great for this use-case. It still cannot perform limit lines, but there is a workaround; it is possible to graphically annotate lines and then save that as a configuration that can be recalled whenever particular EMC tests are needed.

Noise Measurements
Some output is way easier to recognize on a log axis. An example is pink noise, which should look like a straight line on such an axis. The noise incidentally was generated using the MXO 4’s in-built waveform generator.

Notch Filter
Here’s a use-case where not only would the signal of interest normally be squashed on the left side in a normal 20 Hz to 20 kHz span trace, but it would also be very hard to spot without spectrum analysis capabilities. The screenshot shows a low-level (just a few millivolts) 500 Hz tone in green. It goes into a DSP, and egresses as shown in the yellow trace. It is very low-level but clearly visible on the spectrum chart. The DSP happens to implement a notch filter, set to 480 Hz which is extremely close to the tone. The notch is extremely sharp, and therefore the signal passes with little attenuation. The video above shows the effect when the notch filter is tuned to precisely 500 Hz.
This is a scenario that would be impossible to see with most dedicated spectrum analyzer instruments, because of the extremely low frequency. The MXO 4 works great for audio applications, and the video shows that the output is still fast even at the 10 Hz resolution bandwidth that was used.

Band Pass Filter
I wanted to build a very sharp speech filter for 300 Hz to 3 kHz. Ordinarily such a filter could be partially tested with a frequency response analyzer (FRA), but out of curiosity I wanted to see if some of the testing could be speeded up with a frequency chirp that was not linearly changing with frequency, but logarithmically. MATLAB was used to create the waveform, and then it was stored into the MXO 4, for recalling whenever such audio testing is desired. It sweeps across 20 Hz to 20 kHz, in 6 seconds, and then repeats indefinitely.
From my perspective the screenshot below revealed a lot, and showed me the shortcomings with the filter. The video contains some more information.

Summary
I was really happy to see the Logarithmic Frequency Axis feature arrive in an MXO software update, since I was missing this on other test tools. The feature appears to work well and I’m keen to make a lot more use of it, in particular for some filtering projects for audio and RF purposes.
Thanks for reading/watching.
Top Comments