


Our last post discussed the difficulties in acquiring the many sensor signals that may be input to a deeply embedded system such as an IoT device as well as a hardware solution to the problem. Another aspect of IoT debugging and validation is the low-speed serial data standards used to facilitate communication between ICs and between controllers and peripheral devices (Figure 1). To that end, let's take a look at three such low-speed standards: I2C, SPI, and UART.
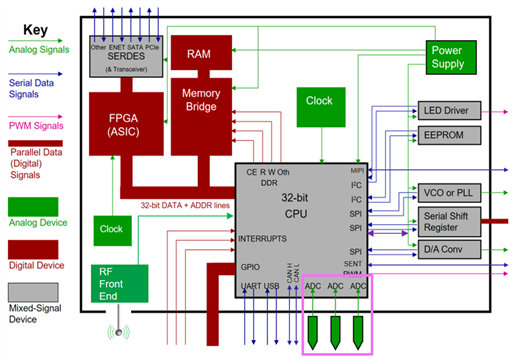
Figure 1: Serial-data links handle traffic between ICs and peripheral devices in the IoT world
Here are brief summaries of these three serial-data standards:
- I2C: The Inter-Integrated Circuit protocol serves short-distance communication between peripheral ICs and processors.
- SPI: Known as Serial Peripheral Interface, this standard is used for short-distance communication in embedded systems.
- UART: The Universal Asynchronous Receiver Transmitter protocol applies to device serial-port communication.
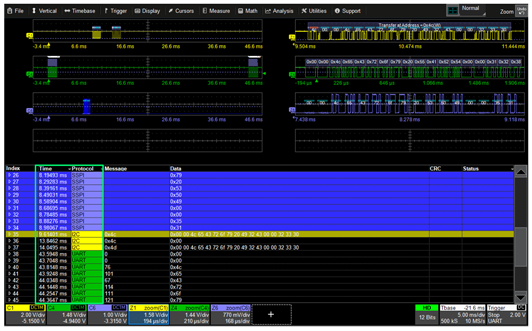
Figure 2: Shown are all three serial data standards captured simultaneously
Our generic IoT-device block diagram of Figure 1 implies that a given device might use all three of these serial data standards. In Figure 2, we see a screen capture of all three signals happening simultaneously. The table at lower left interleaves the messaging times, if there was a case in which there were a couple of UART messages with SPI and I2C messages interspersed, they're all stitched together in time within the table. The display shows the SPI messages highlighted in blue. The grids at upper left show the original acquisitions, while the grids at upper right show zoom traces of three messages.
In Teledyne LeCroy's setup dialog for decoding serial data streams, variables are clear and straightforward. For example, in the UART setup, it's a simple matter to set a given bit rate, number of bits, bit order, polarity, and other parameters.
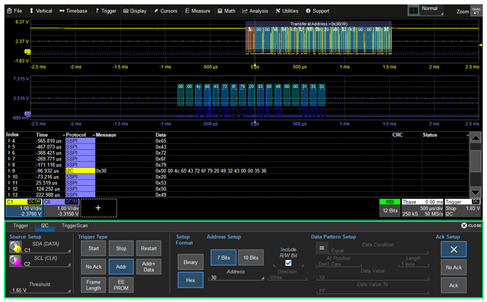
Figure 3: The dialog box at bottom makes it easy to set up for protocols
What can one acquire from a serial bit stream? Basically, anything of interest, as can be seen from Figure 3. In this example, the oscilloscope was set to trigger on I2C address 30. In the acquisition trace at top, note that the ID 30 is highlighted in red just to the left of the trigger point. The decode table at left shows the I2C message highlighted in yellow in the midst of a series of SPI messages. The ability to time-correlate these various bus events helps in determining cause-and-effect relationships between activities in different serial-data protocols.
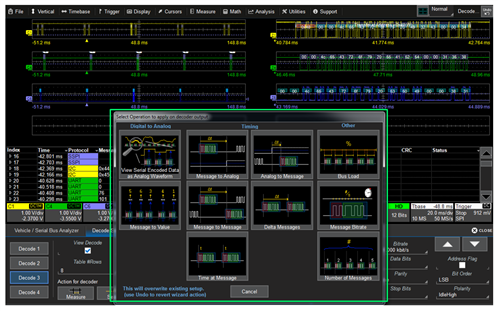
Figure 4: This snapshot shows a number of tools useful for serial-data debug
Figure 4 depicts a snapshot of bus-specific parameter measurements. At top left, serial-encoded data may be viewed as an analog waveform. In this fashion, transmitted digital data can be brought into the analog world and seen as a wave shape. An extremely useful tool is Message to Analog, with which you can measure timing between serial-data bursts and a control signal. The reverse, Analog to message, lets you measure the timing between when the control signal fires and when the serial-data burst happens. The Message to message tool can determine timing between, for example, messages on the SPI and UART buses.
The bus load percentage tool is valuable in deducing how much a given bus is utilized, or not utilized, by the system. Say, for instance, you're interested in seeing how often ID 46 appears on the I2C bus. It could be a sensor signal of interest, or it could be a certain message you're looking for. The tool lets you isolate that ID and perhaps learn that it's less than 1% of the bus traffic. Want to know how active the I2C bus is in general? Easy; just don't filter by any particular ID.
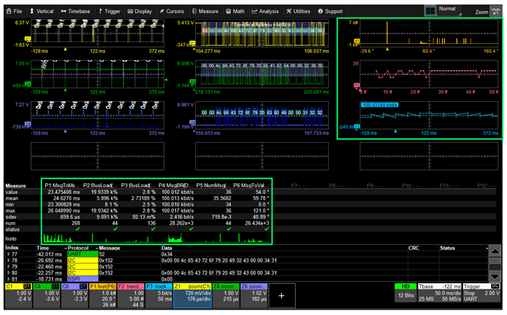
Figure 5: Statistical data reveals a great deal about bus activity
Equally valuable are the oscilloscope's statistical capabilities. The green-outlined area at lower left of Figure 5 shows us the statistical data on the various parameter measurements being made, and underneath each column of statistics is a histogram displaying the distribution of the measurement. The screen capture shows that over 28,000 measurements of message bit rate had been made. The histogram shows peaks in the distribution at the high and low ends, a nearly sinusoidal shape. This could indicate an issue that would merit investigation.
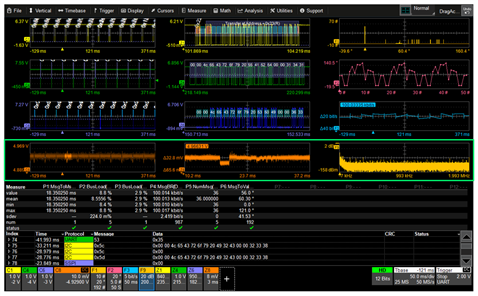
Figure 6: An FFT of the DC power rail helps unravel issues in the DC power level
Meanwhile, at top right are another histogram, a trend plot, and a track plot. Together these comprise a graphical representation of data on these bus measurements of our IoT device.
As we're conducting our investigation of the serial buses, we might also want to see what's going on with the DC power rails. Figure 6 adds those acquisitions in the green-outlined area. We can see little notches appearing in the orange waveform that should be a flat DC level. At right is a frequency-domain look at the same signal, where we can examine the frequency content of those notched areas.
Our next post will look at debug of CAN bus in IoT devices.
Previous blogs in this series:
IoT Digital Power Management and Power Integrity
Investigating IoT Wireless Signals