shabaz noticed that he got different noise figures when using an analog HAT on a Pi4 - in a road test (look for section Measurement HAT Noise Performance) and here. I originally used a power brick for a Lenovo laptop. But I now have an official Pi 4 power brick. I'm going to use FFT software I made to see if the noise floor differs, or if I see spikes.
later addition: a third test with a linear lab supply.
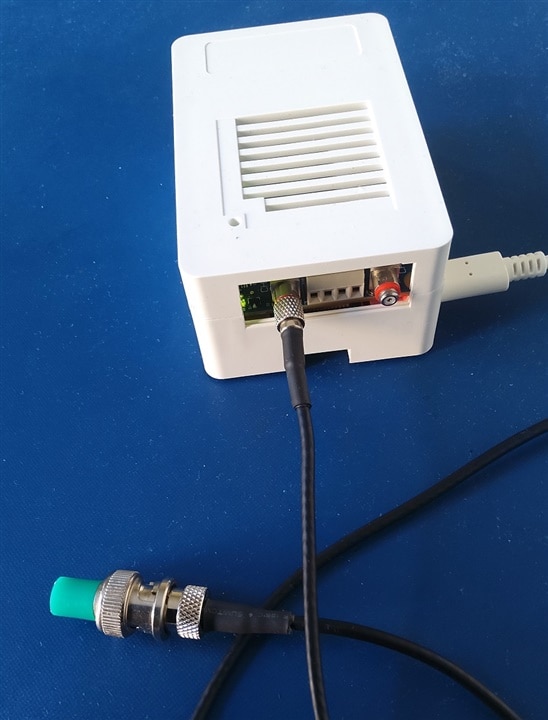
I'm using a MCC172 DAQ HAT, and have terminated the 50 Ohm input with a matching resistor. Let's see if I can spot differences.
The dynamic range of the DAQ channel is 5 Vpp AC
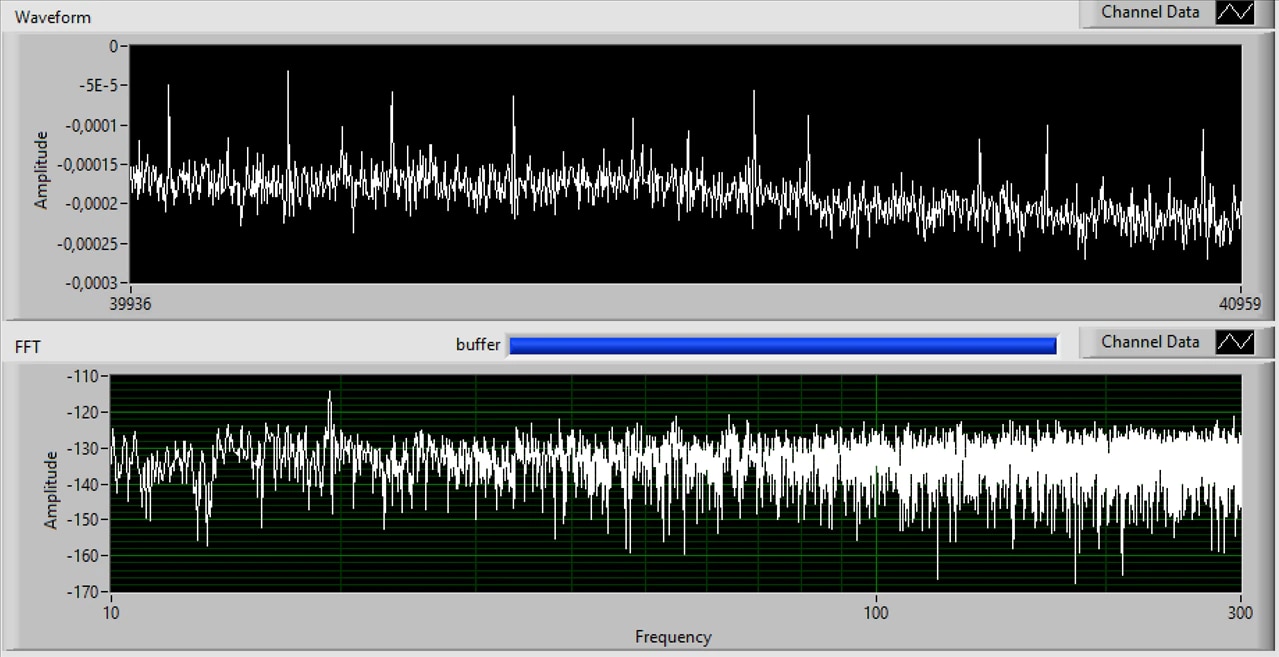
All FFTs below are based on 20480 samples, 1024 samples per second. The FFT shows the results of (20480 Sa / 1024 Sa/s) 20 seconds worth of data.
The waveform display just shows the 1024 samples of the last second (because I took the screen shots at the end of the collection cycle, the waveform display updates real time and it fits 1024 data points),
Waveform amplitude in V, X axis is sample count.
FFT amplitude in dB, X axis in Hz.
Test 1: with the official Pi 4 PSU
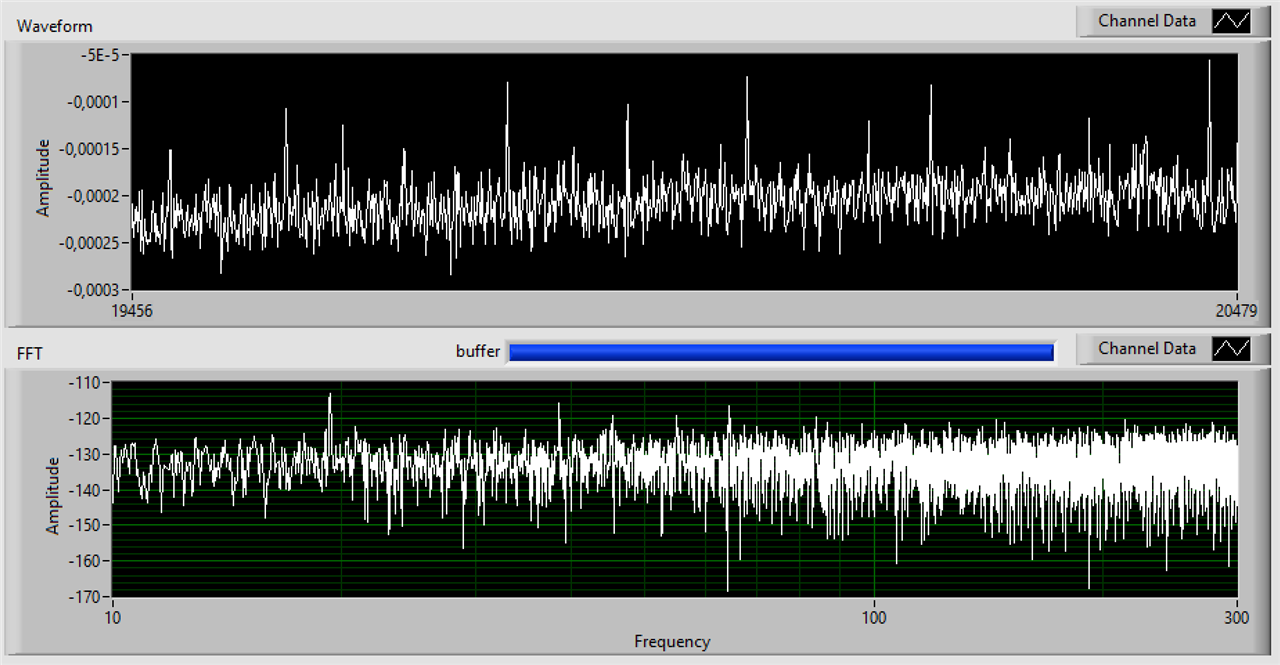
Test 2: with a Lenovo laptop brick
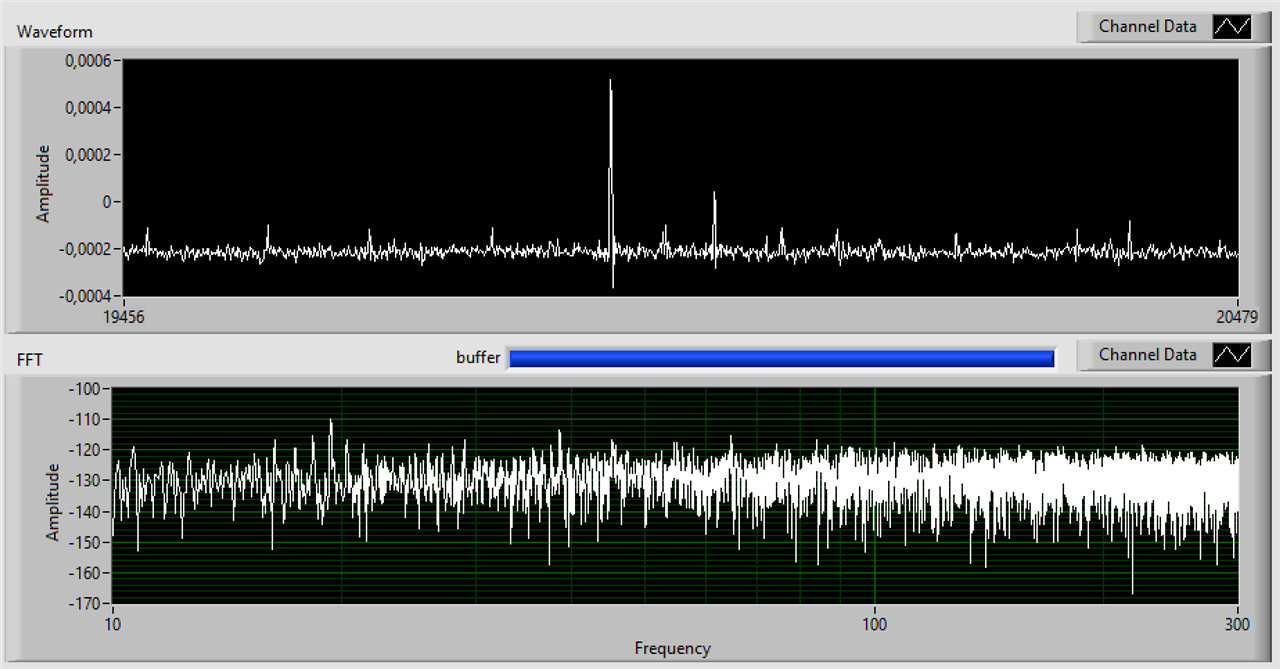
Test 3: with a Rigol linear lab power supply
Raw data analysis
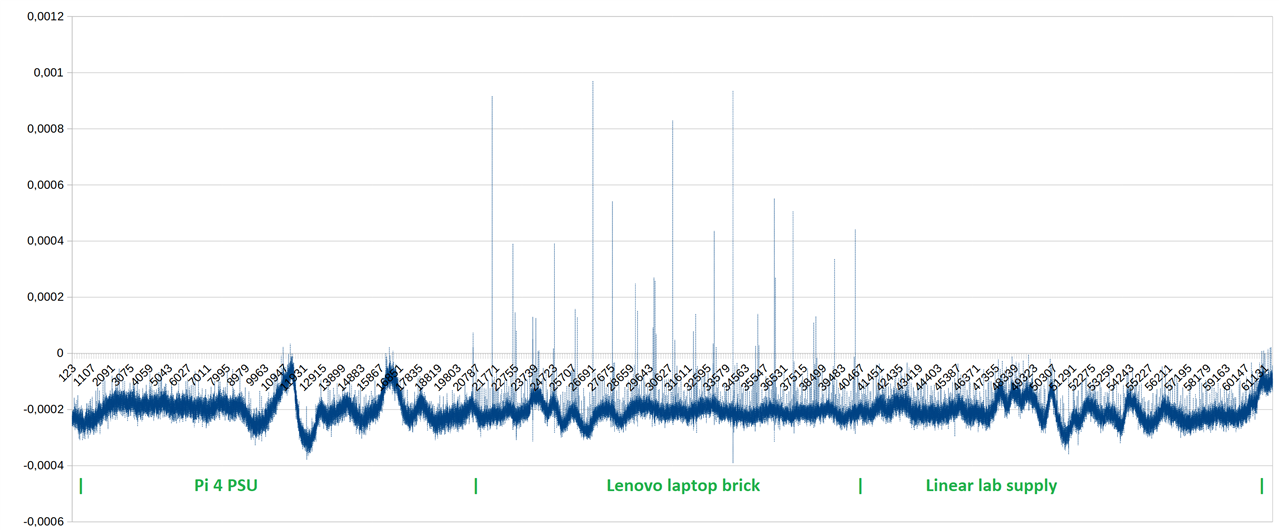
Here is the same test again, now logging the raw samples to a spreadsheet (and attach them to this post. You can then do your own analysis).
The X axis, just like on the LabVIEW captures above, are the sample counts. Delta between each sample is 1/1024 s.
Pi4 PSU:
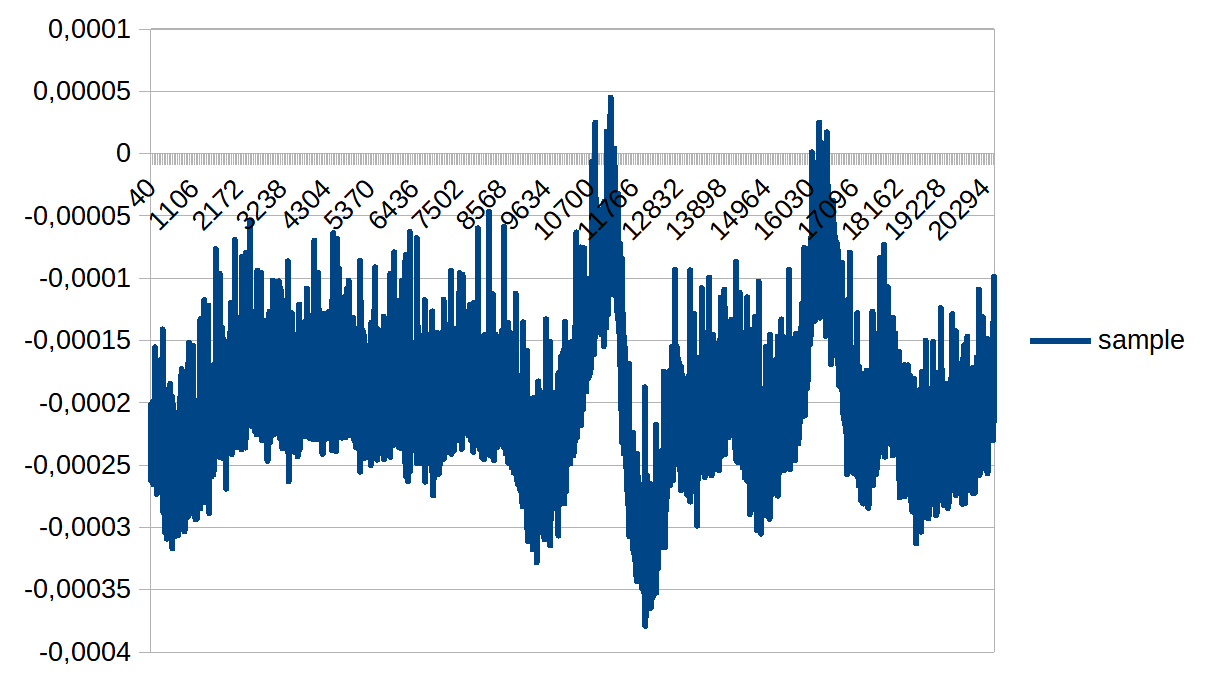
Lenovo brick:
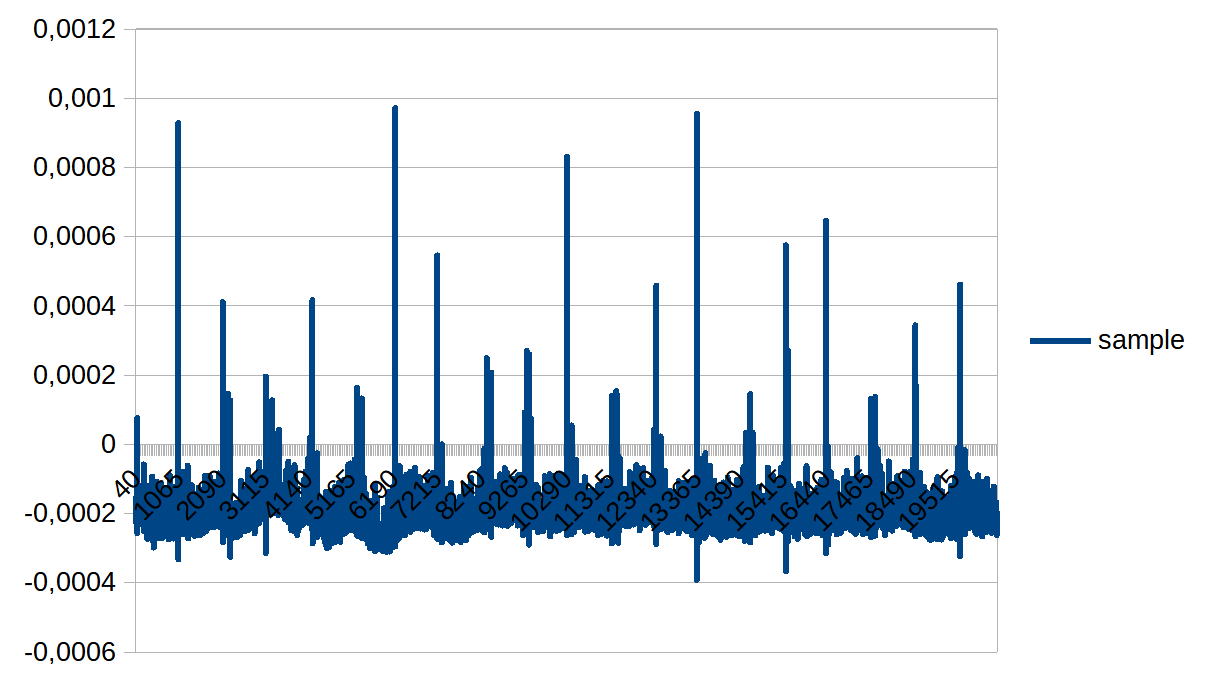
Linear PSU:
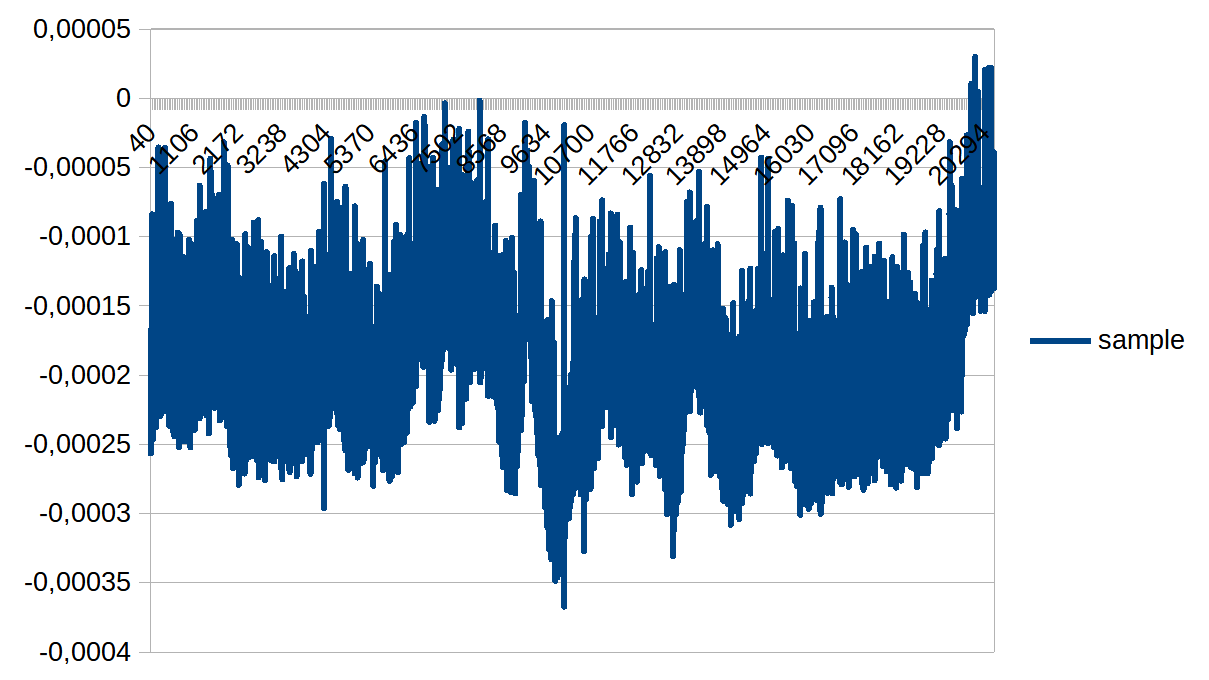
The 3 methods next to each other, on the same scale:
