Hi Folks! This is the last update on my Road Test of the Aim-TTi SMU4201 Source Measure Unit (SMU), before the final review.
In my previous blog post I started experimenting with the Aim-TTi SMU4201 source measure unit using automated experiments implemented in Python an Jupyter Lab. Now, we will continue that series with a couple of other experiments:
1. Li-Ion Battery Characterization
A Source Measure Unit (SMU) is capable of both sourcing and sinking current, while precisely measuring voltage and current. This make these instruments ideal for characterizing batteries. I was interested in characterizing Li- Batteries, which are often used in IoT applications.
To characterize a battery we basically need to charge and discharge the battery at various rates, while measuring the energy (voltage and current) the battery sinks and sources:
- in the Charging phase the SMU is configured as a Voltage Source, with the Voltage set to end voltage of the battery (ex. 4.2V for Li-Ion), while the Current limit is set to the maximum charging current we want
- in the Discharging phase the the SMU acts as an Electronic Load, sinking a programmed amount of energy (ex. current or power) from the battery
For this experiment I tried various batteries, but because of various reasons (like bad connections, dodgy connectors, dodgy batteries, coding bugs) the process ended up being more like a load testing of the Aim-TTi SMU4201. I have to say the SMU4201 held up well, no glitches or connection issues observed.
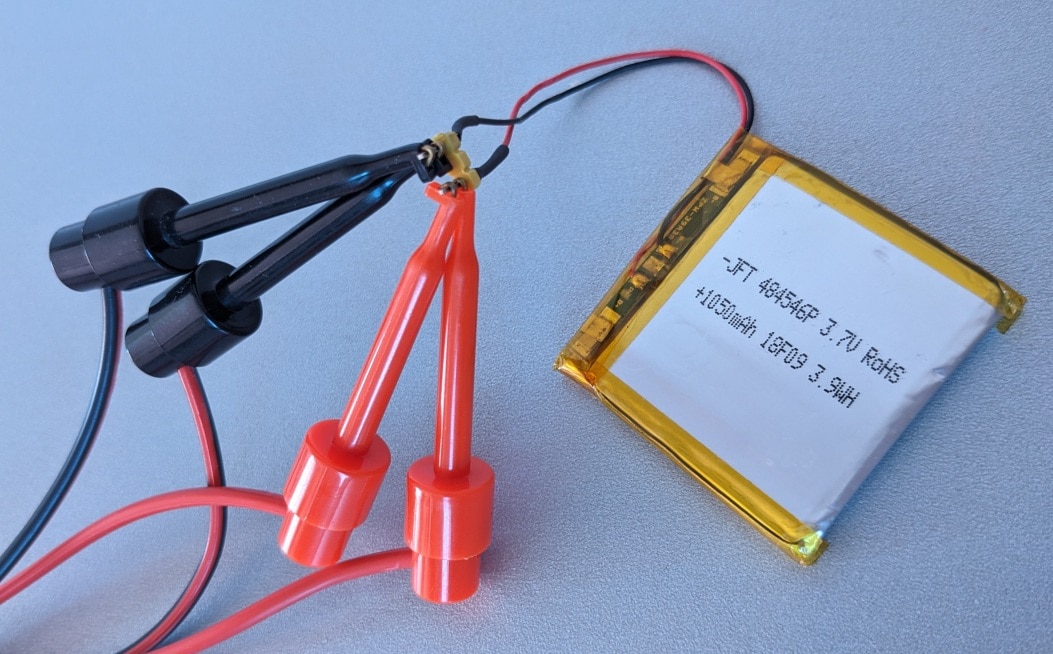
The battery I ended up using is a Li-Ion battery with a nominal capacity 1050 mAh, with its connector removed and replaced some pin headers:
In particular I was interested how the measured capacity of the battery changes with various discharge currents. To see this, I performed several charge and discharge cycles at various rates.
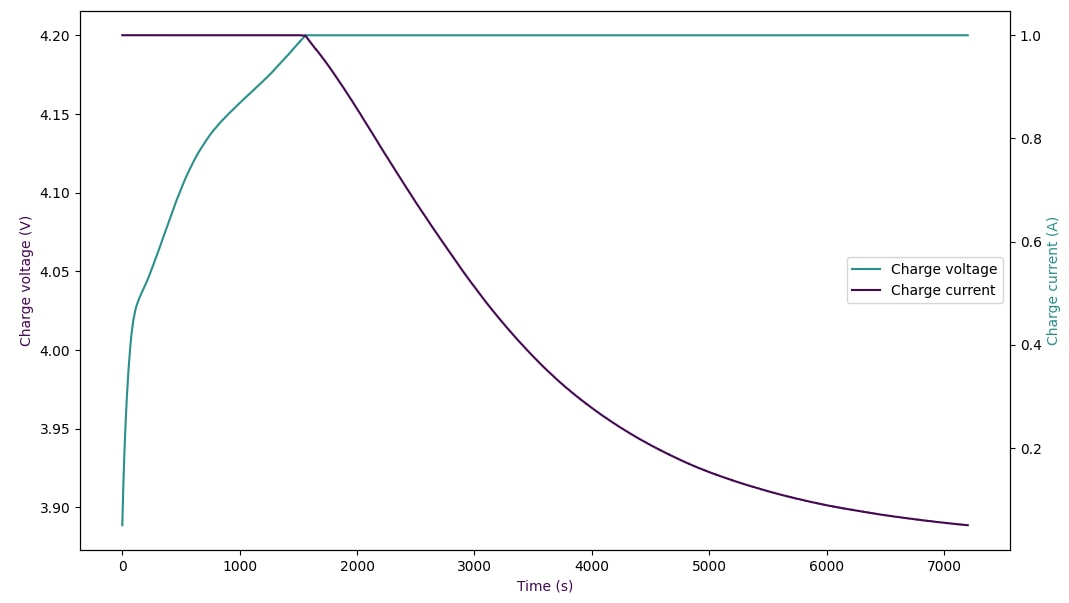
Charging a Li-Ion battery starts in a constant current mode an shows a rapid rise in voltage, then when battery is no longer able to sink the set current the constant voltage mode kicks in, and the battery is slowly charged to its full capacity. The bellow plot show this process with a charging current of 1A:
Discharging the battery is a bit more interesting. Depending on discharge current, the process starts with a relatively rapid voltage drop, after which at around ~3.7V the curve flattens out. At around ~3.4V the voltage starts to rapidly drop and it keeps drooping until we reach the end voltage (ex. 3V) of the battery.
I choose to run discharge cycles at 1 A, 500 mA and 250 mA:
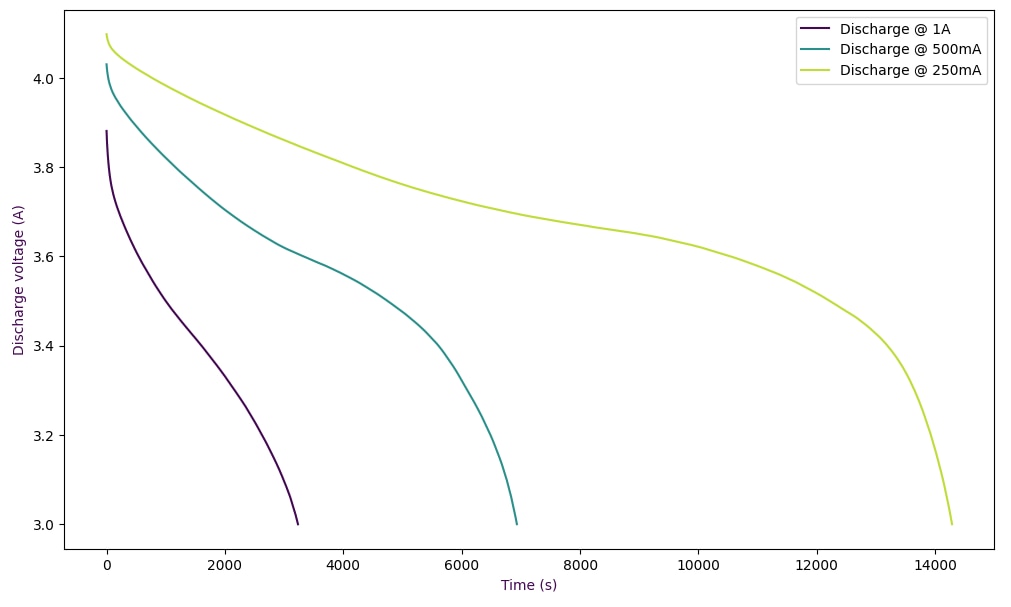
We can already see from the above graph that the discharge time is not perfectly proportional to the discharge current.
The collected dataset can also be used to calculate the measured capacity of the battery. There are two units we can use:
- milli-amper hours (mAh) - somewhat inaccurate, as takes into account just the discharge current and time
- watt hours (Wh) - measures real energy, as takes into account both voltage, current and time
The resulting capacity values were as follows:
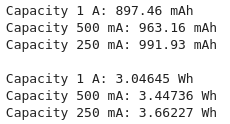
We can see that the measured capacity gradually decreases as the discharge current increases. Between the 250mA and 1A we can see a difference about 10%.
The Jupyter notebook with all the Li-Battery characterization code can be found in the Aim-TTi-SMU4201-Li-Battery-Characterization.ipynb gist.
2. MOSFET Characterization
MOSFET characterization is often refereed as a use case that requires 2 x SMU to do it. As Aim-TTi describe in their "Characterizing Transistors and Field Effect Transistors using two SMUs" application note, we basically needed the 2 x SMU-s connected one between the Drain and Source and one between Gate and Source:
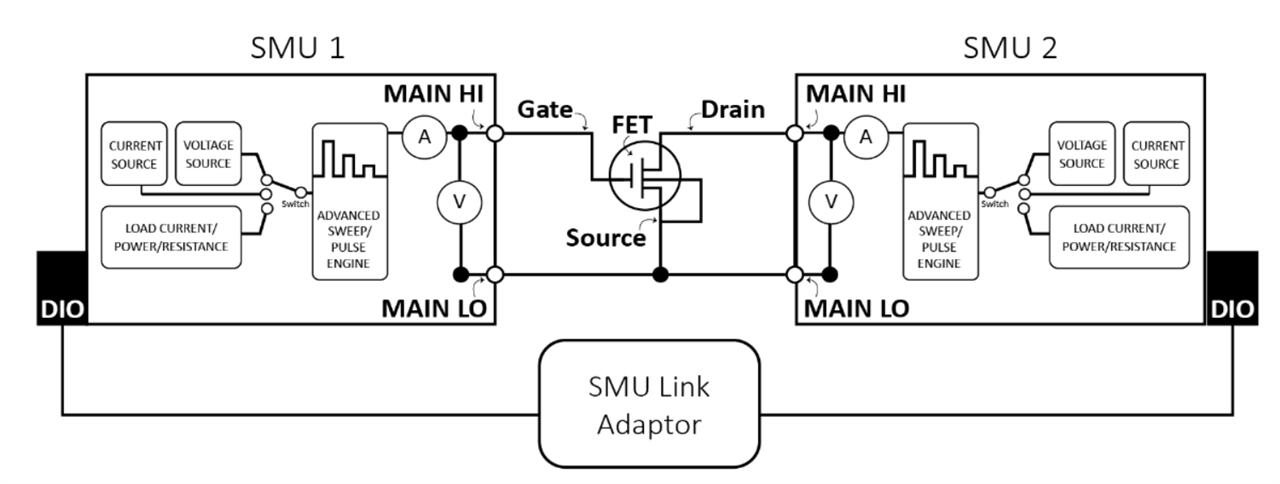
But, SMU-s are expensive instruments, so I was wondering if we could get away with just 1 x SMU. If we look at the datasheets of MOSFET-s we often find graphs with multiple plots of the same property for discrete values of the gate voltage. From this we can see that for certain types of measurements the resolution / accuracy of gate voltage is not that important, and we could probably get away using a power supply or even a micro-controller with a DAC.
To test this theory I connected the Aim-TTi SMU4201 and the Aim-TTi QPX750SP to a pretty generic N-channel MOSFET (IRF7103), as follows:

Both the SMU4201 and QPX750SP were controlled over the LAN.
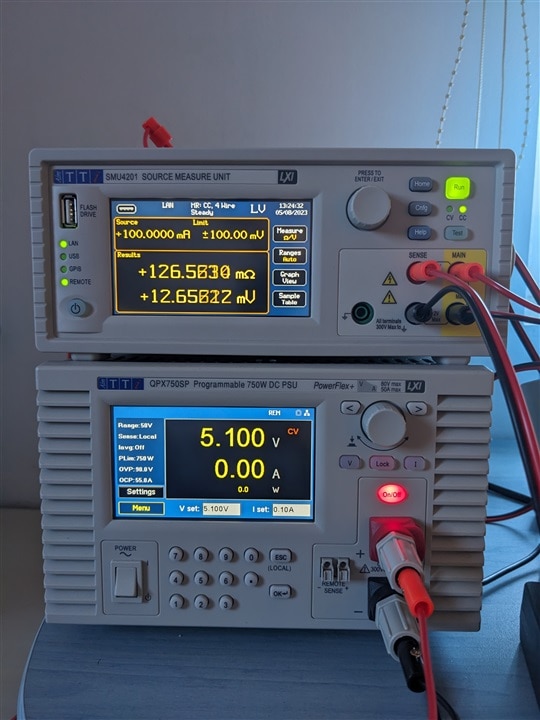
With this setup I wanted to plot the Drain-Source Resistance as a function of the Gate voltage. For this SMU4201 was set in Measure Resistance (MR) mode, while the QPX750SP was used to control the Gate voltage. I did a sweep from 0.1 to 15 V and I got this plot:
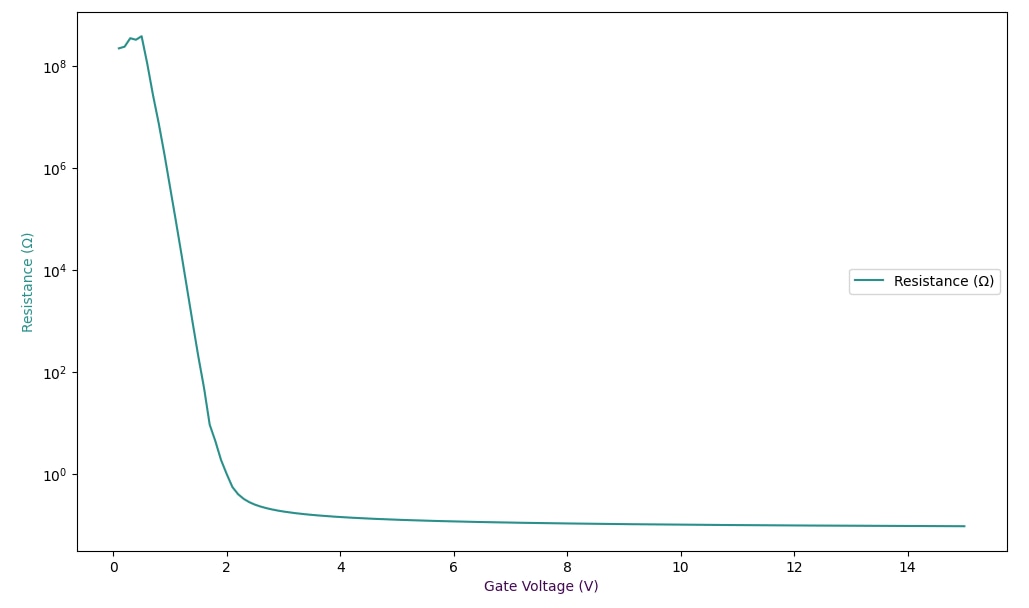
We can see that the MOSFET turns on a Gate voltage of about ~2V, and reaches its optimum Drain-Source resistance at around ~10V.
This experiment shows us that we can do some basic MOSFET characterization with only a single SMU and some other much cheaper instrument. For more advanced measurements and best accuracy we may still need two SMU-s, and probably an oscilloscope for high speed measurements.
The source code for the MOSFET characterization experiment can be found in the Aim-TTi-SMU4201-QPX750SP-MOSFET-Characterization.ipynb gist.
Next week, I will try to publish my final review of the Aim-TTi SMU, with comparison with competitors and hopefully some conclusion.
Have a nice day!


Top Comments