


This is part 1 of a series of 3 parts that I have planned for the Keysight InfiniiVision DSOX1102GDSOX1102G oscilloscope road test What I am planning to cover in this blog post product description unpacking and exploring the contents power-up and performing basic measurements
First I want to thank Element14 and Keysight for selecting me as one of the roadtesters for the InfiniiVision DSOX1102GDSOX1102G Oscilloscope I knew when the package comes from a delivery confirmation email and I was happy to find it on my porch I took the package inside the house:

Then I opened it,

and I explored the contents. Here is what I found inside: The oscilloscope, power cable, two probes packed together in a bag, a certificate of calibration, and various documents with useful information about this product.

One of the documents showed me where to go on-line and download the manuals for this oscilloscope. I took the document to the other room and I went to the Keysight web site address listed there. Here I found multiple documents available for download:
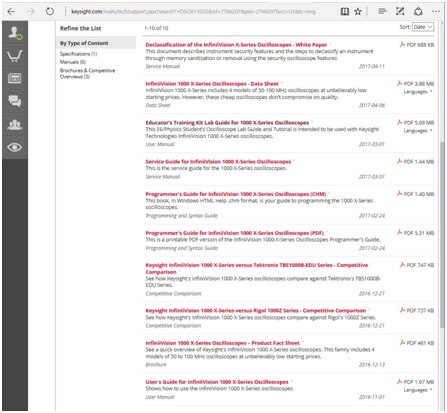
I personally liked the educator training lab and I find it very beneficial to students who get exposed for the first time to using an oscilloscope. I then went back to further explore the DSOX1102GDSOX1102G oscilloscope
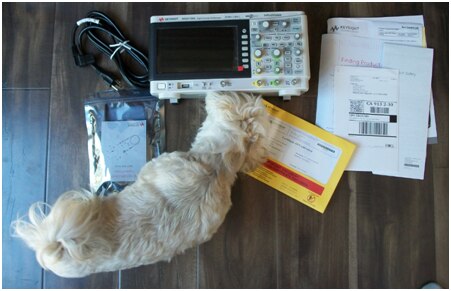
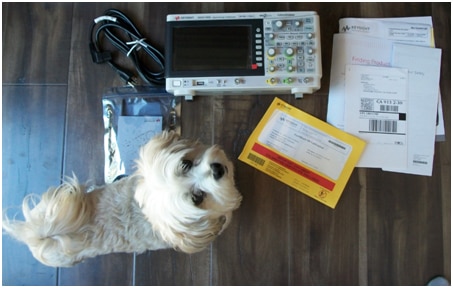
(my dog was also excited to explore this oscilloscope)
I connected the power cord and I pressed the power button. The oscilloscope started quite fast compared to other oscilloscopes that I worked with in the past. Here is a short video:
Next I opened the bag with probes:
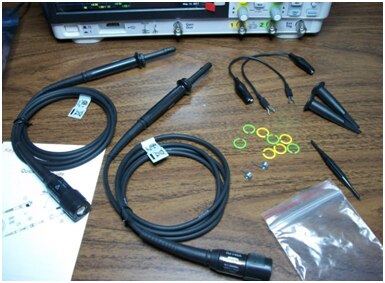
And I attached the color rings to each probe:
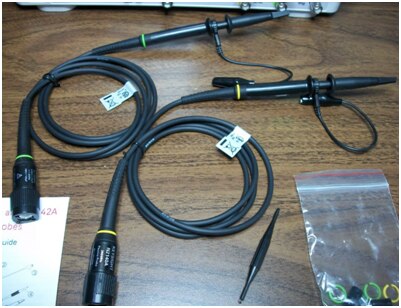
I then connected the probes to the oscilloscope and I calibrated the probe compensation using the small screwdriver included in the probes kit. The “yellow” probe was a bit undercompensated ; the “green” probe was just right. Here is a short video:
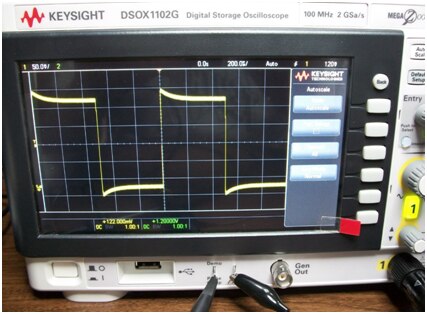
The probes may be undercompensated, like in this picture:
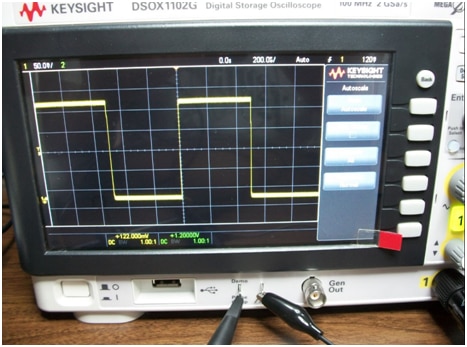
or overcompensated like in this other picture:
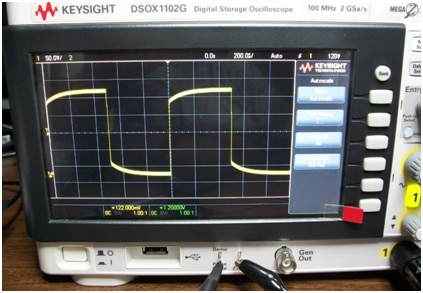
or they can be “just right” compensated like in this picture:
With this setup I then performed a few basic measurements of this waveform. First I set the trigger on rising edge of channel 1 (yellow):

and I setup the built-in measurement function to measure the peak-to-peak value:
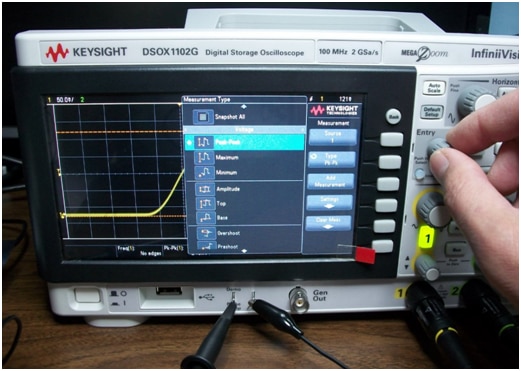
The knob labeled “Entry” highlights the measurement when rotated and selects it when pressed. Similarly I have selected to measure “Amplitude”, “Rise time”, and “Duty Cycle”. The four measurements are displayed at the bottom of the screen:
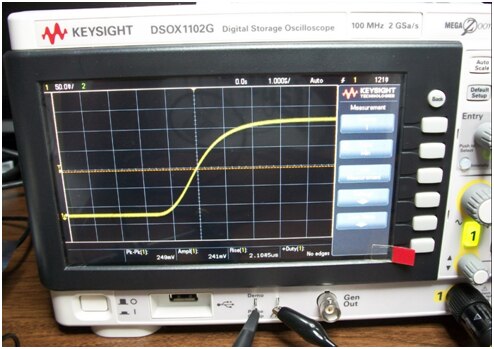
Notice that the duty cycle measurement displays “No edges”. This is because the displayed waveform represents only part of a period of the signal, so I had to adjust the time base to display multiple periods and thus to provide the needed information for the built-in duty cycle measurement:

Since this is an “entry level” type oscilloscope, which means that a lot of users may be just beginners in the electronics field, I will focus my review on “entry level” audience. For this reason, I will take a break here and explain briefly the meaning of the waveform that we see on the oscilloscope.
In a very simplistic way, an oscilloscope is an instrument that can be used to visualize how signals vary in time. The following figure shows the graphical representation of a square wave signal and the image of this signal as shown on the display of an oscilloscope:
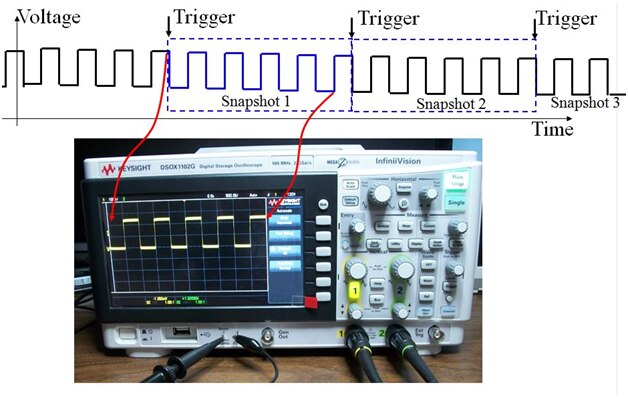
We can view the oscilloscope as an instrument that captures successive snapshots of the signal waveform and displays them one after another on the screen. The trigger function of the oscilloscope ensures that each snapshot starts at the same location within the signal period so the sequence of snapshots overlap perfectly in one single waveform. The time base function of the oscilloscope ensures that each snapshot has the same length in time, thus when sequentially displaying these snapshots the image is clear and stable.
Keysight DSOX1102GDSOX1102G oscilloscope has a crystal-clear and colored screen and offers very useful built-in functions besides the displaying signal waveform Some of these functions, like the automatic measurement of signal amplitude, frequency, rise and fall time, RMS value, mean value, duty cycle, pulse width, overshoot and undershoot, performed digitally rather than visually approximating them on the screen help me significantly in the design and troubleshooting of electronic circuits.
Here is an example of a sinusoidal signal displayed on the Keysight DSOX1102GDSOX1102G
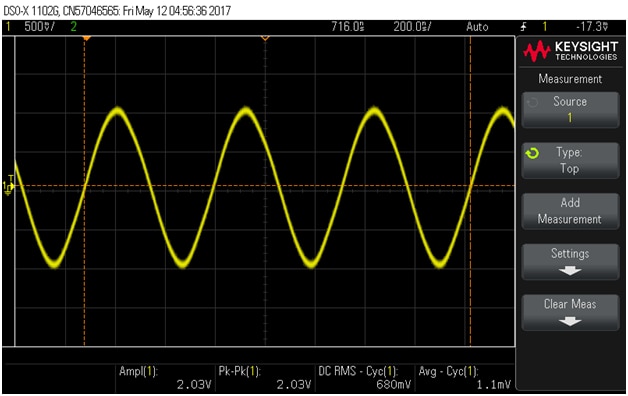
Here I used the save function of the DSOX1102GDSOX1102G oscilloscope which saves the measured waveform either as a picture(like in the case above but also it can save it as.csv file very useful for post processing and analysis of data in Microsoft Excel
The measurements at the bottom of the screen show the signal amplitude, the peak-to-peak magnitude of about 2V, the RMS voltage of 680mV, and the cycle average (which here is around 0V since the sinusoidal signal is centered on 0V) . The rms value for a sinusoidal signal of 1V amplitude (2V peak-to-peak) should be 0.707*1V = 707mV. The measured value on the DSOX1102GDSOX1102G screen is 680mV so I think the difference may come from the sinusoidal signal not being a perfect sinusoidal signal The RMS(root mean square voltage is what we measure with multimeters when we probe time varying signals Not all oscilloscopes have built-in measurement for RMS voltage, so in many cases we need to use a digital multimeter (DMM) to measure the RMS value; however, DMMs are usually limited in bandwidth so they do not measure accurately the RMS value of high frequency signals. I like this DSOX1102GDSOX1102G oscilloscope since all the built-in measurements work up to the full bandwidth of the oscilloscope
So what is the physical meaning of the RMS value of a time varying signal?
A DMM measures the rms value of a sinusoidal signal, which is equal to the peak voltage multiplied by 0.707.
Here is a clarification for the "rms" (Vpeak*0.707) and also the "average" (Vpeak * 0.636) values of a sinusoidal waveform:
The factors 0.707 and 0.636 result from the following analysis:
0.707 comes from the rms voltage definition. V_rms, is a constant (DC) voltage that produces the same average power dissipation on a resistor as the sinusoidal voltage V_max*sin(ω*t). The power dissipation P = V*I = V^2 / R . So for V_rms, which remember is a DC voltage, it’s easy: P_avg = V_rms^2 / R; however, for a sinusoidal voltage P_avg = ( V_max*sin(ω*t) )^2 / R = [V_max^2 * (sin(ω*t))^2] / R . Since these two average powers have to be equal, it results that: V_rms^2 = V_max^2 * (sin(ω*t))^2. The sinusoidal term is an average over many periods of a sin square function, which from trigonometry or from an intuitive graphic (similar to a sinusoid but shifted up and varying between 0 and 1) has the value of 0.5. Inserting 0.5 in the above equation V_rms^2 = V_max^2 * 0.5, and taking square roots on both sides V_rms = V_max * squareroot(0.5) = V_max * 0.707
0.636 comes form calculating the time average of voltage (not power like in the rms case above) for one half cycle. By integrating the sinusoidal voltage over half of period we obtain V_max * (2/pi) = V_max * (2/3.14) =V_max * 0.636
This concludes the first part of my road test evaluation of the Keysight InfiniiVision DSOX1102GDSOX1102G oscilloscope I will come back with new results as soon as I complete more evaluation work.
Best Wishes to Everyone,
Cosmin
Top Comments