element14 Community
element14 Community
    Register Log In
  • Site
  • Search
  • Log In Register
  • Community Hub
    Community Hub
    • What's New on element14
    • Feedback and Support
    • Benefits of Membership
    • Personal Blogs
    • Members Area
    • Achievement Levels
  • Learn
    Learn
    • Ask an Expert
    • eBooks
    • element14 presents
    • Learning Center
    • Tech Spotlight
    • STEM Academy
    • Webinars, Training and Events
    • Learning Groups
  • Technologies
    Technologies
    • 3D Printing
    • FPGA
    • Industrial Automation
    • Internet of Things
    • Power & Energy
    • Sensors
    • Technology Groups
  • Challenges & Projects
    Challenges & Projects
    • Design Challenges
    • element14 presents Projects
    • Project14
    • Arduino Projects
    • Raspberry Pi Projects
    • Project Groups
  • Products
    Products
    • Arduino
    • Avnet Boards Community
    • Dev Tools
    • Manufacturers
    • Multicomp Pro
    • Product Groups
    • Raspberry Pi
    • RoadTests & Reviews
  • Store
    Store
    • Visit Your Store
    • Choose another store...
      • Europe
      •  Austria (German)
      •  Belgium (Dutch, French)
      •  Bulgaria (Bulgarian)
      •  Czech Republic (Czech)
      •  Denmark (Danish)
      •  Estonia (Estonian)
      •  Finland (Finnish)
      •  France (French)
      •  Germany (German)
      •  Hungary (Hungarian)
      •  Ireland
      •  Israel
      •  Italy (Italian)
      •  Latvia (Latvian)
      •  
      •  Lithuania (Lithuanian)
      •  Netherlands (Dutch)
      •  Norway (Norwegian)
      •  Poland (Polish)
      •  Portugal (Portuguese)
      •  Romania (Romanian)
      •  Russia (Russian)
      •  Slovakia (Slovak)
      •  Slovenia (Slovenian)
      •  Spain (Spanish)
      •  Sweden (Swedish)
      •  Switzerland(German, French)
      •  Turkey (Turkish)
      •  United Kingdom
      • Asia Pacific
      •  Australia
      •  China
      •  Hong Kong
      •  India
      •  Korea (Korean)
      •  Malaysia
      •  New Zealand
      •  Philippines
      •  Singapore
      •  Taiwan
      •  Thailand (Thai)
      • Americas
      •  Brazil (Portuguese)
      •  Canada
      •  Mexico (Spanish)
      •  United States
      Can't find the country/region you're looking for? Visit our export site or find a local distributor.
  • Translate
  • Profile
  • Settings
RoadTests & Reviews
  • Products
  • More
RoadTests & Reviews
Blog TI SWIFT™︎ Power Module EVM RoadTest: Module Review and Test Setup
  • Blog
  • RoadTest Forum
  • Documents
  • RoadTests
  • Reviews
  • Polls
  • Files
  • Members
  • Mentions
  • Sub-Groups
  • Tags
  • More
  • Cancel
  • New
Join RoadTests & Reviews to participate - click to join for free!
  • Share
  • More
  • Cancel
  • Author Author: Jan Cumps
  • Date Created: 2 Mar 2018 2:32 PM Date Created
  • Views 2950 views
  • Likes 7 likes
  • Comments 20 comments
Related
Recommended
  • RoadTest
  • switching_controller
  • smps
  • dc dc converters
  • power electronics
  • ti_rt

TI SWIFT™︎ Power Module EVM RoadTest: Module Review and Test Setup

Jan Cumps
Jan Cumps
2 Mar 2018

I'm reviewing a single component DC converter for the TI SWIFTTm Power Module EVM RoadTest.

This article is a review of the switching device and the test setup.


Feel free to comment with the tests you'd like to see done with the module.

image


The Switching Device TPSM84A21


The TPSM84A21TPSM84A21 is a hybrid DC to DC Buck converter. All electronics to make it switch are in the package. It doesn't require external inductors or capacitors to work.

In the simplest setup, no other component is needed. The unit will then switch 8 - 14 V DC to 0.508 V. Maximum current of the output is 10 A.

image


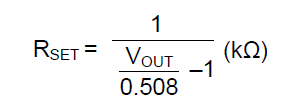
When you want to set the output to another value between 0.508 V to 1.35 V,  the only external component is a voltage selector resistor (RSET).

This component is not involved in power conversion and can be a low power small one.

image

For ripple reduction, the module has input and output capacitors on board.

If your application is OK with the ripple figures of the device (documented in the datasheet), you don't need external capacitors.

If you need better filtering, you can add input and output capacitors. Guidelines are in that datasheet.

image


The device has additional functionality such as Power Good, under-voltage lockout and a possibility to externally synchronise the 4 MHz switching frequency.

Check this functional block diagram for the possibilities.

image


The Evaluation Module


As expected with hybrid componenst, there's not much more on the evaluation board than the  TPSM84A21TPSM84A21.

The only passives are a set of resistors to select different outputs, and to test the device enable, current limit, sync and power good.


image

The board gives you good access to all the interesting measure points. It also has footprints for additional capacitors if you want to test such a setup.

For the input and output rails, there are test points very close to the device. They are intended to be probed with an oscilloscope probe with ground spring.

This doesn't work that well with the probes of the Tektronix and Rigol scopes I have.

Their pins are thinker and the distance between center pin and ground spring wider than what the measure point on the PCB takes.

All other test points are solder-on loops that allow easy access with meter test leads or oscilloscope probes.


image

There's an empty footprint for a coax connector to sync the switcher's clock externally.


Test Setup


The EVM is connected to an electronic load that draw a current of up to 7.5 A. It can log the current and voltage measured.

The load is connected to the EVM with short thick wires. With these low voltages and high currents, resistance of the wire matters.

I'm using a linear power supply that can deliver more than enough power to feed the EVM at maximum load.

image

For measuring, I have a few DMMs and a 4 channel oscilloscope.


The PSU, load and oscilloscope are programmable. I can measure and log info in scenarios where the input voltage and output loads change over time.

Things I can automatically log:

  • Current at EVM input and output
  • Voltage at the EVM output
  • Any 4 points that I probe with the scope.


Let me know in the comments below if you're interested in particular load operating conditions o the EVM.

I will try the ones that I can perform with the above setup without damaging one of the components.


Edit: requests received:

  • image. efficiency compare to spec and Frank's review
  • image.  noise specification
  • automate efficiency measurement for input and load ranges
  • transient check


Related blog
TI SWIFTTm Power Module EVM RoadTest: Module Review and Test Setup
TI SWIFTTm Power Module EVM RoadTest: Noise Measurements
TI SWIFTTm Power Module EVM RoadTest: Efficiency
  • Sign in to reply

Top Comments

  • fmilburn
    fmilburn over 7 years ago +4
    Hi Jan, It is nice to see your electronic load in action. I will be interested to see how well my efficiency measurements match yours. I am also interested in seeing how the TI transient response curves…
  • Jan Cumps
    Jan Cumps over 7 years ago +4
    Temperature after running 4 hours at 0.6 V 7.5 A, with a 14 V input: 42.5° C
  • Jan Cumps
    Jan Cumps over 7 years ago in reply to fmilburn +4
    He Frank, I'll do the efficiency measurements and compare. I'd be surprised if they'd differ significantly. For the transients, I don't know (yet) if I'm well equipped. jc2048 hes profiled the transient…
  • Jan Cumps
    Jan Cumps over 7 years ago in reply to jc2048

    It takes a while to do this, because I put 2 second pauses between setting and measuring - for stability and because there's a gap of 1 second between sample and availability of data in the load.

    But everything is automatic, yes, from initialising the two instruments to the ramp for input voltage and output loads, and the logging into a spreadsheet. 900-ish measurements.

    The calculation of the efficiency and the graphs were done by me..

    I've also noticed the irregularities around 2.3 A load and the behaviour at the end of the curve. I have to spend some quality time to work on the calibrations. Nowhere near a reasonable precision at this point.
    Stability is good, but set and measure aren't anywhere near the precision I want them to be.


    For the higher currents, the resulting dissipation may be giving your load some measurement problems. One way to find out would be to give it a 'cool off' period between readings and see if the resulting curves diverged from these. (Just a thought, if you wanted to experiment further and had the time.)


    No, it's consistent. It always shows this poor behaviour at that range.


    I'm getting to like the idea of SCPI. Perhaps we should have a SCPI Project 14 contest and invite people to SCPI-fy an item of non-automated test gear.


    The library I'm using also works on a BeagleBoard (I tested that) and I'm sure it 'll work on a Raspberry Pi too.

    I've also made some devices with that lib on the Hercules family of microcontrollers.

    With some optimisations it even runs on an Arduino UNO.

    • Cancel
    • Vote Up +1 Vote Down
    • Sign in to reply
    • More
    • Cancel
  • jc2048
    jc2048 over 7 years ago in reply to Jan Cumps

    Wow! Presumably you just set it going and it did the rest for you.


    How long does it take to work through them?


    Where did the odd wrong readings come from (they are curiously similar in form)? Is that something not settling quickly enough?


    For the higher currents, the resulting dissipation may be giving your load some measurement problems. One way to find out would be to give it a 'cool off' period between readings and see if the resulting curves diverged from these. (Just a thought, if you wanted to experiment further and had the time.)


    I'm getting to like the idea of SCPI. Perhaps we should have a SCPI Project 14 contest and invite people to SCPI-fy an item of non-automated test gear.

    • Cancel
    • Vote Up +2 Vote Down
    • Sign in to reply
    • More
    • Cancel
  • Jan Cumps
    Jan Cumps over 7 years ago in reply to Jan Cumps

    Graph of efficiency with output set to 0.6 V, input between 8 and 13.5 v


    image

    • Cancel
    • Vote Up +2 Vote Down
    • Sign in to reply
    • More
    • Cancel
  • Jan Cumps
    Jan Cumps over 7 years ago in reply to Jan Cumps

    Graph of efficiency with 8 V input, as logged by LabVIEW automated run.

    image

    Not calibrated, but close to usable.

    • Cancel
    • Vote Up +1 Vote Down
    • Sign in to reply
    • More
    • Cancel
  • Jan Cumps
    Jan Cumps over 7 years ago in reply to Jan Cumps

    image

    I've made a test run with spreadsheet write. Not all info is in there. I'm missing enough info to calculate efficiency but want to give it a go.

    Here are the doing a run from 8 to 12 V, stopped at 10 V:


    Here's a snippet (yellow is manual manipulation done by me):

    image

    • Cancel
    • Vote Up +1 Vote Down
    • Sign in to reply
    • More
    • Cancel
>
element14 Community

element14 is the first online community specifically for engineers. Connect with your peers and get expert answers to your questions.

  • Members
  • Learn
  • Technologies
  • Challenges & Projects
  • Products
  • Store
  • About Us
  • Feedback & Support
  • FAQs
  • Terms of Use
  • Privacy Policy
  • Legal and Copyright Notices
  • Sitemap
  • Cookies

An Avnet Company © 2025 Premier Farnell Limited. All Rights Reserved.

Premier Farnell Ltd, registered in England and Wales (no 00876412), registered office: Farnell House, Forge Lane, Leeds LS12 2NE.

ICP 备案号 10220084.

Follow element14

  • X
  • Facebook
  • linkedin
  • YouTube