


Peter, Jon and I are building a Programmable Electronic Load. In this post I use LabVIEW to automate the measurements on the load itself. I'm buitlding an automated test setup to characterise its behaviour
The process tests the load for a range of voltages and currents, and measures some points of interest. The results are logged to a spreadsheet. |
Characterising an instrument requires lots of measurements. You put it in many conditions and then measure the behaviour.
This exercise lends itself to automation. And that's what I'm doing here.
I tell the instrument to draw a wide set of currents from a PSU. At the same time, I set the PSU to different voltages.
I then use the on-board ADCs of the load to measure voltages at key locations.
Test Setup
The core of the test setup is the electronic load. That's the device under test.
A programmable power supply is used as the source for the load.
A programmable oscilloscope is (not yet) used to measure some additional circuit points.
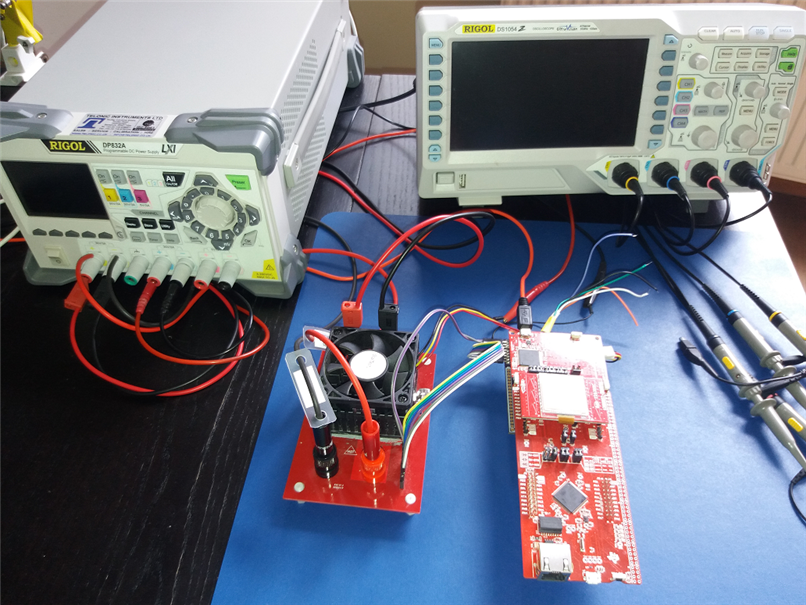
All devices are linked to my laptop via USB. The laptop runs LabVIEW to controll all devices in the setup.
Test Conditions: Voltage Loop and Current Loop
Our goal is to measure the load when it's pulling current from the PSU, under a wide range of conditions.
The conditions that are variable here are:
- the voltage of the PSU - we want to test the load for a wide range of input voltages.
- the current the load draws from that same PSU. Again we aim for an as wide as possible range.
The test flow is made of two embedded loops:
- an outer loop that sweeps the power supply through a range of voltages. It tells the PSU what output voltage it has to supply.
- an inner loop that runs once for each outer loop step. It tells the load to sweep through a range of currents it has to pull from the supply.
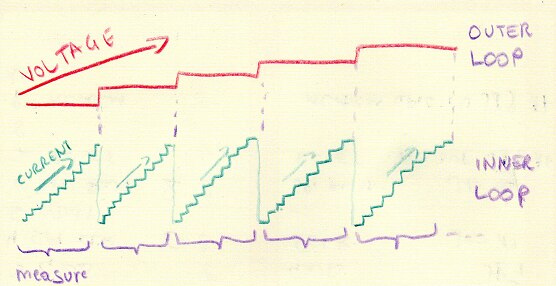
In that inner loop, after giving the circuit time to stabilise - and after giving the load the time to sample all ADCs, we retrieve measurements.
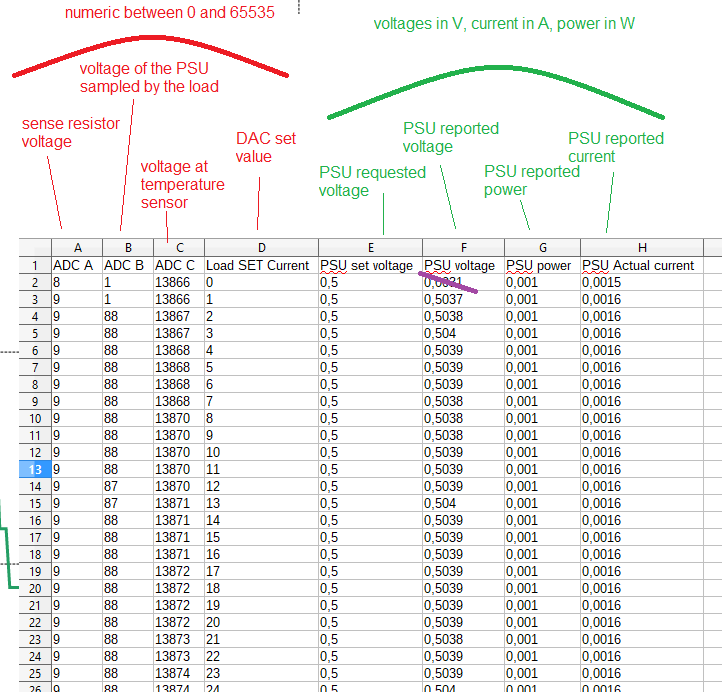
From the load, we retrieve (all in pure ADC units, the numerical representation of the sampled value, between 0 and 65535):
- the sampled load current. This is ADC A. That ADC samples the voltage over the load's current sense register.
- the voltage from the PSU. This is ADC B. It samples, in my setup, directly at the connectors of the PSU.
- the temperature of the power MOSFET. This is ADC C. It measures the voltage over the NTC that's placed next to that transistor.
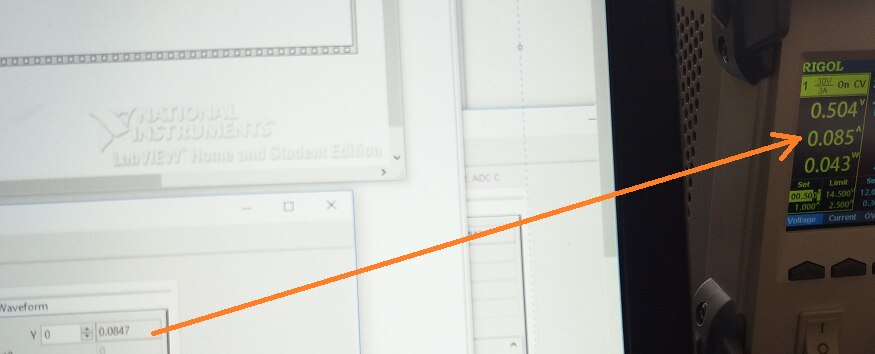
From the PSU, we get (four decimals);
- the actual voltage in V
- the actual current in A.
- the actual power in W.
All measurements, together with the set values for eload and PSU, are logged into a spreadsheet.
Setting the Measurement Conditions
The LabVIEW GUI for this process lets you set the test conditions.
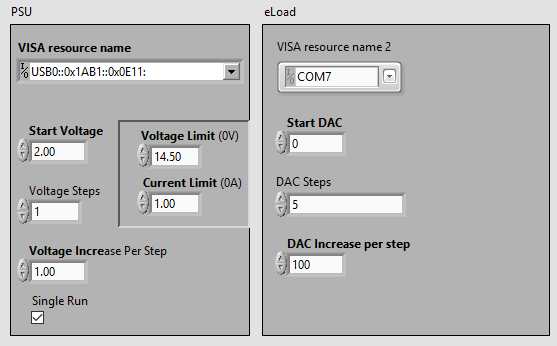
On the left side, you see the outer loop that controls the PSU voltage.
The inner loop is on the right. It controls the load.
For the outer loop, you can set the following process parameters:
- the start voltage. This is the level that is set when the process starts.
- the number of times you want to step the voltage for a complete test cycle.
- the voltage increase per step. For each iteration of the outer loop, the voltage will be added to the previous value.
- single run: if set, the process exits after it has run all the iterations of the voltage loop.
If not set, the loop will start all over from the Start Voltage until you press the Stop button (not shown). This is a continuous test that can run forever.
For the inner loop, you have similar settings:
- the start value of the DAC that controlls the current.
- how many times you want to increase that DAC setting. Once all steps are done, we give control back to the voltage loop.
- The amount of units you want to add to the DAC setting for each iteration.
All these settings are done before you start the process. Any change is ignored once the flow is execuing.
Monitor and Control
The parameters in the bottom half change - and can be changed - at runtime.
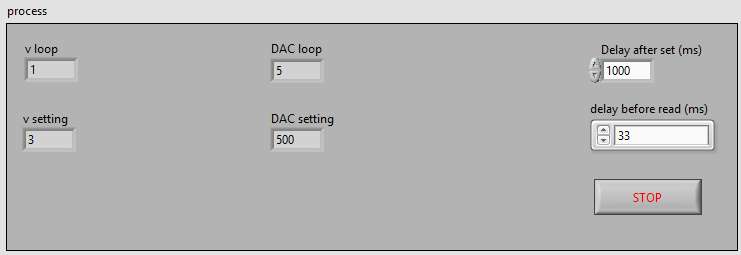
The left side show progress. You can see the counter for the inner loop (v loop) and outer loop (DAC loop).
Under each of them, you can see the value that's sent to the respective devices: PSU for voltage, load for DAC setting.
On the right you see two timing settings that you can fine-tune during the run.
The delay after set is the time that the process waits after the DAC is set.
This time needs to be long enough to have the load's ADCs take the 3 samples for A, B and C.
If you make this too short, you will get old sample values taken before the DAC has changed.
The delay before read is a communication delay. It's the time that the process waits between asking the load for an ADC value and reading the answer.
The time needed is partly driven by the firmware speed and partly by the USB communication speed.
If you make this one too short, you get communication errors and the flow will abort.
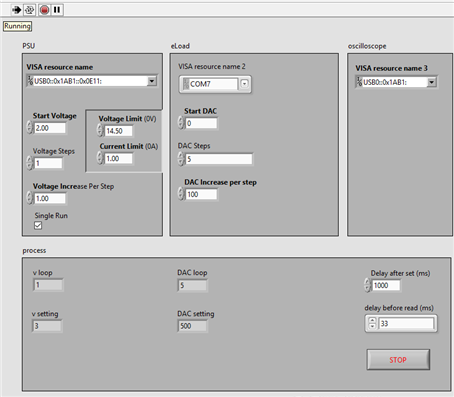
The whole display is shown here:
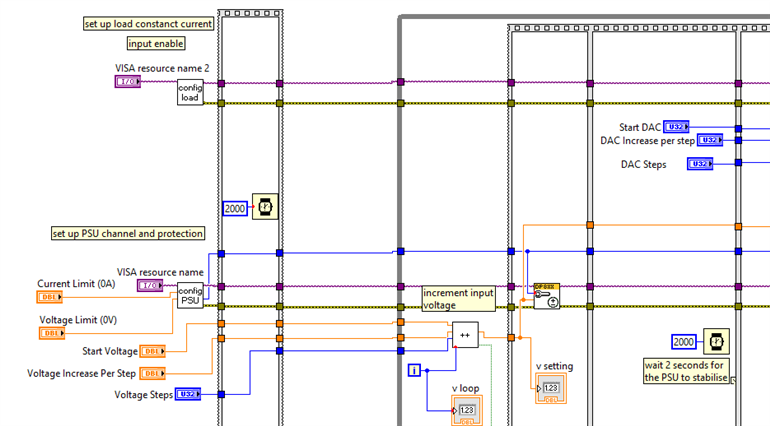
The LabVIEW Block Diagram
This is a big diagram. If you want to see it in full detail, download the attachment.
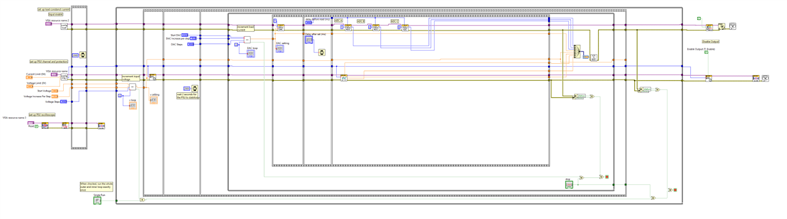
The first block initialises all devices. The PSU, load and scope are in a known initial setting when this part is complete.
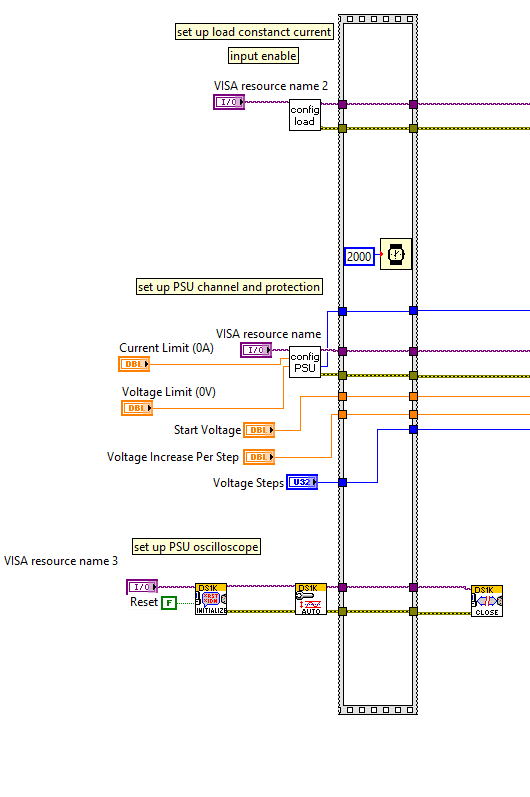
Some parts of the flow are put in their own module. I've done this to keep the flow focused on the core process. This is similar to using hierarchical sheets in a KiCAD schematic.
The flow waits 2 seconds to let each instrument settle.
The next part is the big outer and inner loop.
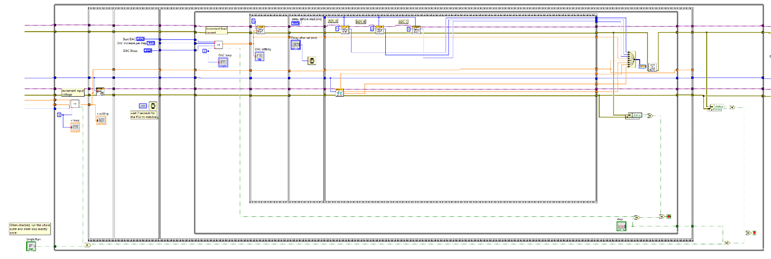
The outer loop is, as expected, the 2 rectangles counting from the outside in.
It sets the voltage, then hand over to the inner loop that's embedded. The voltage is incremented each successive iteration.
It then waits for the PSU to stabilise on its new setting,
There are exit routes for when you:
- set the Single run box and the total number of outer iterations has completed
- the user pressed the Stop button in the inner loop.
- an error is flagged by the error signal.
The inner loop is everything from third rectangle counting from the outside in.
This one then sets the requested DAC value, waits for the load to sample the values, then retrieves all measurements from both load and PSU.
The measurements are done in parallel for both devices.
At the end of that inner loop, a row is written to the spreadsheet that logs the results.
There are exit routes (they also exit the outer loop!) for when you:
- pressed the Stop button.
- an error is flagged by the error signal.
If the loop completes the iteration in a normal way, without the above exit routes, then it just gives control back to the outer loop, so that it can move on to its next iteration.
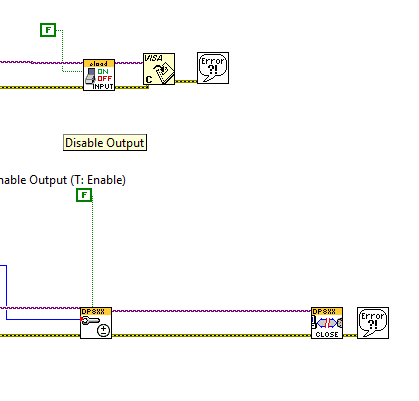
The last part releases all devices used in the process. Any uncaught errors are flagged to the user here.
In Practice
There are several ways to use this test process.
You can run it very detailed, stepping over the DAC range from 0 to 65535 in single steps, or you can use bigger steps for a subset (e.g. start at 1000, take 9 iterations with 100 units increment).
The same for the voltage. You can make that step in a few big increments, or in many fine ones (up to the resolution supported by your PSU).
You can as well let it run a range of currents for a single voltage, or a range of voltages for a single current.
It can run continuous or a single full run.
The end result is always the same. You get that spreadsheet that collects all data logged during the execution.
You can use your favourite spreadsheet program to analyse that data or graph the behaviour.
Below you see an example graph of the value of ADC A (sample of the voltage over the current sense resistor) for a range of DAC values (each measurement was a single DAC increment).
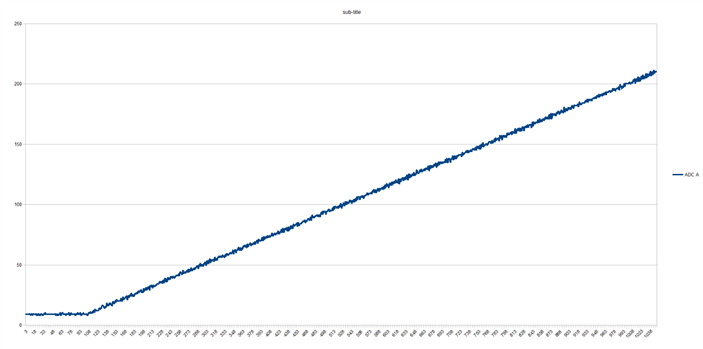
The measured voltage over the sense resistor (a function of the current the load is extracting from the PSU) is rising linear, as expected.
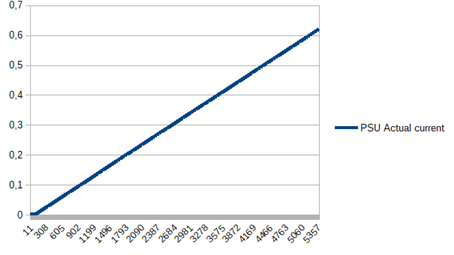
The one below shows a similar graph. This time it's the current reported by the PSU. There should be a direct relation between the two graphs above, if the current sensing circuit of the load is working correctly.
And this one is what the temperature monitor (ADC C) reports over a wider range of DAC setiings, with bigger increments:
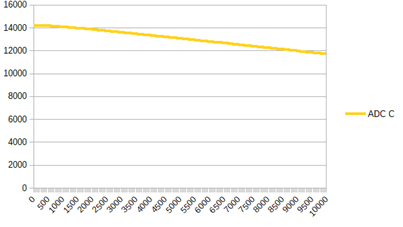
This measurement is a function of the voltage over the NTC close to the power MOSFET. The lower the voltage, the higher the measured temperature.
The time taken for a measurement increases with the number of iterations. As shown earlier, you can fine-tune some settings. Here's the back-of-the-envelope indication:
Startup takes 2 seconds. The wait time to let all instruments settle after initialisation.
Each outer loop iteration takes 2 seconds to let the PSU stabilise on its new voltage level + the time of a full set of inner loops.
Each inner loop iteration takes (if you keep the default settings) just a little more than 1100 miliseconds (a good second). The time we wait after the DAC is set (1000 ms) and 3 times a read wait of 33 ms (for ADC A to C).
To get an idea of the runtime, first calculate the time of one inner iteration (1100 ms).
Multiply that with "the number of inner iterations + 1".
Add 2 seconds.
Multiply that with "the number of outer iterations + 1".
Add 2 seconds.
Probing
LabVIEW also lets you probe values at runtime. If you are interested in a particular value that isn't logged into the spreadsheet, you can put a probe at the right place in the block diagram and you se values changing at runtime.
You can add and remove probes while the test is executing. You don't need to pause the flow.
| Related Blog |
|---|
| Programmable Electronic Load - LabVIEW Test Automation: Characterise the Instrument |
 | |
Top Comments