element14 Community
element14 Community
    Register Log In
  • Site
  • Search
  • Log In Register
  • About Us
  • Community Hub
    Community Hub
    • What's New on element14
    • Feedback and Support
    • Benefits of Membership
    • Personal Blogs
    • Members Area
    • Achievement Levels
  • Learn
    Learn
    • Ask an Expert
    • eBooks
    • element14 presents
    • Learning Center
    • Tech Spotlight
    • STEM Academy
    • Webinars, Training and Events
    • Learning Groups
  • Technologies
    Technologies
    • 3D Printing
    • FPGA
    • Industrial Automation
    • Internet of Things
    • Power & Energy
    • Sensors
    • Technology Groups
  • Challenges & Projects
    Challenges & Projects
    • Design Challenges
    • element14 presents Projects
    • Project14
    • Arduino Projects
    • Raspberry Pi Projects
    • Project Groups
  • Products
    Products
    • Arduino
    • Avnet Boards Community
    • Dev Tools
    • Manufacturers
    • Multicomp Pro
    • Product Groups
    • Raspberry Pi
    • RoadTests & Reviews
  • Store
    Store
    • Visit Your Store
    • Choose another store...
      • Europe
      •  Austria (German)
      •  Belgium (Dutch, French)
      •  Bulgaria (Bulgarian)
      •  Czech Republic (Czech)
      •  Denmark (Danish)
      •  Estonia (Estonian)
      •  Finland (Finnish)
      •  France (French)
      •  Germany (German)
      •  Hungary (Hungarian)
      •  Ireland
      •  Israel
      •  Italy (Italian)
      •  Latvia (Latvian)
      •  
      •  Lithuania (Lithuanian)
      •  Netherlands (Dutch)
      •  Norway (Norwegian)
      •  Poland (Polish)
      •  Portugal (Portuguese)
      •  Romania (Romanian)
      •  Russia (Russian)
      •  Slovakia (Slovak)
      •  Slovenia (Slovenian)
      •  Spain (Spanish)
      •  Sweden (Swedish)
      •  Switzerland(German, French)
      •  Turkey (Turkish)
      •  United Kingdom
      • Asia Pacific
      •  Australia
      •  China
      •  Hong Kong
      •  India
      •  Korea (Korean)
      •  Malaysia
      •  New Zealand
      •  Philippines
      •  Singapore
      •  Taiwan
      •  Thailand (Thai)
      • Americas
      •  Brazil (Portuguese)
      •  Canada
      •  Mexico (Spanish)
      •  United States
      Can't find the country/region you're looking for? Visit our export site or find a local distributor.
  • Translate
  • Profile
  • Settings
1 Meter of Pi
  • Challenges & Projects
  • Design Challenges
  • 1 Meter of Pi
  • More
  • Cancel
1 Meter of Pi
Blog The Space Salad System Blog 7 - Enviro HAT Data Collection and Plotting
  • Blog
  • Forum
  • Documents
  • Polls
  • Files
  • Events
  • Mentions
  • Sub-Groups
  • Tags
  • More
  • Cancel
  • New
  • Share
  • More
  • Cancel
Group Actions
  • Group RSS
  • More
  • Cancel
Engagement
  • Author Author: rockcacti
  • Date Created: 4 Jan 2021 4:54 AM Date Created
  • Views 816 views
  • Likes 2 likes
  • Comments 0 comments
  • 1 meter of pi
  • the space salad system
Related
Recommended

The Space Salad System Blog 7 - Enviro HAT Data Collection and Plotting

rockcacti
rockcacti
4 Jan 2021

Previous Blog Posts

Blog 1 - Challenge Overview + Plant Growth Factors

Blog 2 - Plant Growth Chamber Design

Blog 3 - The Project Plan + Prototype Materials

Blog 4 - Automation Using The Challenger Kit

Blog 5 - Enclosure Prototype + Light/Air/Temperature

Blog 6 - Plant Pot System + Assembly


Raspberry Pi Setup


Here's a great video by Crosstalk Solutions that shows how to set up the Raspberry Pi. Watch from start up to 21:20 for Pi configuration and SSH setup. Download SSH client PuTTY via the official website.


You don't have permission to edit metadata of this video.
Edit media
x
image
Upload Preview
image


For this project, I'll connect to the Pi from my Windows laptop via SSH. The IP address of the Pi can be found by simply typing 'hostname -I' in the Pi Terminal. In the Windows Command Prompt, type:


ssh pi@insert_your_ip_address


It then asks for a password, which is "raspberry" by default. Type the password, then press 'Enter'. After successfully connecting, the Command Prompt should display:


pi@raspberrypi:~ $


Now that the Pi setup is complete, I can now integrate the Enviro HAT.


Enviro HAT Setup


The Enviro HAT is an attachment that perfectly snaps onto the Pi pins. It is outfitted with sensors that collect environmental data such as temperature, humidity, and light.


Useful Links

  • Enviro HAT Pimoroni product page
  • Enviro HAT Pimoroni GitHub examples
  • Enviro HAT Pimoroni getting started


Before attaching the Enviro HAT onto the Pi pins, I power off the Pi. This eliminates any possibility of short circuiting the Pi in case if things aren't connected correctly. I'll have to repeat SSH connection, but it's best to be safe.


image


Starting from where I left off on SSH connection, I install the Enviro Python library provided by Pimoroni. Following the instructions outlined by Pimoroni's Getting Started with Enviro blog, I type the following into the Windows Command Prompt:


git clone https://github.com/pimoroni/enviroplus-python
cd enviroplus-python
sudo ./install.sh


'git clone' makes a copy of the Enviro HAT Pimoroni GitHub repository for installation. 'cd' changes the current directory to the one stated which is 'enviroplus-python'.


cd examples
python3 weather-and-light.py


I'm looking to use one of the examples provided in the GitHub so I 'cd' into 'examples.' I use 'python3' instead of 'python' to run the program because this one in particular requires Python 3.


image


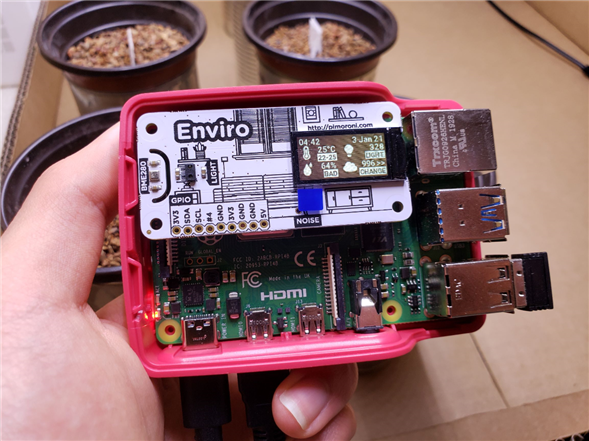
As we can see, readings may require calibration:

  • Temperature | 25°C is quite warm. Heat radiated from the Raspberry Pi CPU increases the actual reading. There is a compensated temperature program that accounts for this.
  • Humidity | 64% BAD. I'm not quite sure what qualifies as a BAD humidity. The plants are growing just fine. Perhaps the heat from the Pi affects humidity as well.
  • Light | 328 Lux. The Enviro HAT must face towards the light at the same distance as the plants to get the most accurate reading.


Data Collection and Plotting


Light, temperature, and humidity data is good to have for plant growth experiments. I'm able to get real-time light, temperature, and humidity readings on the Enviro HAT screen display, but wouldn't data be more useful if collected and plotted on a graph?


I came across Pimoroni Blog Data Collection, Logging, Plotting & Serving - A Simple Guide. I am currently working on data collection and plotting for temperature, humidity, and light. As soon as I complete those, I will update this section of the blog to include results.


In the next blog, I'll document my Automation HAT setup! Until then, keep learning and have fun! Click the arrow to navigate to the next blog.

image

  • Sign in to reply
element14 Community

element14 is the first online community specifically for engineers. Connect with your peers and get expert answers to your questions.

  • Members
  • Learn
  • Technologies
  • Challenges & Projects
  • Products
  • Store
  • About Us
  • Feedback & Support
  • FAQs
  • Terms of Use
  • Privacy Policy
  • Legal and Copyright Notices
  • Sitemap
  • Cookies

An Avnet Company © 2025 Premier Farnell Limited. All Rights Reserved.

Premier Farnell Ltd, registered in England and Wales (no 00876412), registered office: Farnell House, Forge Lane, Leeds LS12 2NE.

ICP 备案号 10220084.

Follow element14

  • X
  • Facebook
  • linkedin
  • YouTube