element14 Community
element14 Community
    Register Log In
  • Site
  • Search
  • Log In Register
  • Community Hub
    Community Hub
    • What's New on element14
    • Feedback and Support
    • Benefits of Membership
    • Personal Blogs
    • Members Area
    • Achievement Levels
  • Learn
    Learn
    • Ask an Expert
    • eBooks
    • element14 presents
    • Learning Center
    • Tech Spotlight
    • STEM Academy
    • Webinars, Training and Events
    • Learning Groups
  • Technologies
    Technologies
    • 3D Printing
    • FPGA
    • Industrial Automation
    • Internet of Things
    • Power & Energy
    • Sensors
    • Technology Groups
  • Challenges & Projects
    Challenges & Projects
    • Design Challenges
    • element14 presents Projects
    • Project14
    • Arduino Projects
    • Raspberry Pi Projects
    • Project Groups
  • Products
    Products
    • Arduino
    • Avnet Boards Community
    • Dev Tools
    • Manufacturers
    • Multicomp Pro
    • Product Groups
    • Raspberry Pi
    • RoadTests & Reviews
  • Store
    Store
    • Visit Your Store
    • Choose another store...
      • Europe
      •  Austria (German)
      •  Belgium (Dutch, French)
      •  Bulgaria (Bulgarian)
      •  Czech Republic (Czech)
      •  Denmark (Danish)
      •  Estonia (Estonian)
      •  Finland (Finnish)
      •  France (French)
      •  Germany (German)
      •  Hungary (Hungarian)
      •  Ireland
      •  Israel
      •  Italy (Italian)
      •  Latvia (Latvian)
      •  
      •  Lithuania (Lithuanian)
      •  Netherlands (Dutch)
      •  Norway (Norwegian)
      •  Poland (Polish)
      •  Portugal (Portuguese)
      •  Romania (Romanian)
      •  Russia (Russian)
      •  Slovakia (Slovak)
      •  Slovenia (Slovenian)
      •  Spain (Spanish)
      •  Sweden (Swedish)
      •  Switzerland(German, French)
      •  Turkey (Turkish)
      •  United Kingdom
      • Asia Pacific
      •  Australia
      •  China
      •  Hong Kong
      •  India
      •  Korea (Korean)
      •  Malaysia
      •  New Zealand
      •  Philippines
      •  Singapore
      •  Taiwan
      •  Thailand (Thai)
      • Americas
      •  Brazil (Portuguese)
      •  Canada
      •  Mexico (Spanish)
      •  United States
      Can't find the country/region you're looking for? Visit our export site or find a local distributor.
  • Translate
  • Profile
  • Settings
Tektronix
  • Products
  • Manufacturers
  • Tektronix
  • More
  • Cancel

Tektronix

  • Blog
  • Forum
  • Documents
  • Events
  • Polls
  • Members
  • Mentions
  • Sub-Groups
  • Tags
  • More
  • Cancel
  • New
Join Tektronix to participate - click to join for free!

image

Welcome to the Tektronix page on element14. Here you can find things such as our latest news, training videos, and product details. Additionally, you can engage with us in our forums.

Featured Video

You don't have permission to edit metadata of this video.
Edit media
x
image
Upload Preview
image

Have a Question?
Recent Discussions & Questions
  • r.ngugi
    How are students making use of our Tekscope PC analysis Software?
    8 months ago
  • r.ngugi
    What are the Key Things to consider when choosing a Basic Oscilloscope?
    over 1 year ago
  • r.ngugi
    Using Raspberry Pi to Control Your Oscilloscope
    over 1 year ago
  • r.ngugi
    Ensuring the Performance and Conformance of In-Vehicle Networks for New-Generation Automobiles
    over 1 year ago
  • r.ngugi
    Where Are We Going after PCIe 6?
    over 1 year ago
Related Products
FROM INSPIRATION TO REALIZATION: Tektronix designs and manufactures test and measurement solutions to break through the walls of complexity, and accelerate global innovation. Together we empower engineers to create and realize technological advances with ever greater ease, speed, and accuracy. 
Latest News
  • Enhancing Flying Probe Testers with 1.5 GHz TAP1500L Probes

    r.ngugi
    r.ngugi

    This blog first appeared on the Tektronix website

    image

    Introduction

    In PCB validation and manufacturing workflows there is an increasing need for cost reduction, effectual defect detection, repeatability, improved throughput and minimized touch time. Many of Tektronix’ customers are utilizing, or planning to utilize, an automated testing solution to address these needs.

    The costs of capturing defects and addressing manufacturing or design gaps downstream of final assembly are substantial. Flying probe automated test equipment (ATE) technologies have become a global front-runner in PCB test for their flexibility, speed, accuracy and automation capability.

    At Tektronix we are committed in assisting our customers along their test and validation journeys. To this end, we’re excited to announce the release of our TAP1500L; a 1.5 GHz single-ended, low-capacitance active probe that was designed with a 7 meter cable – aimed directly at our ATE development customers, end-users, or any engineer who desires greater distance between their test stations and DUTs. With the industry’s longest cable length for an active oscilloscope probe, the TAP1500L does not compromise performance and provides one additional meter versus other single-ended active probes in the market.  

    The TAP1500L requires no external power supply, is compatible with all the accessories within Tektronix’ single-ended active probe catalogue and performs equivalently with our best-selling TAP1500 oscilloscope probe.

     image

    Flying Probe Test vs. In-Circuit Test

    Flying Probe Test (FPT) is an automated process utilizing flying probe testers to assess PCBs in design, validation and manufacturing workflows. Probes, typically attached to robotic arms and aided by high-resolution cameras, swiftly glide over and below the PCB surface automatically making electrical contact at specific test points on the PCB to provide real-time data to engineers. This probing process quickly identifies defects such as open circuits or component placement issues without the need for custom test setups, or bed-of-nails fixtures. FPT can also be used for functional testing, in which a populated board is powered up and running. In this application, single-ended, active oscilloscope probes and an accompanying oscilloscope can be integrated into the system to perform go/no-go testing on critical signals. A key benefit to FPT is changes to PCB layout or design do not require any new fixturing to conduct quality or validation tests. A change in the FPT test program to accommodate the PCB design changes allows for a nimbler approach to PCB testing and increases throughput at this process step.

    Tektronix has solved a critical pain point by extending our standard cable length by more than 5 times.

    In-Circuit Test (ICT) is a more traditional method of testing PCBs, typically utilizing a bed-of-nails test fixture. Bed-of-Nails relies on a customized fixture unique to the PCB under test and involves some amount of spring-loaded electrical connections to measure circuit behavior during quality control, manufacturing or functional testing procedures. ICT is a valid and effectual method for testing PCBs at various stages in the development and manufacturing process. However, as form factors shrink, PCB designs increase in complexity and aggressive cost savings are pursued, more customers are exploring and implementing FPTs to meet their performance goals.

    With FPT, testing with multiple probes moving along 3-axes at high speed requires careful planning and design to minimize damage to the DUT or to the probes themselves. Tektronix has solved a critical pain point by extending our standard cable length by more than 5 times - providing engineers greater flexibility in how they design these ATE systems and how these systems interface with their oscilloscopes and other measurement hardware.

    Performance Characteristics

    Using our best-selling TAP1500 single-ended active probe as a backbone, Tektronix was successful in increasing the probe cable length with no impact to probe performance. Increasing cable length presents some performance challenges, specifically increased impedance and impacts to rise time and step response. Tektronix was able to solve these performance deltas with a customized DSP (Digital Signal Processor) that accompanies every TAP1500L. A simple installation of this DSP to the appropriate math channel level-sets the TAP1500L performance with the TAP1500 upon which it was developed. No additional power supply is required to utilize the TAP1500L. The TAP1500L is compatible with 4 Series, 5 Series and 6 Series MSO midrange oscilloscopes and utilizes the TekVPITM probe to oscilloscope interface. This enables the engineer to see results and adjust key parameters in real-time from the front panel of the oscilloscope.


    Specification TAP1500L w/DSP TAP1500

    Cable Length

    7m

    1.3m

    Bandwidth

    1.5 GHz

    1.5 GHz

    Rise Time

    <267ps

    <267ps

    Input Capacitance

    ≤1pF

    ≤1pF

    Input Resistance

    1MΩ

    1MΩ

    Input Dynamic Range

    -8V to +8V

    -8V to +8V

    DC Input Offset Range

    -10V to +10V

    -10V to +10V

    Table 1: Performance specifications of the TAP1500L vs TAP1500. Even though the cable on the TAP1500L is 7m long, the rise time and input loading are unchanged from the original TAP1500.


    Conclusion

    The ATE and Flying Probe market spend is expected to increase nearly 3x by 2030, per a 2024 study by Research Reports World, with primary adoption centers forecasted in the Americas, European and Asian regions. Flying probe testing (FPT)is becoming more commonplace in PCB development and probing needs have and will continue to evolve alongside this technology.

    Providing probing solutions that address customer pain points is going to be critical as this ATE technology scales to meet global demand. The TAP1500L represents the first step that Tektronix is taking to better partner in this market and empower our customers to make the most out of their FPT investments.

    • 19 Sep 2024
  • Analyzing a Raspberry Pi as a RF Transmitter

    r.ngugi
    r.ngugi

    image

    Raspberry Pis are an extremely useful tool for hobbyists and technical professionals alike, but did you know that you can use one to transmit an RF signal? Using the RSA306B real-time spectrum analyzer, we can characterize the capabilities of this ultra low-cost RF generator made with nothing more than a Raspberry Pi, RPiTX software, and some spare wire.

    How do I install RPiTX?

    The RPiTX software is ran on the Raspberry Pi (Raspbian) Operating System designed for all Raspberry Pis. This operating system can be configured for your device’s SD Card using Raspberry Pi’s provided Imager. Once the operating system is on your device, you need to have the latest git package installed on your device. This can be done via the commands in the terminal. From there you can clone the repository for RPiTX and install it on your device. Once installed, you can now launch the software from your terminal to start transmitting your own signals.

    Contained on the RPiTX GitHub Page is the full breakdown for the installation of the software. This page also provides a detailed catalog of the features available with the software.

    With the RPiTX running on your Raspberry Pi and signal frequency selected you can now begin transmitting your own RF signals. By utilizing the RSA306B USB Spectrum Analyzer connected to SignalVu-PC you can measure the signals you are generating in real time.

    image

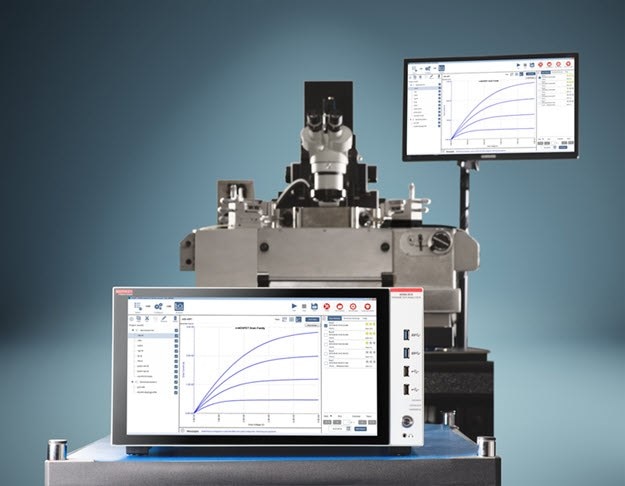
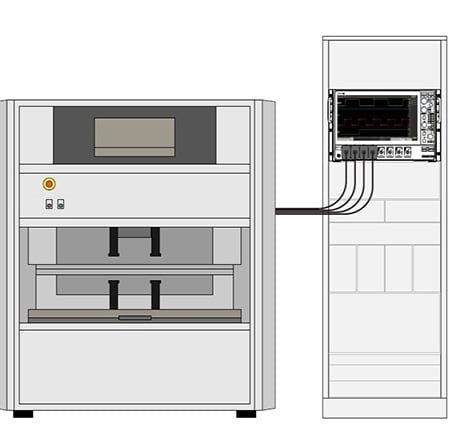
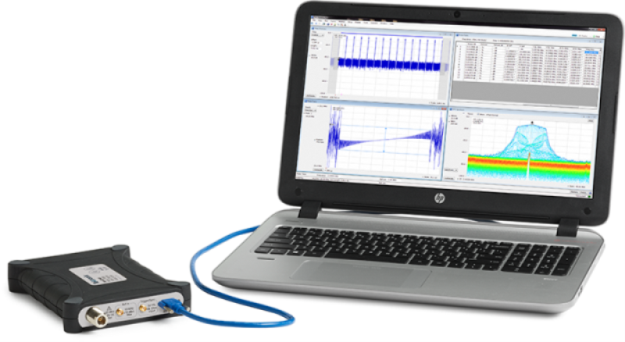
    This hardware/software pair provides many ways to characterize RF signals up to 6.2 GHz, well beyond the output capabilities of the Raspberry Pi. Let's look at a few common RF measurements to get an idea of what characterization is possible, and examine the output of the Raspberry Pi.

    Carrier Frequency

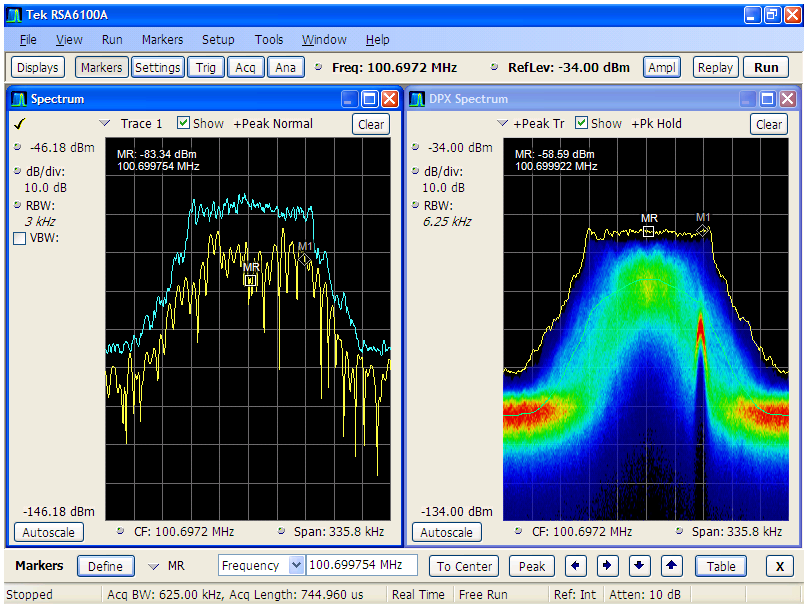
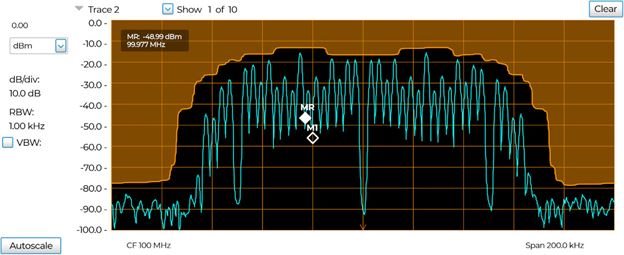
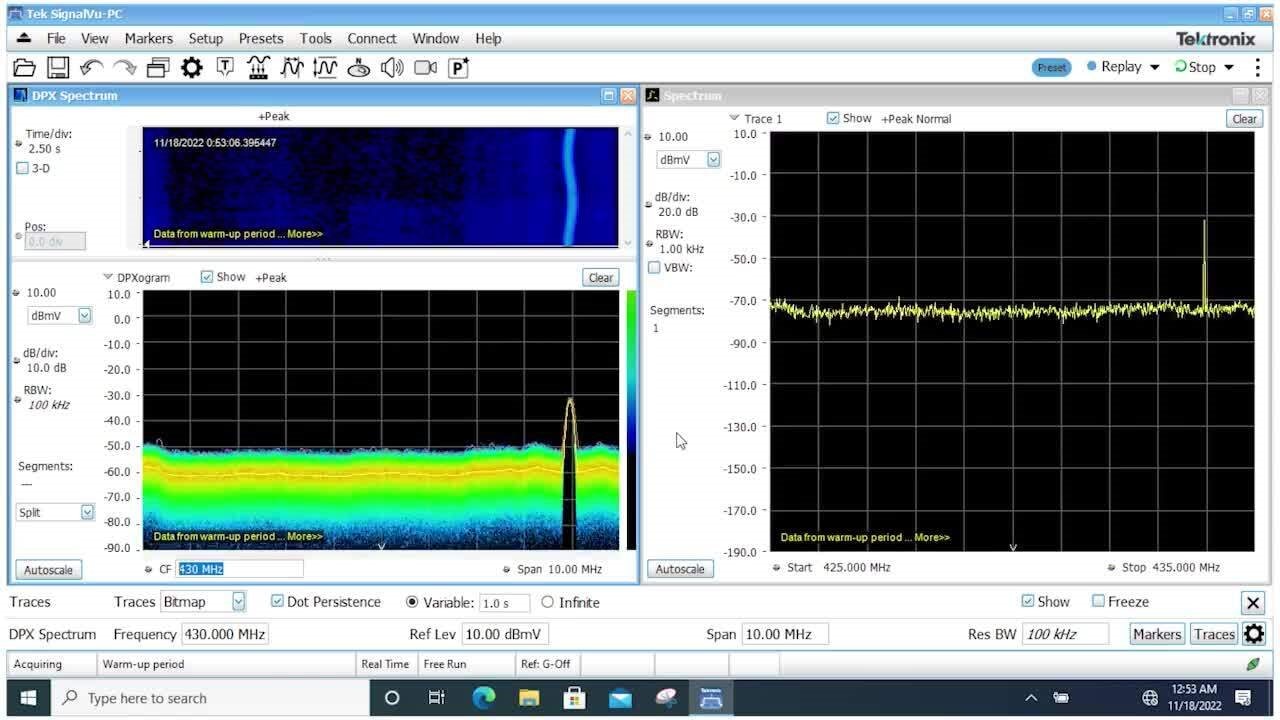
    A carrier frequency is the base frequency that will be modulated in an RF signal. Without any modulation, it is a simple RF peak at a chosen frequency. This is the default output of RPiTX software. Using the RSA306B with SignalVu-PC software we can capture this band of frequency and measure its amplitude.

    image

    Chirp

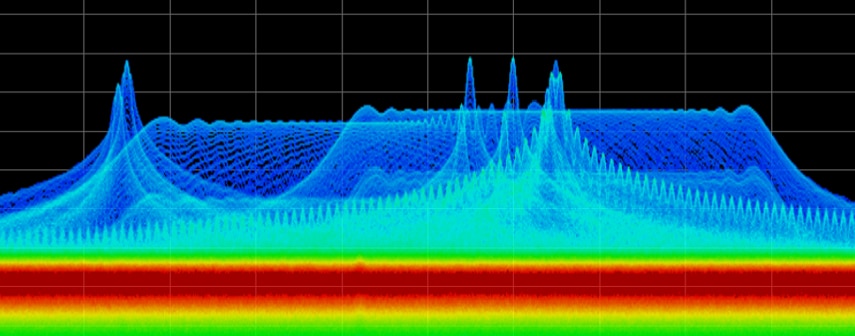
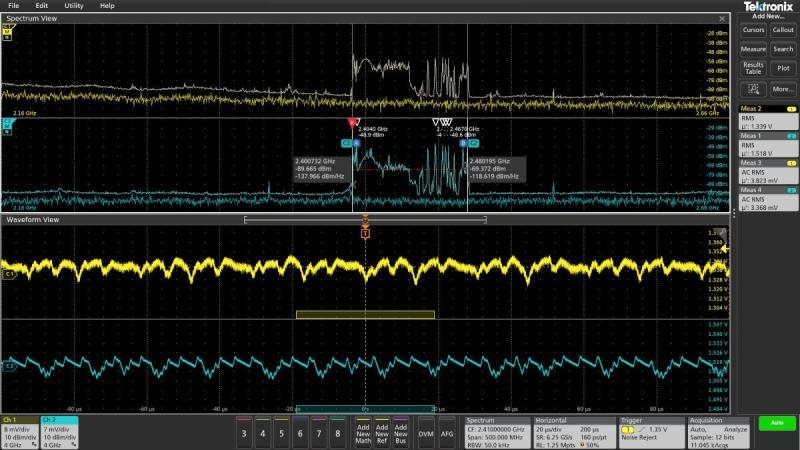
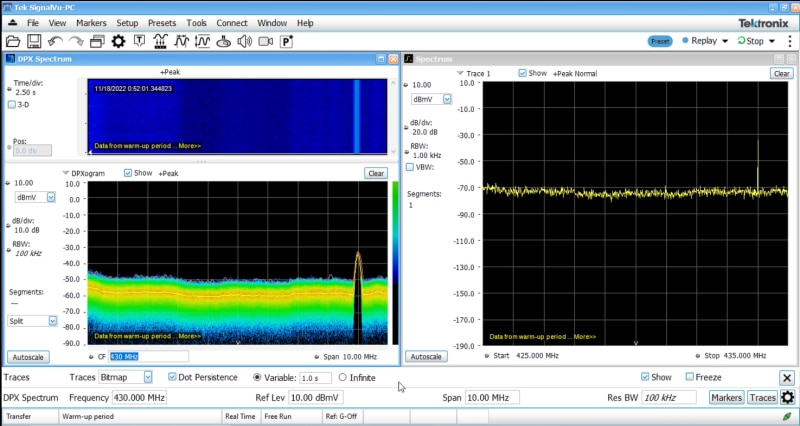
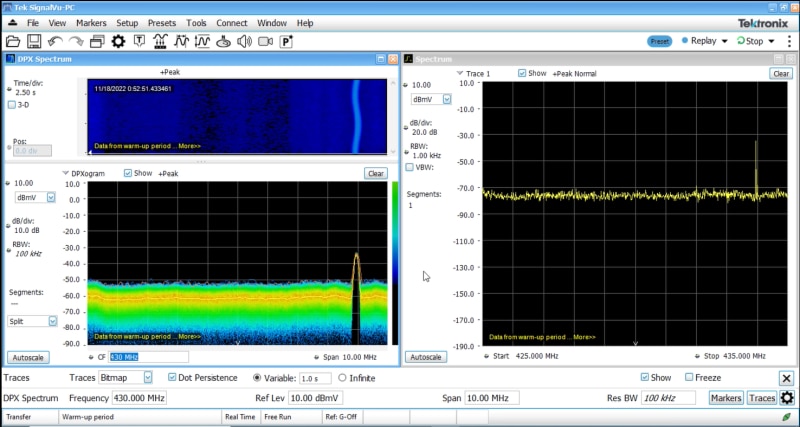
    An RF chirp is a simple frequency modulation over time. SpectrumVu-PC allows us to see chirps generated with RPiTX in a few different ways. Notably, the DPX Spectrum view shows us a waterfall of RF intensity over time in which this chirp, or any frequency modulation becomes apparent and easy to visualize. For faster modulations, we would also benefit from the RSA306B's real-time acquisition, preventing us from missing any time in the signal.

    image


    Spur Search with the RSA306B

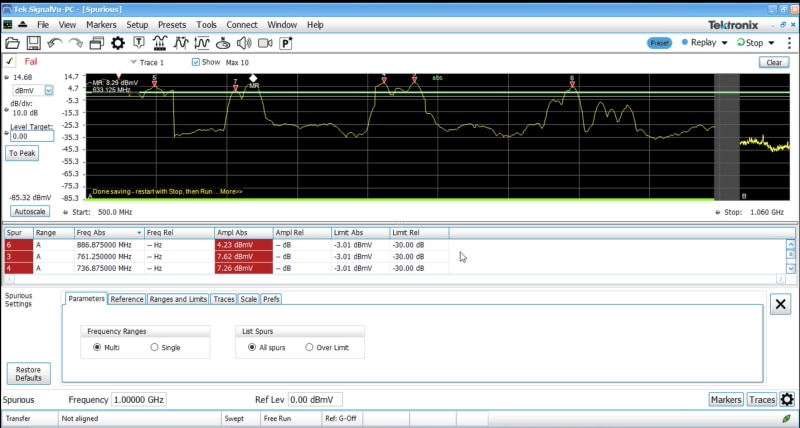
    Thanks to the impressive 40MHz bandwidth of the RSA306B, large samples of the spectrum are taken in real-time. By knowing the amplitude of our spurious signals, we can hunt for them across a wide spectrum. Spurious signals are more common in low cost RF transmitters, and the Raspberry Pi is no exception. Real-time spectrum analyzers like the RSA306B are especially fast at spur searches thanks to that real-time bandwidth. In the SignalVu-PC software we can specify multiple amplitudes to hunt for and have the largest samples at frequencies be saved to ease our search. A fun experiment to run is randomly select a frequency within RPiTX and watch as it breaks the threshold of a spur search and watch as it is detected.

    image

    This blog first appeared on the Tektronix website. 

    • 13 Sep 2024
  • Probe Points: Understanding Low Frequency Response

    r.ngugi
    r.ngugi

    image

    This blog first appeared on the Tektronix website

    The Practice of AC Coupling and DC Reject Modes

    The practice of AC coupling the scope input or using a probe with DC reject capability is very common when looking at noise and/or ripple of DC power rails. Anytime there is insufficient DC offset available, then users often elect to use AC Coupling or DC Reject settings. With the focus on clean power, we see users more interested than ever before in understanding the voltage and noise characteristics of their power sources.

    Exploring AC Coupling and DC Reject Modes

    This post explores some of the perhaps unexpected or unknown characteristics of using AC coupling or DC Reject modes and how they ultimately may lead to incorrect conclusions. Functionally, when we think of either of these modes, we can visualize placing a capacitor in series with the input to the scope and therefore how this could impact the low-frequency response. More often, when we think of probes and oscilloscopes, we look at the high-frequency response and roll-off characteristics and ignore the low-frequency behavior.

    Note that the numbers portrayed in this post represent experimental results and are not meant to reflect actual guaranteed specifications. The plot above compares the low-frequency response of several setups and illustrates the differences.

    In the plots above in the first image, I chose 1 Hz as the low-frequency limit for practical sake and 100 kHz as the high limit, as all probes behaved similarly above 100 kHz. The table below gives more detail and shows the measured 3dB bandwidth for each of the different probing/setups used.

    Connection

    3dB roll off (LF)

    Comments

    Direct AC

    7 Hz

    No probe, AC coupling

    TPR_DCR

    16 kHz

    TPR1000 Power Rail Probe, TekVPITm probe interface, DC Reject mode (datasheet)

    TPP1000_AC

    < 1 Hz

    TPP1000 10x Passive Probe, TekVPI probe interface, AC Coupling Mode (datasheet)

    TDP1000_DCR

    22 Hz

    TDP1000 Differential Probe, TekVPI probe interface, DC Reject mode, 4.25V range (datasheet)

    P6247_DCR

    5 Hz

    P6247 Differential Probe, TekProbeTm interface, DC Reject mode, X1 (datasheet)

    Data was collected using the FRA (frequency response analysis) tool included in the Power Measurement and Analysis option (PWR) on an MSO68B oscilloscope, coupled with an AFG31000 Series arbitrary/function generator to perform the frequency sweep. Data was exported to CSV from the scope application and imported into Excel for plotting and analysis. In addition to the 6 Series B MSO, the PWR package is also available on 4 Series B MSO and 5 Series B MSO oscilloscopes.

    I found published specs for the scope's (MSO68B) AC coupling mode roll-off of < 10Hz, so the measured 7 Hz is in line. Same for using a TPP1000, the low freq 3dB point should be <1Hz. I didn't find any low-frequency response specs for the TPR1000 or TDP1000 probes.

    Recently, I had an application where a customer was mostly concerned about power rail noise in the <5Hz range. There were many conflicting choices for a solution. The TPP1000 in AC coupling mode had the low frequency covered, but the 10X attenuation was detrimental to the noise floor of the measurement. The P6247 in 1X mode historically has been a good choice for power rail noise, but its roll-off and also its legacy design being slightly noisier made it unacceptable.

    The TPR1000 Power Rail Probe in DC Coupled mode worked well for the customer's < 5 Hz requirement, but one can see how choosing DC reject mode (as in Table 1) could give misleading results. A powerful feature of the TPR1000 is its large ( +/- 60 V) offset range, allowing it to zero out a wide range of DC in lieu of using DC Reject. It is also good to remember the TPR probes do load the AC portion of the signal differently than other probes.

    Summary

    Knowing the low-frequency response of your measurement system can be critical to many measurements, especially for power and noise applications.

    • 6 Sep 2024
  • Understanding How To Analyze Jitter

    r.ngugi
    r.ngugi

    image

    Why You Should Care About Jitter

    Jitter is a common problem. A quantified misplacement in time of the signal relative to the expected time position, jitter is ultimately a degradation of the key definition of performance of a serial link, which is the bit error ratio. Power distribution networks (PDNs) can cause noise as well as jitter; both can cause transmission errors and increase the bit error ratio of a serial link.

    Engineers need to characterize their devices definitely in terms of the bit error ratio. They want to know whether their device is measuring up to the target bit error ratio, whether it has forward error correction, and what is the target bit error ratio they need to reach. The behavior of different elements is very relevant to the total behavior and impairment of a device.

    Traditionally, Bit Error Rate Testers (BERTs) were used as instruments to directly measure the bit error ratio, which is the actual measurement target, but those devices are very expensive, and they don't really help people identify the root causes of impairments of the links. As a result, the industry developed alternate approaches using oscilloscopes and advanced custom analysis tools, which are better focused on the causes of error, are more cost-effective and have faster throughput. Bit error requirements have been translated to jitter and noise budgets.

    Consider a serial link with a transmitter, channel, and receiver. From the receiver's point of view, we can see that the decision threshold is impaired by the noise in the system, and the time reference is impaired by jitter. By extracting jitter and noise and identifying them clearly in a serial link, we can extrapolate their effects to predict the bit error ratio and understand the performance of the system. Jitter analysis evaluates a waveform in the horizontal dimension based on when the waveform crosses a horizontal reference line, while noise analysis evaluates along a vertical dimension on the basis of crossings of a vertical reference line, typically in the center of the eye; combining jitter and noise analysis provides a better prediction of bit error ratio performance.

    Types of Jitter

    Jitter is caused by many things, including:

    • Broadband noise density jitter: Wideband noise related to power loss impedance that shows up as voltage in sensitive circuits, creating jitter.
    • Power rail resonance jitter: Impedance resonance, with noise peaks that convert to AM in the power supplier rail of a sensitive circuit.

    image

    Image 1: Example of Power Rail Resonance Jitter

    • Event-driven jitter: Jitter that occurs because of something else that happened in the system.
    • Modulation-induced jitter: FM or phase modulation that converts to AM on the power supply rail.
    • Thermal noise: Typically a Gaussian distribution, thermal (or intrinsic) noise is unbounded and caused by the random thermal motion of carriers. It’s much like background conversations … random and ever-changing.
    • Injected noise: Jitter from electromagnetic interference (EMI) or crosstalk from neighboring wiring, injected noise is bounded but uncorrelated to the data stream the device is handling. It usually has a fixed, identifiable source, like an oscillator or power supply.

    image

    Image 2: Example of Jitter on Clock from Power Supply

    • Transmission losses: Jitter due to bandwidth limitations, skin effect losses, dielectric absorption, dispersion in the optical fiber, or reflections, impedance and mismatches.

    How to Analyze Jitter and Noise 

    The goal is to predict, using limited acquired data, the behavior of a device at target bit error ratio specifications. The methods are complex, requiring the tester to decompose, reconcile and model noise and jitter. It involves a five-step process:

    1. Acquire statistically relevant data. How to do so depends on whether the oscilloscope in use is a real-time or a sampling instrument.
    2. Break down and separate the various jitter and noise components.


      image

    3. Reconcile the effects of jitter and noise. What is jitter? What is noise? Noise is always jitter, but jitter is not always noise.
    4. Build statistical models that allow for extrapolation of behaviors to higher BER targets.
    5. Perform measurement on the models for Total Jitter as a Specified Bit Error Rate (TJ@BER) and Total Noise at a Specified Bit Error Rare (TN@BER).

    The serial data standards of today’s high-speed communications require extensive jitter compliance tests. Learn more about how Tektronix' test instrumentation portfolio enables you to meet design goals and compliance requirements or view our on-demand webinar, Signal and Power Integrity.

    This blog first appeared on the Tektronix website. 

    • 30 Aug 2024
  • Test and Measurement in the Quantum Era

    r.ngugi
    r.ngugi

    This blog first appeared on the Tektronix website. 

    image

    From an engineer’s perspective the continuous advancement of quantum hardware and technologies is amazing.

    My interest began with curiosity about quantum physics. Now that curiosity is expanding as I gain a deeper understanding of the test processes, principles and criteria being used by these emerging technologies and how Tektronix can serve them. But let’s start at the beginning.

    A Growing Number of Quantum Applications

    Quantum technologies promise to be game-changing. In fact, we are living in the transition from pure research to a broad initiative feeding a quantum ecosystem across many industries. Several government-funded initiatives have nurtured and supported the study of matter and energy both at their most fundamental level and also the way their behavior can be deployed into practical technologies applicable in quantum computing, quantum communications and quantum sensing.

    image
    Quantum research has a broadening array of applications. Source: FutureBridge Analysis.

    Measurement Plays a Key Role

    As with any technology, measurement is necessary to confirm both progress and effectiveness. Tektronix has always been involved with validating measurements and enabling applications at the early stages of revolutionary waves. When the so-called “AC Josephson Effect” and “Quantum Hall Effect" revolutionized electrical metrology by providing stable reference standards linked to fundamental physics, instruments like Keithley electrometers and sensitive source measure unit instruments (SMUs) were part of the calibration test system used. But improving the reference of Volt or Ampere standard is just the beginning.

    Quantum Sensors

    Measurement of physical quantities in quantum phenomena is essential for describing quantum properties of quantum sensing systems. Research has made a large step forward with the realization and practical application of quantum sensors like magnetometers based on superconducting quantum interference devices; instrumentation has provided sensitivity and precision in proving the behavior of spin qubits, flux qubits and trapped ions.

    Quantum sensors base their operating principle on the fact that physics particles can be used as “probes” to measure physical quantities such as magnetic fields, gravity, rotation, and acceleration more precisely than classical devices based on other electrochemical phenomena.

    Very often we come across laboratories that are trying to establish quantum phenomena in quantum materials.  Their diagnostic (measurement) need is to precisely acquire a photocurrent that originates with the transduction of light into electrical signals when interacting with quantum materials.

    The interaction and connection of light with matter is being explored using ever more innovative techniques. Test and measurement equipment is being used to acquire ultrafast photocurrents in order to be a “diagnostic tool” for understanding what happens in the quantum material.

    Modern oscilloscopes such as the Tektronix 6 Series B MSO with their front-end linearity and wide dynamic range enable microwave readout from resonators excited by optical signals. Oscilloscopes excel in microwave photon resonator testing where precise triggering of multiple pulse signals for acquisition in the nanoseconds range is needed.

    image
    Researchers can use the 6 Series B MSO oscilloscope to view signal details due to its high-resolution 12-bit analog-to-digital converters. Capture single event, fast-changing electrical signals using analog-to-digital converters and then store the digitized waveform data in fast memory.

    Quantum Communications and Quantum Security Applications

    Another key application within the quantum ecosystem is quantum communications. Here light travels through fiber networks. The advantage of applying quantum technology to communication lies in the attempt to make information transfer secure. QKD (Quantum Key Distribution) technology enhances conventional encryption technology and makes data transfer intrinsically “unhackable”.

    Quantum-based cryptography provides a means for the detection of eavesdropping by observing a disturbance of intercepted quantum states. Further research is still needed before it can be practically implemented, however. Approaches and protocols to implement QKD are the focus of multiple government-funded projects and test and measurement equipment may be applied in observing and accurately measuring these disturbances. They also play a role during the polarization state of qubits traveling via fiber optic cables in the form of pulses of polarized photons attenuated to the quasi single-photon level, and specifically with the phenomenon of decoherence.

    image
    Quantum researchers can use the AWG5200 arbitrary waveform generator to create the clean, stable waveforms that make breakthroughs possible.

    Laboratories working on demonstrating CV-QKD (Continuous-Variable Quantum Key Distribution) across a several kilometers long multi-core fiber (MCF) have applied the Tektronix AWG 5204 with its four 16-bit, 5 GS/s DAC channels AC coupled with wideband RF amplifiers. This arbitrary waveform generator is capable of generating highly synchronized and precisely modulated pulse signals that, coupled with a continuous light wave in electro-optic phase modulators, generate quantum signals and reference pulses in the sub-nanoseconds time base scale (“Alice” emitter side). At the “Bob” receiver side, a Tektronix 6 Series B MSO 12-bit oscilloscope can collect the phase information and rapidly store/transfer data for statistical processing of noise. The acceleration of QKD and its integration into secure network communication at increasingly high baud rates is extremely interesting and rewarding.

    Quantum Computing

    The last and most intriguing quantum application we are honored to support is quantum computing.

    Despite the difficulty in sharing any details about how superconducting qubit chipsets are manufactured, AWGs and oscilloscopes are definitely involved wherever a Transmon (Transmission Line Shunted Plasmon Oscillation Circuit) is present and whenever complex signal schemes need to be routed to resonators for setting the states and amplitude coherence (or energy relaxation) time has to be measured.

    In fact, before integrating multiple channels in a specifically designed FPGA architecture, flexible instruments like AWGs are used and appreciated for their high configurability and analog bandwidth, and also their low latency and intrinsic jitter. The tasks of qubit excitation and that of readout pulse are implemented using, respectively, remotely controlled AWGs and mixed signal oscilloscopes. This allows verification of design within a highly reproducible setup. Tektronix AWGs can easily target qubit generation frequencies in the few GHz range and Tektronix 6 Series B MSO oscilloscopes with their 10GHz max bandwidth are used for reading out resonator frequencies in the range of 5–6 GHz.

    The challenge of scalability of quantum integrated circuit architecture into several 10’s of qubits goes beyond the capabilities of instruments specifically designed for an R&D context, but crucial to the future of testing is the need to reduce cost per channel, improve closed loop feedback control, and integrate test equipment into complex quantum test libraries. The systematic approach to test automation that Tektronix initiated by releasing Python specific libraries and programming environment integration demonstrates our leadership in this domain as well.

    • 16 Aug 2024
  • Automotive Ethernet Testing Challenges

    r.ngugi
    r.ngugi

    image

    This blog first appeared on the Tektronix website.

    There are a number of compliance requirements for the latest automotive Ethernet standard, which is Multigigabit Ethernet. While some of the low-speed, in-vehicle network standards, like CAN, LIN, and FlexRay, do not require any compliance testing, for automotive Ethernet there is a compliance test defined by IEEE and Open Alliance that contain a number of test requirements.


    The integration of automotive Ethernet is placing greater demands on technology and is placing even greater demands on comprehensive design validation to ensure interoperability between multiple Electronic Control Units (ECUs) and reliability in demanding environments. A complete testing solution enables passing strict compliance tests and provides greater confidence in design margins under real-world conditions.


    In particular, there are a number of testing challenges and measurements that are needed to ensure hardware interoperability. They include:

    • Distortion Measurement – The distortion test measures the maximum allowable transmitter distortion. This test requires the use of a disturbing sine wave signal that is added to the PHY output signal. The peak transmitter distortion is calculated, and the measured values are compared against the compliance test specification.
    • Return Loss Measurement – The return loss test determines the impedance mismatch from the differential impedance specification of 100 Ω, which will affect hardware interoperability.
    • Jitter and Transmit Clock Frequency Measurements – Separate tests are run to measure the Master (Slave) RMS jitter and the Tx clock frequency.
    • Droop Measurement – The droop measurements are performed by determining the positive and negative waveform peak voltages.
    • Power Spectral Density (PSD) Measurement – The spectral of an input signal is computed using built-in oscilloscope MATH functions. Post processing is done on the signal to arrive at the PSD. The computed PSD is then compared with the specification by using lower and upper masks to arrive at the final result.
    • MDI Jitter Measurement – This test measures jitter of the data signals.


    These types of early testing increase the likelihood of passing compliance tests, while allowing more complete characterization and determination of design margins. If we perform these measurements manually, however, it's going to be very time consuming. The Tektronix automated test application for automotive Ethernet, which helps reduce test time, also achieves higher accuracy with the measurements the algorithm developed in association with the standard bodies. TekExpress is the automation platform used for many of the Tektronix high-speed serial compliance tests.


     image

    Test Selection with Automotive Ethernet Software


    For more detail on these measurement tests and use cases and the pitfalls that an engineer might encounter during test setup and execution, watch our pre-recorded webinar, Automotive Multigigabit Ethernet, or the related software demonstration.

    • 2 Aug 2024
  • Overcoming 3 Challenges of Time and Frequency Correlated RF Measurements

    r.ngugi
    r.ngugi

    image

    This blog first appeared on the Tektronix website.

    Historically, engineers working with high-frequency signals have relied on spectrum analyzers to identify, characterize, and test the performance of their designs, devices, and systems. But these devices fall short when analyzing signals with an unpredictable time-related behavioral component.

    Tektronix Real-Time Spectrum Analyzers (RTSAs), however, capture and store signals as a seamless, continuous record of time. Combining deep memory with powerful digital signal processing, RTSAs allow for a variety of triggering, display, and analysis capabilities to reveal signal changes in both the time and frequency domains.

    In this post, we’ll cover three key challenges engineers face when it comes to time and frequency correlated measurements, and how Tektronix RTSAs can address those challenges.

    1. Capturing Unknown Signals

      Analyzing today’s high-bandwidth RF signals requires vector measurements that provide both magnitude and phase information. Modern vector signal analyzers (VSAs) are best suited for capturing stationary or repetitive waveforms. But they have a limited ability to analyze transient events, pulsed waveforms, or other fast-occurring phenomena. This becomes an issue, of course, because it’s tough to capture a signal you aren’t aware of or you’re not anticipating.

      In addition to capturing traditional spectral measurements, RTSAs produce spectrograms using gapless acquisition with thousands or even millions of FFTs per second. These spectrograms are traditional waterfall color-coded representations of spectral power over time, which allows engineers to track variations in the spectrum.

      Using patented Digital Phosphor Technology (DPXTm), Tektronix RTSAs can uncover hidden signals by rasterizing RF samples into pixel information, giving you a truly “live” view of the RF signals. The DPX display helps you to see how traces change over time and displays signal events that cannot be seen with traditional spectrum analyzers. The DPX spectrum indicates how traces change in two ways: First, it uses color shading to show how consistent the shape of a trace is. Second, it uses persistence to hold signals on the screen so you can see them longer. The DPX display reveals transient signal behavior that helps you discover instability, glitches, and interference that might be in the same band as your expected signals but separated by either time or power levels. This enables you to distinguish rare transient signals from normal signals and background noise, as the figure above shows.

    2. Triggering in Frequency and Time

      VSAs lack key mixed-domain (frequency and time) triggering capabilities — like triggering on specific signal frequency variations, power densities, or event durations — needed to discover infrequent events. They also lack the ability to continuously record while processing acquisitions, so VSAs may miss triggering conditions that occur while processing the previous acquisition. Triggering also requires prior knowledge or understanding of the event, which may not be realistic with transient, intermittent, or unexpected signals.

      image

      With gapless acquisition capabilities, Tektronix RTSAs maintain a continuous time record of thousands or even millions of spectra per second, so engineers will never miss fast RF transients and effects again. You can also use RTSAs to set new types of triggers that respond to mixed-domain conditions such as carrier frequency drift or appearance of interferers during an acquisition window. Additionally, users can set DPX density-based triggers, which leverage signal history in the form of display persistence to capture signals only when they occur a minimum number of times. 

    3. Storing, Retrieving, and Analyzing Data in the Time and Frequency Domain

      With traditional VSAs, field engineers often struggle to analyze signals in both the time and frequency domains. To begin with, they need two acquisitions to capture this information — one in the time domain and one in the frequency domain — which is a time-consuming task. Second, the relationship between time and frequency is often lost when engineers are back in the lab and want to retrieve and analyze those signals.

      To address this challenge, the internal architecture of Tektronix RTSAs only requires a single acquisition, saving you time, and ensuring that every acquired sample maintains a correlation in the time and in the frequency domain. Furthermore, Tektronix RTSAs preserve the relationship between time and frequency measurements not only during the acquisition, but also when the data moves to storage for later retrieval and analysis. Never again will you find yourself reviewing your data and wondering when that unexpected glitch happened.

    For engineers who need to efficiently understand the relationship between signal power, frequency, and time, traditional VSAs can’t do the job. Tektronix Real-Time Spectrum Analyzers, however, address this challenge, saving you time and allowing you to capture, identify, and analyze the hard-to-get, glitchy, and unexpected signals that VSAs miss.

    For detailed information regarding these three challenges, please download the technical brief – Overcoming 3 Key Challenges of Time and Frequency Correlated RF Measurements. To see a quick demonstration, check out this video on Fast Spectrum Sweeps with a Real-Time Spectrum Analyzer.  

    • 26 Jul 2024
  • 3 Radiation Hazards (RADHAZ) and How to Mitigate Risk

    r.ngugi
    r.ngugi

    This blog first appeared on the Tektronix Website.

    image

    If you are involved in military, aerospace or defense and have been around radar and communication systems, with high-power RF transmitters and high-gain antennas, you are probably aware of the many risks associated with Radio Frequency Radiation (RFR) Hazards. RF emissions from these systems have the potential to cause catastrophic damage to operations and maintenance personnel, ordnance and fuels, and associated equipment.

    If you are responsible for Radiation Hazards (RADHAZ), Emission Control (EMCON), Communications-Electronics Command (CECOM) or the management of electromagnetic environmental effects (E3), you understand that in today’s technological environment, it’s not sufficient only knowing whether systems are exceeding appropriate levels. To support daily operation to ensure security and safety, it’s more important than ever to be able to discover, locate, classify, record, and playback signals of interest through a combination of field surveying and deployed spectrum monitoring.

    image

    Government publications and others provide comprehensive information on the risks, Personnel Exposure Limits (PEL), hazard measurements, design criteria and safe operation guidelines. However, new technology advancements with increased RF emitting technology capabilities requires a higher level of RF situational awareness.

    RADHAZ procedures set the fundamental requirements to mitigate risks associated with Radio Frequency Radiation (RFR). For military personnel, RADHAZ risks can be especially high when two radar emitting vehicles or ships interact with each other. As an example, when two ships approach each other, each ship needs to be aware of the potential electromagnetic radiation hazards and their required safe distances and procedures during operation. Failure to monitor the RFR present can, and has, resulted in catastrophic accidents.

    Per the Navel Safety Center, RF Hazards fall into three main categories:

    • Hazards of Electromagnetic Radiation to Personnel (HERP)
    • Hazards of Electromagnetic Radiation to Ordnance (HERO)
    • Hazards of Electromagnetic Radiation to Fuel (HERF)

    Let’s take a look at each of these RF hazards:

    What are Hazards of Electromagnetic Radiation to Personnel (HERP)?

    HERP may result in injuries to people in environments where radar and communications systems operate.  The use of high frequency transmitters and high-gain antennas, and the complicated structure and rigging aboard ships has increased the probability of voltages being present on shipboard objects such as running rigging, booms and parked aircraft. Radiation from nearby transmitting antennas may result in voltage levels that are sufficient to cause burns or shocks. These injuries may occur from direct contact with a conductive object or from a spark discharge.

    What are Hazards of Electromagnetic Radiation to Ordinance (HERO)?

    HERO occurs when RFR enters sensitive electrically initiated devices (EIDs), or electro-exploding devices (EEDs) and may lead to triggering an unexpected explosion. RFR energy can enter an ordnance item through a hole or crack in its skin, or through firing leads and wires. First identified in 1958, the HERO risk has increased with the increased power output and frequency ranges found in modern radio and radar transmitting equipment. According to the Navy Safety Center, “EID systems are most susceptible during assembly, disassembly, loading, unloading, and handling in RFR electromagnetic fields.” Ordnance systems are classified into three categories; HERO safe, HERO susceptible and HERO unsafe based on their probability of being adversely affected by the RFR environment.

    What are Hazards of Electromagnetic Radiation to Fuel (HERF)?

    HERF concerns the accidental ignition of fuel vapors by RF-induced arcs during fuel-handling operations. Fuel-handling is defined as the transferring of fuel from one container to another. While the probability of a HERF event occurring is relatively low, accidental combustion is still possible with certain conditions being present. To reduce the probability of a HERF event, a number of measures have been advised for military operations. Included among these are prescribed safe separation distances and securing transmitting radar and communication systems during fueling operations.

    image

    Frequency mask triggering captures signals that violate user defined thresholds. 


    Mitigating RADHAZ Risk Using a Real-Time Spectrum Analyzer

    To mitigate the risks for RADHAZ operations, investing in technology that provides greater RF situational awareness takes on greater importance. A portable Real-Time Spectrum Analyzer (RTSA), such as the Tektronix RSA306B or RSA500 Series, is the perfect tool for intelligent sensing to monitor EMCON compliance and complement RADHAZ safety procedures. The RTSA provides the ability to sense important signals of interest (SOIs) in a crowded spectrum and understand what RF signals exists at any given time. To monitor an area 24/7, capabilities like frequency mask triggering are preferred, as it allows the RTSA to capture any signal that violates set frequency thresholds. This is critical given the potential consequences of an EMCON violation or a RADHAZ event.

    • 21 Jun 2024
  • 2 Ways to Remotely Control a Parameter Analyzer

    r.ngugi
    r.ngugi

    This blog first appeared on the Tektronix website.

    image

    Controlling instruments remotely has become a part of nearly every engineer’s and researcher’s life, whether by working remotely or combining instruments into large test systems. The Keithley 4200A-SCS Parameter Analyzer supports a few different methods of remote control optimized for each scenario. This blog introduces remote control using Microsoft’s Remote Desktop Connection and the Keithley External Control Interface (KXCI).What is Remote Desktop Connection?

    What is Remote Desktop Connection?

    Remote Desktop Connection is a program included in Microsoft’s Windows 10 Operating System. It allows you to control a Windows 10 PC from a remote Windows PC. Because the 4200A-SCS runs Windows 10 natively, you can use this tool to control your 4200A-SCS too! Remote Desktop allows you to take full advantage of the Clarius software’s test and project library, intuitive test configuration and data analysis tools. There is no downtime to develop code and debug code, and previously configured projects and saved data can be quickly accessed. You can also use other Clarius+ Suite tools like the KULT Extension to develop user libraries. Remote Desktop facilitates a seamless transition between working in the lab and working from home.

    How do I use Remote Desktop Connection with my 4200A-SCS?

    Controlling your 4200A-SCS with Remote Desktop Connection is just as easy as controlling any Windows 10 PC. Both computers must be connected via LAN or the internet. For full instructions on connecting, see Microsoft’s support article here.

    Once connected, you can use Clarius to control the 4200A-SCS’s instruments as shown in Figure 1. New runs of a project are stored in Clarius and can be exported from Clarius to either a shared network location or to the 4200A-SCS system, where they can be copied through the Remote Desktop connection. Remote Desktop is a great option if you want to get up and running fast without developing code.


    image

    Figure 1: Clarius viewed through Remote Desktop

    What is KXCI?

    Pronounced “kick-see”, KXCI is an interface included with the Clarius+ software suite that allows you control individual instruments inside the 4200A-SCS from a remote computer. Even though the parameter analyzer comes with easy-to-use interactive software called Clarius, sometimes you may want to control the instruments inside (modules) at a very granular level. This can be the case if the system will be part of a larger test setup that may include other instruments or for certain very specialized tests. Commands from the KXCI command set can configure the modules to make measurements and return the data to the controlling PC for analysis.

    How do I use KXCI?

    To get started, connect your 4200A-SCS to the remote PC through either GPIB or ethernet. On the 4200A-SCS, open KCON (Keithley Configuration Utility) and configure the KXCI settings to the interface you’ve chosen. Once configured, open the KXCI console. The 4200A-SCS is now ready to start receiving commands. The console, shown in Figure 2, contains a message pane for status messages, errors and echoed commands for debugging. There is also a pane for data to be graphed.

    image

    Figure 2: KXCI Console

    KXCI commands are sent from the remote PC via any program of your choice. Several options for programming languages exist, and each have a few requirements to be able to communicate with the 4200A-SCS. Table 1 shows a few examples with any extra requirements to connect with the 4200A-SCS.

    Table 1: Programming Languages to Send KXCI Commands

    Language

    Communication Method

    Requirements

    Examples

    Python (Sockets)

    Ethernet

    Python socket library

    Python (pyVISA)

    Ethernet, GPIB

    NI VISA and pyVISA

    Application Note

    C/C++

    Ethernet

    KXCI Ethernet Driver (provided with Clarius software)

    C/C++

    GPIB

    KUSB-488B USB to GPIB Driver

    LabVIEW

    Ethernet, GPIB

    LabVIEW Driver

    MATLAB

    Ethernet, GPIB

    Instrument Control Toolbox

    Each module in the 4200A-SCS has its own set of commands to control them: Source Measure Units (SMUs), Capacitance-Voltage Units (CVUs), and Pulse Measure Units (PMUs). 

    • The SMU commands enable the user to configure the source and measure functions, timing settings, and initialize the test for measuring DC I-V.
    • The CVU commands control the DC voltage, AC drive voltage, test frequency, timing settings, and other functionality to obtain C-V data.
    • The PMU commands can only control sourcing with the PMU such as the pulse voltage and pulse timing.
    • There are also KXCI commands to call and execute user modules written with the Keithley User Library Tool (KULT) or the KULT Extension on the 4200A-SCS. This extends the functionality of KXCI to measuring with the PMU and controlling external instruments like the CVIV multi-switch.

    Every command for every instrument is described in the KXCI Remote Control Programming Reference Manual. The manual also contains information on configuring KXCI through KCON, program and command usage examples, and error codes. For hands on learning, a training module on KXCI can be found in the Learning Center of the Clarius software under Training Materials. This training contains tutorials to set up KXCI and the programming environment on the PC, verifying communications and example programs.

    Try out the KXCI interface and start learning in the Learning Center by downloading the Clarius+ suite to your own PC for free.

    • 14 Jun 2024
  • Advanced Oscilloscope Analysis – 4 Unique Capabilities with the 6 Series B MSO

    r.ngugi
    r.ngugi

    This blog first appeared on the Tektronix website.

    image

    With the lowest input noise and up to 10 GHz analog bandwidth, the 6 Series B MSO provides the best signal fidelity for analyzing and debugging today's embedded systems with GHz clock and bus speeds. The remarkably innovative pinch-swipe-zoom touchscreen user interface coupled with a large high-definition display and up to eight FlexChannelTm inputs, each of which lets you measure one analog or eight digital signals, the 6 Series B MSO is ready for today's toughest challenges (and tomorrow's too).

    The 6 Series B MSO also delivers simplified, advanced measurement and analysis. Characterize jitter on GHz clocks and serial buses with ease. Bring statistics into your everyday toolkit with integrated measurements. Use the same simple drag and drop action to add advanced and everyday measurements.

    Four unique analysis capabilities in particular help the 6 Series B MSO stand out, including:

    1. Spectrum View Synchronized Multi-channel Spectrum Analysis.

      It is often easier to debug an issue by viewing one or more signals in the frequency domain. Oscilloscopes have included math-based FFTs for decades in an attempt to address this need. However, FFTs are notoriously difficult to use for two primary reasons.

      First, when performing frequency-domain analysis, you think about controls like Center Frequency, Span, and Resolution Bandwidth (RBW), as you would typically find on a spectrum analyzer. But then you use an FFT, where you are stuck with traditional scope controls like sample rate, record length, time/div, and must perform all the mental translations to try to get the view you’re looking for in the frequency-domain.

      Second, FFTs are driven by the same acquisition system that’s delivering the analog time-domain view. When you optimize acquisition settings for the analog view, your frequency-domain view isn’t what you want. When you get the frequency-domain view you want, your analog view is not what you want. With traditional oscilloscope FFTs, it is virtually impossible to get optimized views in both domains.

      Spectrum View changes all of this. Tektronix’ patented technology provides both a decimator for the time-domain and a digital downconverter for the frequency domain behind each FlexChannel. The two different acquisition paths let you simultaneously observe both time and frequency-domain views of the input signal with independent acquisition settings for each domain. Other manufacturers offer various ‘spectral analysis’ packages that claim ease-of-use, but they all exhibit the limitations described above. Only Spectrum View provides both exceptional ease-of-use and the ability to achieve optimal views in both domains simultaneously.

      image

      Watch an overview: Using Spectrum View Spectrum Analysis on Multiple Channels


    2. Advanced Jitter Analysis Quickly Characterizes Clock Signal Quality

      The 6 Series B MSO has seamlessly integrated the DPOJET Essentials jitter and eye pattern analysis software package, extending the oscilloscope's capabilities to take measurements over contiguous clock and data cycles in a single-shot real-time acquisition. This enables measurement of key jitter and timing parameters such as Time Interval Error and Phase Noise to help characterize possible system timing issues.

      Analysis tools, such as plots for time trends and histograms, quickly show how timing parameters change over time, and spectrum analysis quickly shows the precise frequency and amplitude of jitter and modulation sources.

      Option 6-DJA adds additional jitter analysis capability to better characterize your device's performance. The 31 additional measurements provide comprehensive jitter and eye-diagram analysis and jitter decomposition algorithms, enabling the discovery of signal integrity issues and their related sources in today's high-speed serial, digital, and communication system designs. Option 6-DJA also provides eye diagram mask testing for automated pass/fail testing.

      image

      Watch an overview: High Speed Serial and Jitter Test for 6 Series B MSO


    3. Advanced Power Analysis Delivers Fast, Repeatable Power Supply Measurements

      The 6 Series B MSO has also integrated the optional 6-PWR power analysis package into the oscilloscope's automatic measurement system to enable quick and repeatable analysis of power quality, in-rush current, harmonics, switching loss, safe operating area (SOA), ripple, magnetics measurements, efficiency, Control Loop Response (Bode Plot), and Power Supply Rejection Ratio (PSRR).

      Measurement automation delivers measurement quality and repeatability at the touch of a button, without the need for an external PC or complex software setup.

      image

      Watch an overview: Measuring Bode/Control Loop Response of a Power Supply 


    4. Vector Signal Analysis for Examining Modulated Signals

      The 6 Series B MSO, combined with available analysis software, offers cost-effective mid-range performance as either a 4 channel, 10 GHz bandwidth, or 8 channel, 5 GHz bandwidth multichannel, multi-domain Vector Signal Analysis (VSA) solution.

      When analysis needs go beyond the basic spectrum, amplitude, frequency, and phase vs. time you can employ the SignalVu-PC vector signal analysis application. This enables in-depth transient RF signal analysis, detailed RF pulse characterization, and comprehensive analog and digital RF modulation analysis.

      For example, Tektronix’ mixed signal oscilloscope-based approach to 5G New Radio testing, with dedicated digital down converters on each channel and SignalVu-PC VSA software, offers a novel approach to validate 5G NR designs that the traditional RF engineer may not have considered previously due to technical limitations in traditional FFT-based oscilloscopes.

      image

      Watch an overview: 5G New Radio Vector Signal Analysis 

    For more information, visit our website for details. You can also download the  6 Series B MSO datasheet below.imagePDF

    • 31 May 2024
>
Documentation
  • cstanton
    Featured Video
    By cstanton > > over 1 year ago

  • r.ngugi
    Assembling the 2 Series Mixed signal oscilloscope
    By r.ngugi > > over 2 years ago

  • r.ngugi
    Main Group Widget
    By r.ngugi > > over 2 years ago

  • r.ngugi
    Next Gen Tek
    By r.ngugi > > over 2 years ago

  • Matt
    Setup
    By Matt > > over 3 years ago

  • Matt
    Group Intro Widget Content
    By Matt > > over 3 years ago

  • sandratek
    Entdecken Sie die Auswahl an Keithley Power Supplies bei Farnell Element14
    By sandratek > > over 3 years ago

  • FarnellDE
    Tektronix News im Maerz 2013
    By FarnellDE > > over 3 years ago

  • FarnellDE
    Tektronix News im Januar 2013
    By FarnellDE > > over 3 years ago

  • FarnellDE
    Tektronix Automotive Resource Webpage
    By FarnellDE > > over 3 years ago

More
element14 Community

element14 is the first online community specifically for engineers. Connect with your peers and get expert answers to your questions.

  • Members
  • Learn
  • Technologies
  • Challenges & Projects
  • Products
  • Store
  • About Us
  • Feedback & Support
  • FAQs
  • Terms of Use
  • Privacy Policy
  • Legal and Copyright Notices
  • Sitemap
  • Cookies

An Avnet Company © 2025 Premier Farnell Limited. All Rights Reserved.

Premier Farnell Ltd, registered in England and Wales (no 00876412), registered office: Farnell House, Forge Lane, Leeds LS12 2NE.

ICP 备案号 10220084.

Follow element14

  • X
  • Facebook
  • linkedin
  • YouTube