


Introduction
Setting up an IDE for C++ development on the Raspberry Pi Pico is covered in the Getting Started with Raspberry Pi Pico guide. The guide is not surprisingly focused on using a Raspberry Pi as your development machine, although it does cover setting things up using Visual Studio Code on Windows too.
I'd say that it covers everything, but it is a little jumbled and you do have to jump around a little to find your way. Shabaz's excellent Working with the Raspberry Pi Pico with Windows and C/C++ guide is a bit clearer so I'd recommend that if you're starting out. If you follow that (or the official guide) then you should get to the point where you can compile your C or C++ to a uf2 file, reset your Pico by removing the USB cable and holding in the BOOTSEL button whilst you plug it in again. However, I don't feel that a microcontroller has a "proper" Integrated Development Environment unless you can deploy your code from the IDE and use breakpoints to work out where your code is going wrong. If you don't have this, then I feel you just have a nice text editor.
The point of this guide is to get you to a nice place where development is easy.
Your starting point
I'm going to assume that you can already use Visual Studio Code on Windows 10 to compile your code into a uf2 file ready for deployment. Rather than copying in loads of stuff so that this guide is "complete" I suggest you use either Shabaz's guide or the official one (both linked above) to get to this point. By the way, whilst the Pi Foundation have done a good job getting custom silicon produced and have pretty good documentation from day 1, even they have said that their guide can (and I'm sure will) be improved.
Let's tweak a few things
Rather than jumping straight to it, I'm going to walk through a series of improvements you can make to your Pico experience before you get debugging.
Stop wearing out your micro USB port
A number of people have commented on the frustration of constantly reconnecting their USB cable. At the end of this guide you shouldn't have to do that all all, but there are some better options in the meantime. You can purchase USB cables with an inline switch. Here's an example from Pimoroni. Useful, but it seems a bit clunky. You could also solder a simple momentary button from RUN (pad 30 on the right near the RP2040) and a suitable ground (such as pad 28 a couple of pads below) to reset the RP2040. I've seen this breadboard version from the official Pi blog and also this neater one from SKPang on twitter. What are the chances that a reset button will appear on a Pico v2.0 in the future?
Getting Visual Studio Code to work without needing the Developer Command Prompt for Visual Studio 2019
If found this minor requirement to be really clunky. I often open VS Code from a pinned button on the command bar as I also use it for other things. (VS Code is the new Eclipse after all.  ) I may have other things installed, but for me at least it seemed to just boil down to not having nmake on the path. Fire up the developer command prompt for the last time and type where nmake.
Update: It seems that after adding this environment variable, you still need to build a new project once via the Developer Command Prompt. Thereafter you can build from a standard VS Code instance. No idea why this is, but if I find a better solution I'll let you know. I hadn't originally noticed as I was trying this out on a project that had been build already.

This path (not including the nmake.exe) needs to be added to your path environment variable. After that you should be good to use VS Code from anywhere. Try it with a project that compiled before and let me know if it works for you.

Picoprobe
Setting up the hardware
I only had one Pico (which I got from Hackspace magazine) and tried to use both a Segger JLink and a TI XDS110 debugger working before giving up and buying a couple more Picos. I suspect getting the JLink to work is possible, but in order to keep things simple, let's just stick to the Picoprobe for now. All you need to do is grab the picoprobe.uf2 file and flash it to a second Pico. The official guide shows the debugger and target wired up on a breadboard and providing power from pads 38 and 39, but I found that using pads 3 (GND), 4 (SCK) and 5 (SDIO) was more convenient and I powered the target device independently. Here's a picture of my picoprobe wired up to another Pico - along with a nice Pimoroni squishy RGB keypad. Black, white, and grey are SWD debug The purple and blue wires are UART which I'm not using right now. The white USB lead is power only to the target and the picoprobe connected to the black USB lead is loading the running code.

Tweaking USB drivers
As explained in the official guide, you need to make sure that the right USB drivers are being used. Download Zadig from http://zadig.akeo.ie and run it. First select Options / List all devices from the menu. Then you can chose Picoprobe (Interface 2) and make sure it's using the libusb-win32 driver.

OpenOCD and GDB
OpenOCD
The two tools needed to debug C or C++ code on the Pico are OpenOCD and GDB. These are essentially command line tools so we need to get these running happily from the command line before we try to configure Visual Studio Code to use them and provide us with a more usable GUI. The official guide describes pulling down a Raspberry Pi provided openocd repo and building openocd from source with the necessary options to use it with the Pico's RP2040 microcontroller and the Picoprobe. There are a number of confusing aspects to the guide. They tell you to pull down a single branch, but different branches are used depending on whether you are using a Raspberry Pi's GPIO as a debugger or a picoprobe. You also need to set up msys2 in order to get the tools needed to compile openocd. I spent quite a while on this and got very close to getting it working. I eventually had openocd running but it then seemed to then close immediately. Then I spotted a post on the Pico SDK section of the official Pi forums that led me to a github issue that led me to a pre-built and working openocd which you will find here. It's provided by Liam Fraser and his name is all over the commits in the official Pi repo, so no need to worry about where it came from. I recommend you shortcut a lot of hassle. Just download this and unzip it to an openocd_picoprobe folder alongside your Pico SDK.
GDB
GDB is also an essential part of the debugging process, but should have been installed alongside the ARM GCC compiler when you got the main build running.
Testing these from the command line
From a command prompt in th epicoprobe_openocd folder that you extracted earlier, run
openocd -f interface/picoprobe.cfg -f target/rp2040.cfg
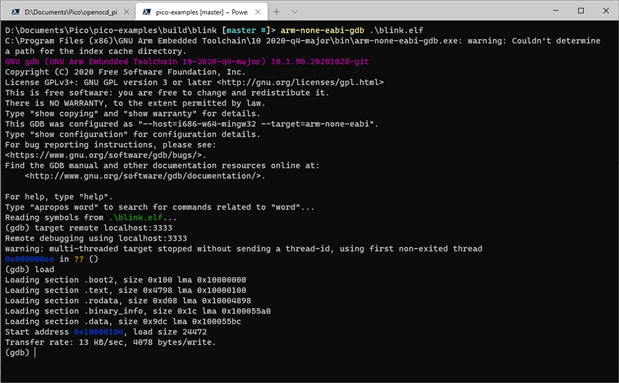
and you should see a display similar to the one below. (My prompt is prefixed with ./ as I'm using PowerShell.) If you get this, then openocd is OK. Leave this running and from another prompt, open a folder where a known good elf file is. I chose the blink demo from pico-examples/build/blink so mine is blink.elf and run
arm-none-eabi-gdb blink.elf
to start gdb. You should get something similar to the next image in the gallery. You can proceed with the following commands at the (gdb) prompt to load and run your code
target remote localhost:3333
load
monitor reset init
continue
| {gallery} OpenOCD and GDB |
|---|
openocd: Running openocd |
gdb: Running gdb |
gdb debugging: Starting to load and debug our code |


This has proven that we have openocd and gdb set up properly. Whilst we could debug our code this way, it's much nicer letting Visual Studio Code manage things for us.
Setting up Visual Studio Code
Now that we can debug, let's debug in style. Open up a project that you know compiles and runs. We'll now configure openocd and gdb within VS Code.
Installing extensions
You may already have some of these extensions - depending on what guide you followed - but make sure that the marus25.cortex-debug, cmake-tools, and Cpp-tools are installed. These can be done from the command line as follows:
code --install-extension marus25.cortex-debug
code --install-extension ms-vscode.cmake-tools
code --install-extension ms-vscode.cpptools
Cortex-Debug configuration
Within VS Code, select File / Preferences / Settings... (or just Ctrl-,) Within the settings page look for Extensions / Cortex Debug Configuration. Trying to change anything will take you to a json file - probably C:/Users/(you)/AppData/Roaming/Code/user/settings.json. You will need to add the entries for cortex-debug.gdbPath and cortex-debg.openocdPath. You can see mine, but obviously your folders may differ.

launch.json
The important settings in launch.json are the configFiles and searchDir parameters which you may recognise as the parameters passed to openocd when we ran it from the command line. I also found that the svdFile entry needed to be a relative path and did not like starting with a drive letter. This didn't seem to affect debugging though.

settings.json
I'm not entirely sure why the recommended settings in the Pico guide hides the build button from the lower tool bar. It seems to be needed - as running a debug session does not automatically rebuild the code. The commented out lines restore this.

Happy debugging!
Now you just need to hit Ctrl-Shift-D (or select the debug tab on the left hand side) and click on the green arrow next to Cortex Debug. gdb and openocd will deploy your code to the Pico and you should hit an automatic breakpoint on the first line of main(). It's all working very nicely for me as you can see in the image below, but whilst working all this out I have gone down dead-ends, installed stuff I don't think is needed, etc. There might be a step I've taken but left out when writing things up. If you have any problem, let me know and I'll update this guide.

Top Comments