Table of Contents
- Introduction
- Software Setup
- Connections
- Running the Examples
- Example Application 1: Generate a Sine Wave
- Example Application 2: Measure Frequency Response
- Example App 3: Chipmunk Effect
- Example App 4: Measuring Total Harmonic Distortion
- Example App 5: Notch Filter
- Example App 6: High, Low, Bandpass Filters
- Example 7: AC RMS Meter
- Example 8: Oscilloscope Graphics
- Example 9: Lock-In Amplifier (Synchronous Demodulator)
- Example 10: AM Demodulation
- Wave Miner Performance
- Creating Custom Apps
- Software Description
- Summary
Introduction
This blog post discusses how to make use of the Wave Miner Digital Signal Processor (DSP) project. It is almost a lab-in-a-box. If you've ever needed to quickly filter signals, generate high-quality signals, perform analyzer-type measurements (not scientific lab grade, but great price-performance for home or educational use because ordinarily, this would require a lot more equipment), then this project could be helpful. There are ten exercises described in this blog post, covering these tasks, as well as some others. The project is easy-to-use; there are web apps and command-line apps, and the code on GitHub (links further below) can be easily extended. I think using a DSP is great for learning about signal processing techniques because users can create their own processing flows and see the results in real-time.

Refer to the first blog post for the circuit diagram and construction details. This blog post focuses on using the project now that it is built. This project requires a Pi, but can also be used standalone if desired after it has been programmed with the Pi.
Software Setup
There are two things to install; command-line waveminer apps, and web apps called webdsp. The software setup takes less than five minutes:
1. Follow the instructions at the waveminer GitHub page. The command-line apps will install in the /home/pi/development/waveminer folder
2. Follow the instruction at the webdsp GitHub page. The web apps will install in the /home/pi/development/webdsp folder
The web applications in step 2 are optional, but they make it simpler to operate the Wave Miner. If you have no Wave Miner board or Pi, it is still possible to install webdsp, since the web apps can run in a demo mode on any Linux machine.
Connections
The photo below shows how the board is connected to the Pi, ready for running the example apps. The Wave Miner board has BNC and stereo 3.5 mm connectors, and either can be used.

For most of the example apps, only one channel (the left channel, i.e. channel 1) is used. Headphones can be plugged in for some of the examples, and therefore the results will only be heard from the left earpiece. For other apps, there may be a need to loop the signal from one of the outputs, into one of the inputs. This can be done with a BNC cable. Another alternative is to use a jumper wire to loop the signal (there are pin headers on the board for doing that).
The DSP doesn't need to be used with audio, any signal within the approximately 10 Hz to 20 kHz frequency range can be processed or generated, so the BNC connections and pin headers are suitable for attaching to other equipment, or for connecting to breadboarded circuits with jumper wires.
Running the Examples
Once you have got the Wave Miner and Pi powered up, the procedure that will be used for all of the examples is listed here; there are just 3 steps:
1. Go to the waveminer software folder (/home/pi/development/waveminer) and type a command to program the Wave Miner board (the xyz.bin filename will be given in each example below):
./eeload -p xyz.bin
2. Power-cycle (reboot) the Wave Miner card, by toggling the power switch left and then right
3a. If the example has no web app, then from the same waveminer software folder you can run (from the Linux command prompt) the executable file (the executable name is different for each example). For instance, this example might set the frequency of the output to be 220 Hz:
./xyz -f 220
3b. If the example has a web app, then go to the webdsp folder (/home/pi/development/webdsp) and run the correct file for the example (the filenames ends in _web.js), for instance by typing:
./xyz_web.js
The output from that command will display what address to type in the web browser.
Example Application 1: Generate a Sine Wave
Push the switch to the right on the Wave Miner to power it up (the Wave Miner gets its power from the Pi GPIO connector, but you can optionally use an external DC supply if desired. There is a jumper on the board to select the power source).
In the waveminer folder, type the following to load up the sinewave tone DSP firmware app:
./eeload -p tone_app.bin
Flick the switch off and on for the firmware to take effect. The Wave Miner is now running tone generation firmware.
Now type the following to send a command into the DSP from the Pi:
./dspgen -a 0.1 -f 200
Plug headphones to the 3.5 mm jack on the front of the Wave Miner (all the connectors on the front are outputs, and all the connectors on the back are inputs) and you should be hearing a 200 Hz tone from the left earpiece. If you want to change the volume, type a value between 0 and 1 as shown here:
./dspgen -a 0.4
That's it! This explains one use-case for the Wave Miner. You can use it to generate fairly precise signals for test purposes.
Incidentally the DSP firmware file, tone_app.bin, contains this functionality:
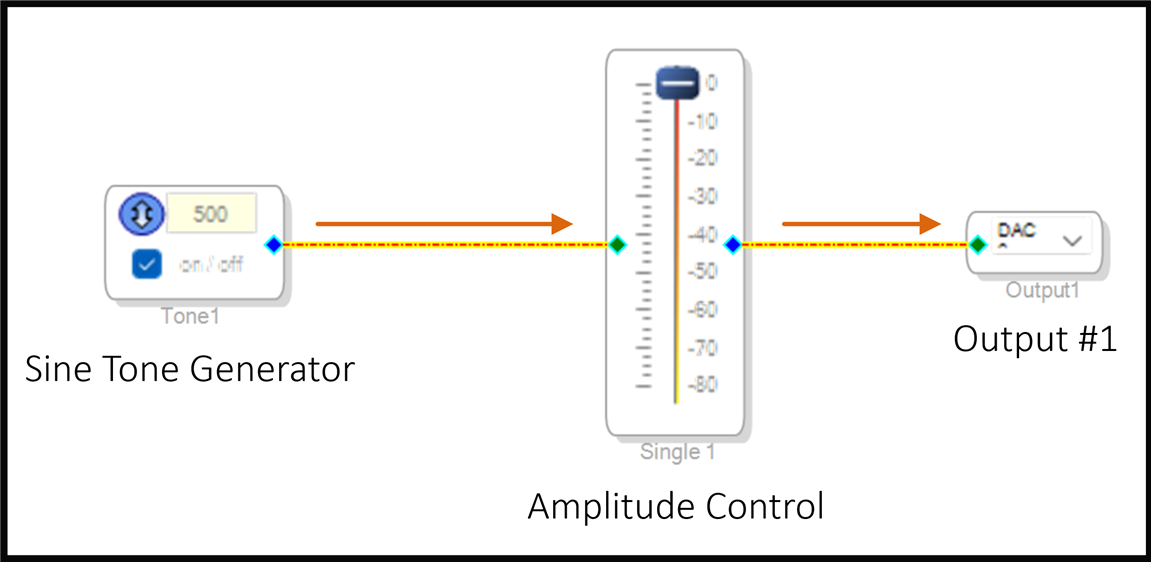
Each item in the diagram above can be considered to be a building block. By assembling them together, a flow is established from the source, which happens to be a sinewave generation module, through to the output module which is the DAC function connected to the first BNC connector and left connection on the stereo jack. There is information on how to create your own flows and firmware later on in this blog.
There is a web app version of this app (with a few more features) too. To use the web app version, type:
./eeload -p dspgen2.bin
Flick the power switch off and on for it to take effect, and then from the webdsp folder (/home/pi/development/webdsp) type the following to launch the web server:
./sine_web.js
Naigate to http://xx.xx.xx.xx:8081/sine.html and the following page will appear in the browser:

The sliders or text boxes can be used to control both channels independently from 0 to 20 kHz. There is also a phase trim slider if required. The amplitudes are adjustable between 0V and 2.6 Vp-p.
Example Application 2: Measure Frequency Response
Connect either a stereo jack plug cable from the front connector to the rear connector on the Wave Miner, or connect a BNC cable from the endmost front BNC connector to the endmost rear BNC connector. With the Wave Miner power switch (the toggle switch on the front panel) turned on, type the following to transfer the Frequency Response DSP firmware app to the Wave Miner:
./eeload -p freqresp.bin
Now briefly flick the toggle switch off and on, for the firmware to take effect and start running on the DSP.
Go to the webdsp folder (the full path is /home/pi/development/webdsp) and type the following:
./freqresp_web.js
Now go to a web browser on the Pi or any PC, and type (change xx.xx.xx.xx to be the IP address of the Pi):
http ://xx.xx.xx.xx:8081/freqresp.html
A display will appear. Click on the Start Test button, and watch the chart get drawn.

That completes the second application. You could disconnect the cable and insert (for example) an audio amplifier or a filter, and rerun the test if desired. It is also possible click the Normalize button first, to flatten the line (i.e., the limitations of the DSP board are removed from the test results). The test data is also saved to the PC, for opening with (say) Excel.

The diagram below shows what the DSP firmware file contains. As with the previous exercise, the firmware has the capability to generate sinewaves. The lower part of the diagram shows how measurements are achieved. The ADC input block is connected to an envelope measurement block which can measure the amplitude of the signal (the assumption is that the input tone is significantly higher than any other signal present). The final block on the right makes the measurement available in a certain register so that the software running on the Pi can access it using the I2C bus.

Example App 3: Chipmunk Effect
Similar to the previous apps, type the following and then power-cycle the Wave Miner using the toggle switch on the front panel:
./eeload -p speed.bin
Connect an audio source (e.g. PC or mobile phone) using an 3.5mm audio cable (or BNC cable), to the input connector at the back of the Wave Miner.
For this example, there is a file that could be used, called shannon-volmet.wav (it is in a folder within the waveminer software bundle). It is a radio recording that happens to have the incorrect pitch. The person speaking sounds too high-pitched (this happens if you set the radio frequency incorrect when listening to a Single Sideband (SSB) transmission.
Plug headphones into the connector at the front of the Wave Miner, and you'll hear the incorrect pitch on the left channel.
Next, type the following:
./pitch -v -0.0005
You'll now hear speech playing at a slightly more realistic pitch.
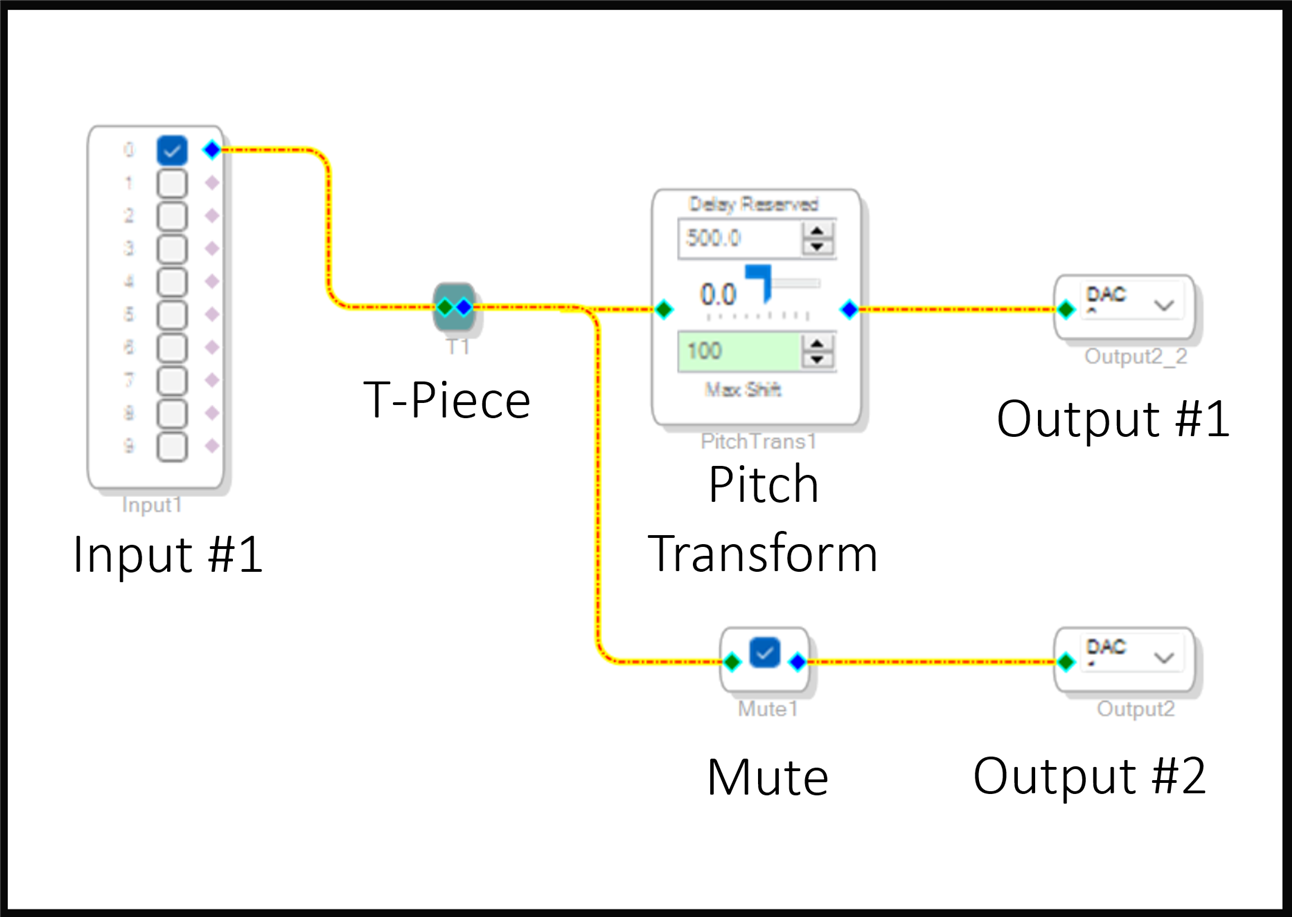
The precise way it works is unknown since this particular example uses an Analog Devices proprietary algorithm. However, a good guess can be made by feeding a known signal (from any custom WAV audio file on your PC, or by using a signal generator instrument) and observing the output.
The screenshot below shows the output when the input is a triangle wave of 500 Hz, and a pitch setting of -0.001. I think what is happening, is that the algorithm captures a number of samples and then stretches them out in time over most of the waveform, but then it has to stitch another set of samples. Since the breaks will be audible, it tries to reduce the impact of that by reducing the amplitude when the breaks occur. With more captures, it may be possible to better understand the algorithm.

Example App 4: Measuring Total Harmonic Distortion
Similar to the previous apps, type the following and then power-cycle the Wave Miner using the toggle switch on the front panel:
./eeload -p peakfilt.bin
Now if you like, build the diode circuit shown here and wire it from the output connector to the input connector. There are some jumper pins on the board you can use to do that, without needing to build up an audio or BNC cable; you can just use an external breadboard and connect jumper wires from the breadboard, straight onto the Wave Miner board as shown in this diagram:

The firmware in this example allows the selection of one of six frequencies to measure THD:
1: 20 Hz
2: 50 Hz
3: 100 Hz
4: 200 Hz
5: 500 Hz
6: 1000 Hz
Type the following:
./thd -i 6 -c -a 1.0
The above line won't make much sense at first glance, but basically, the value 6 means 1000 Hz (one of the six frequencies that can be chosen), the -c means to provide a percentage result, and the 1.0 means to use the maximum amplitude, which is approximately 2.6 Vp-p.
After a while (it takes 20 seconds or so, but there is output on the screen to watch), the THD value is shown, and it should be quite high (around 6%).
You can now try to reduce the distortion by setting a lower voltage. Type the following:
./thd -i 6 -c -a 0.4
The distortion should reduce, to about 1%. Incidentally, the screenshot below shows what the 1% distortion looks like on an oscilloscope, it's not really visually detectable (enabling FFT on a normal 'scope won't easily resolve it either, although there are some newer oscilloscopes that might do it):

The THD application is very experimental, and if it provides distortion values lower than say 0.3%, then you probably should not rely on that value. If you want to use the Wave Miner for more accurate, lower distortion measurements to around 0.005%, then it needs to be combined with a Pi DAQ board. The instructions on how to do that are here: Sound and Vibration Measurement HAT Review (Press Ctrl-F and search for THD to find it on that page). With that method, you can obtain very good, repeatable results. Another good alternative would be to use a sound card.
Still, 0.3% is good enough to at least tell if something is seriously wrong with an amplifier or filter, and then you could move to more advanced measurements with other equipment.
The reason why the THD application is experimental is because the particular DSP chip has limitations in the resolution of data that can be read out, and this limits the performance. Also, the procedure I used is quite slow to provide a measurement because the code dynamically switches filters, and due to the very narrow bandwidth that was desired for the filters, they take time to settle. It occasionally fails or provides false readings due to the settling time, so a single reading shouldn't be relied upon, and several measurements should be taken.
The diagram below shows what the firmware contains. Most of it will be familiar based on the previous examples.

The main new feature is the chain of filters, which are configured under command of the Pi, to overall create a narrow band-pass response.
Example App 5: Notch Filter
Similar to the previous apps, type the following and then power-cycle the Wave Miner using the toggle switch on the front panel:
./eeload -p notch4.bin
Plug in headphones on the front panel of the Wave Miner, and you'll hear a faint 500 Hz tone being generated out of the right channel (channel 2). It's just for test purposes. For now, disable the test tone by typing the following to set it to 0 Hz:
./notch -g 0
Plug in the headphone connector of your laptop or mobile phone to the jack socket on the back of the Wave Miner, and play the file called morse.wav (it is in the waveminer software bundle) which happens to be a recording from a radio. It is a recording of at least three stations transmitting morse code (ordinarily you'd use the radio switched to a very narrow CW bandwidth setting so they are not all overlaid). You'll hear (on the left channel) the recording. One of the stations is louder and makes it harder to listen to the fainter tones. You can almost eliminate the louder station by typing:
./notch -n 425
Now you can more easily hear the fainter stations. The 425 Hz setting was found by trial-and-error.
If you want to experiment with test tones generated with the Wave Miner, you can loop the audio from the right channel output into the left channel input, using a BNC cable.

The notch is configured to be very narrow (a few Hz bandwidth) and can be set to any frequency in the range 40 – 4000 Hz, with 1 Hz resolution. The code supports simultaneously notching two arbitrary frequencies; see the source code to see how to invoke that function if required.
Example App 6: High, Low, Bandpass Filters
Similar to the previous apps, type the following and then power-cycle the Wave Miner using the toggle switch on the front panel:
./eeload -p filter6.bin
You can plug in an audio source into the audio jack at the back of the Wave Miner, and plug headphones on the front connector, and you'll hear audio out of the left channel. To apply a filter, type the following to allow 300-3000 Hz to pass:
./filter -b1 300 -b2 3000
To apply just a high-pass filter, type:
./filter -h 300
To apply just a low-pass filter:
./filter -l 3000
The filter frequencies for this application can be set within the range 25 – 15000 Hz, in 25 Hz steps.
The DSP firmware contains the functionality shown in the diagram below. The filters are configured under command of the Pi to become high-pass or low-pass filters at the desired frequencies.

Example 7: AC RMS Meter
Similar to the previous apps, type the following and then power-cycle the Wave Miner using the toggle switch on the front panel:
./eeload -p rms.bin
Go to the webdsp folder (the full path is /home/pi/development/webdsp) and type the following:
./rms_web.js
Now go to a web browser on the Pi or any PC, and type (change xx.xx.xx.xx to be the IP address of the Pi):
http: //xx.xx.xx.xx:8081/freqresp.html
A display will appear, showing the true RMS value in millivolts. The input can be up to around 1000 mV.

There are situations where it would be preferable to use this application over a normal multimeter; often basic multimeters can only measure true RMS up to a few kHz, and usually do not have the capability to measure within a selectable bandwidth, whereas the web application has buttons to allow the user to choose between popular cut-off frequencies for measurement within a certain bandwidth if desired. When switching between filter values, you will have to wait for the output to settle before measurements are accurate.
The firmware for this application also provides a fixed 200 Hz 900mV RMS signal on the channel 1 output that can be used for self-calibration if desired.
The calibration can be checked (and modified if needed) by looping the output from channel 1 into the channel 1 input. Most multimeters will be able to provide a good measurement at 200 Hz, so that can provide an additional level of confidence in the readings, to confirm that the channel 1 output actually is 900 mV.
The firmware contents are shown in the diagram here. A mean-square measurement is performed by the DSP, and then the Pi software reads and converts that to RMS. To get around the limitations of the low-cost DSP, two measurements are made, one with lots of gain, and the Pi software picks the correct one depending on the measured value. There is also the option in the firmware to simultaneously measure without filtering, but I didn't implement that in the Pi software.

Example 8: Oscilloscope Graphics
This is a fun app, it needs an oscilloscope, however. It makes a ball snake around the screen : ) Similar to the previous apps, type the following and then power-cycle the Wave Miner using the toggle switch on the front panel:
./eeload -p ball.bin
No other code needs to be run for this example, because there are no configuration items.
The DSP app translates a basic shape (a circle in this case, generated by two sine waves 90 degrees out of phase) across the screen by adding a slowly changing value to it. Since the DSP has a DC blocking capacitor on each output, it is not possible to make the ball stop in any position other than the middle of the display.
With a better DSP, it would be possible to (say) rotate shapes too. I'm not aware of any practical use of this..
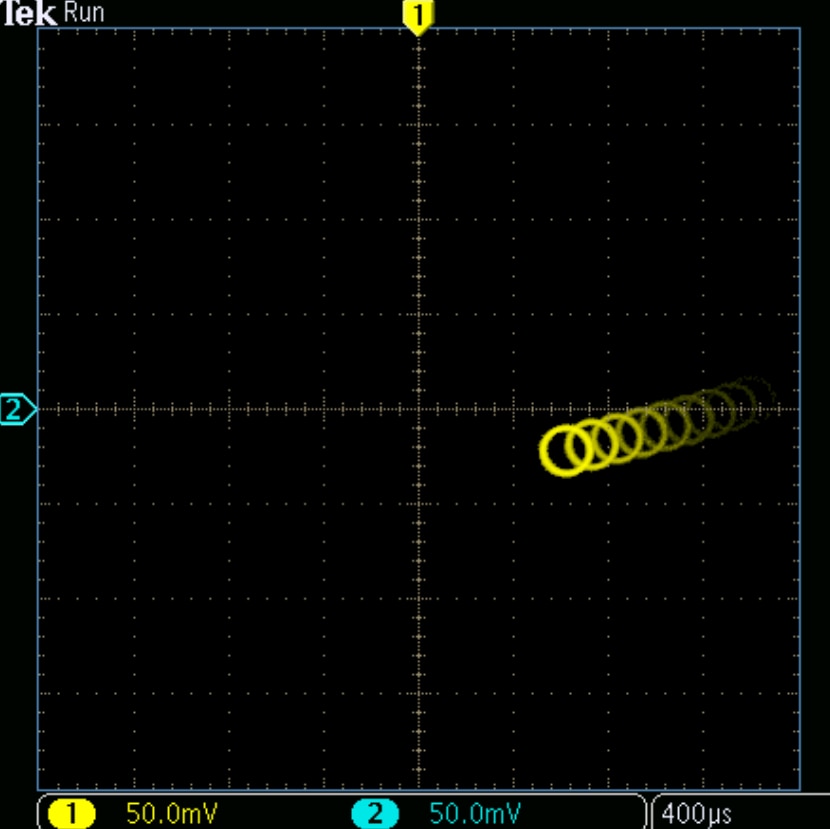
The diagram below shows the DSP firmware contents for this example.

Example 9: Lock-In Amplifier (Synchronous Demodulator)
This example, Lock-In Amplifier (Synchronous Demodulator) is a bit more complicated, but it's quite fun, it can be executed outdoors. To do that, program the DSP just like for the previous examples:
./eeload -p lia.bin
Now the Wave Miner can be disconnected from the Pi, to use the board standalone outdoors. The Wave Miner can be powered from (say) a 9V battery since there is a 7805 voltage regulator on the board.
Wire a battery-powered speaker to the second output channel on the Wave Miner. The easiest way to do this is to disconnect the OUT1 jumper connection on the circuit board, so that only OUT2 is connected through to the output stereo jack socket. The diagram below shows what to do. Connect a wire to the first input channel (shown as a green wire), and push it into the ground (I tested on grass).
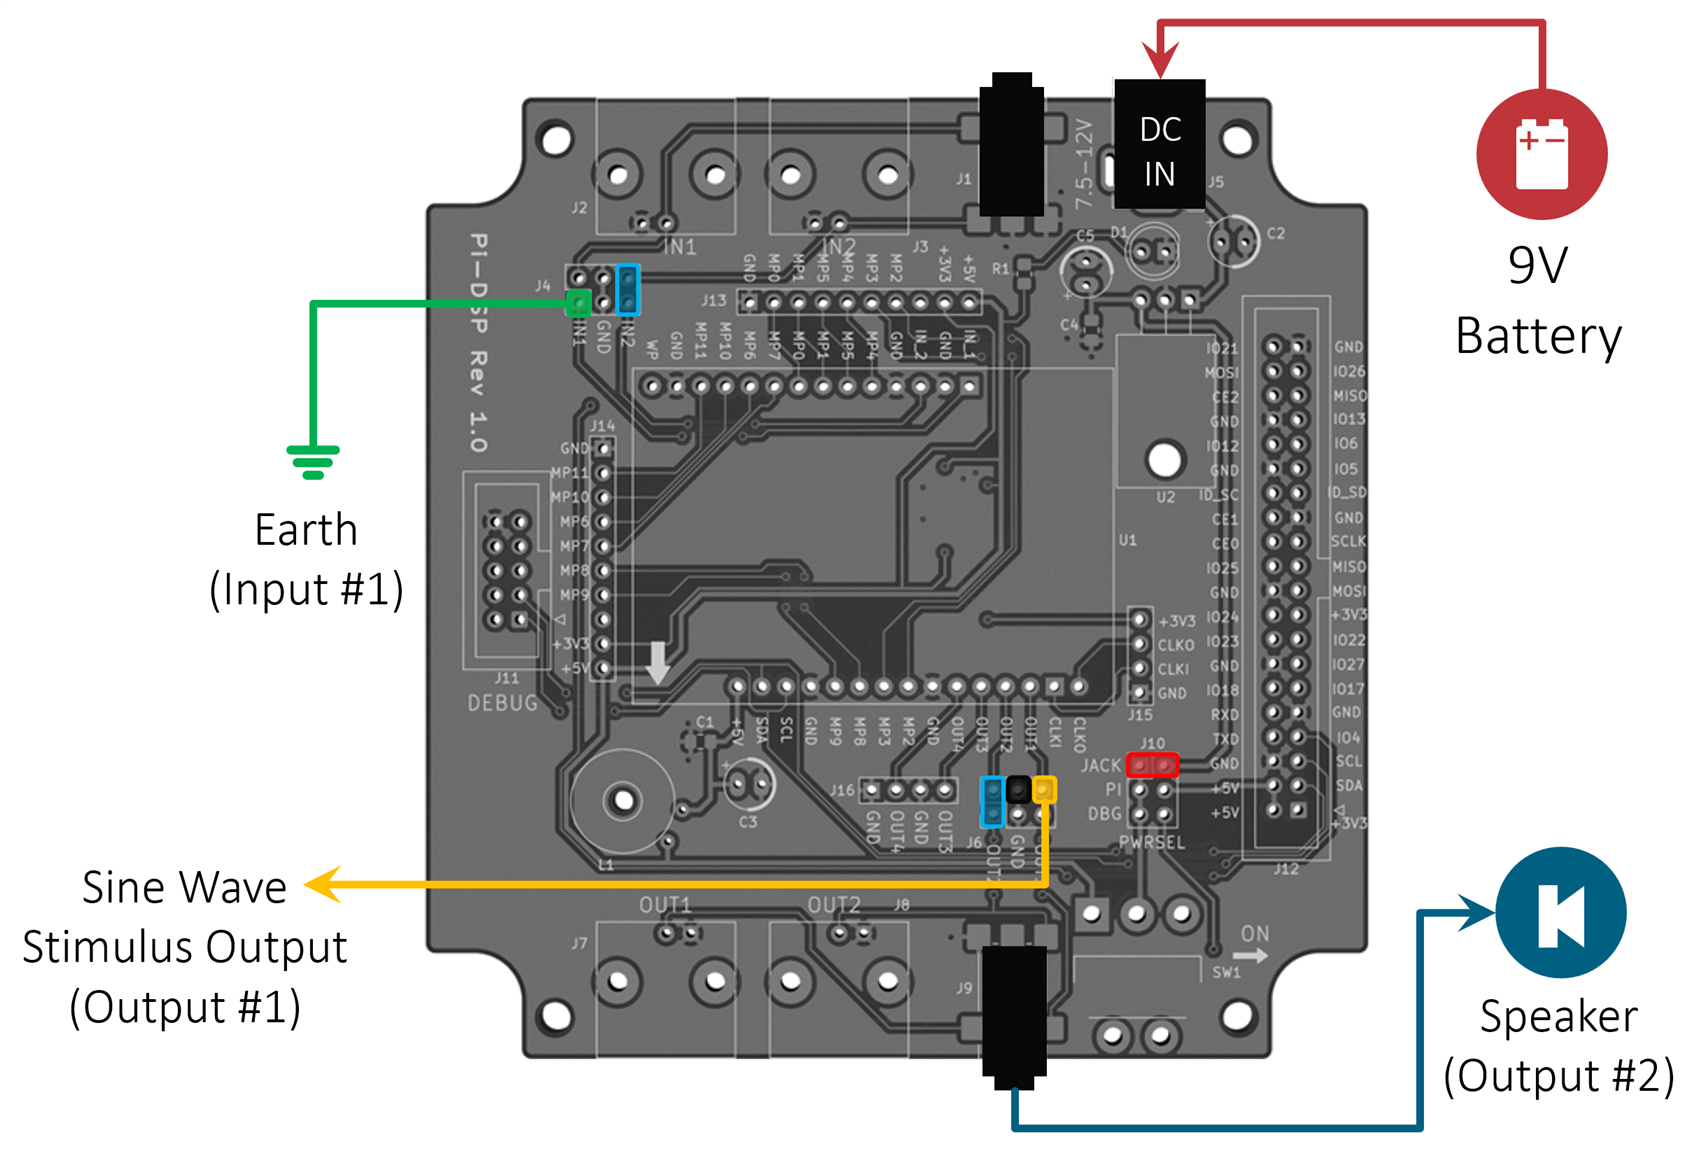
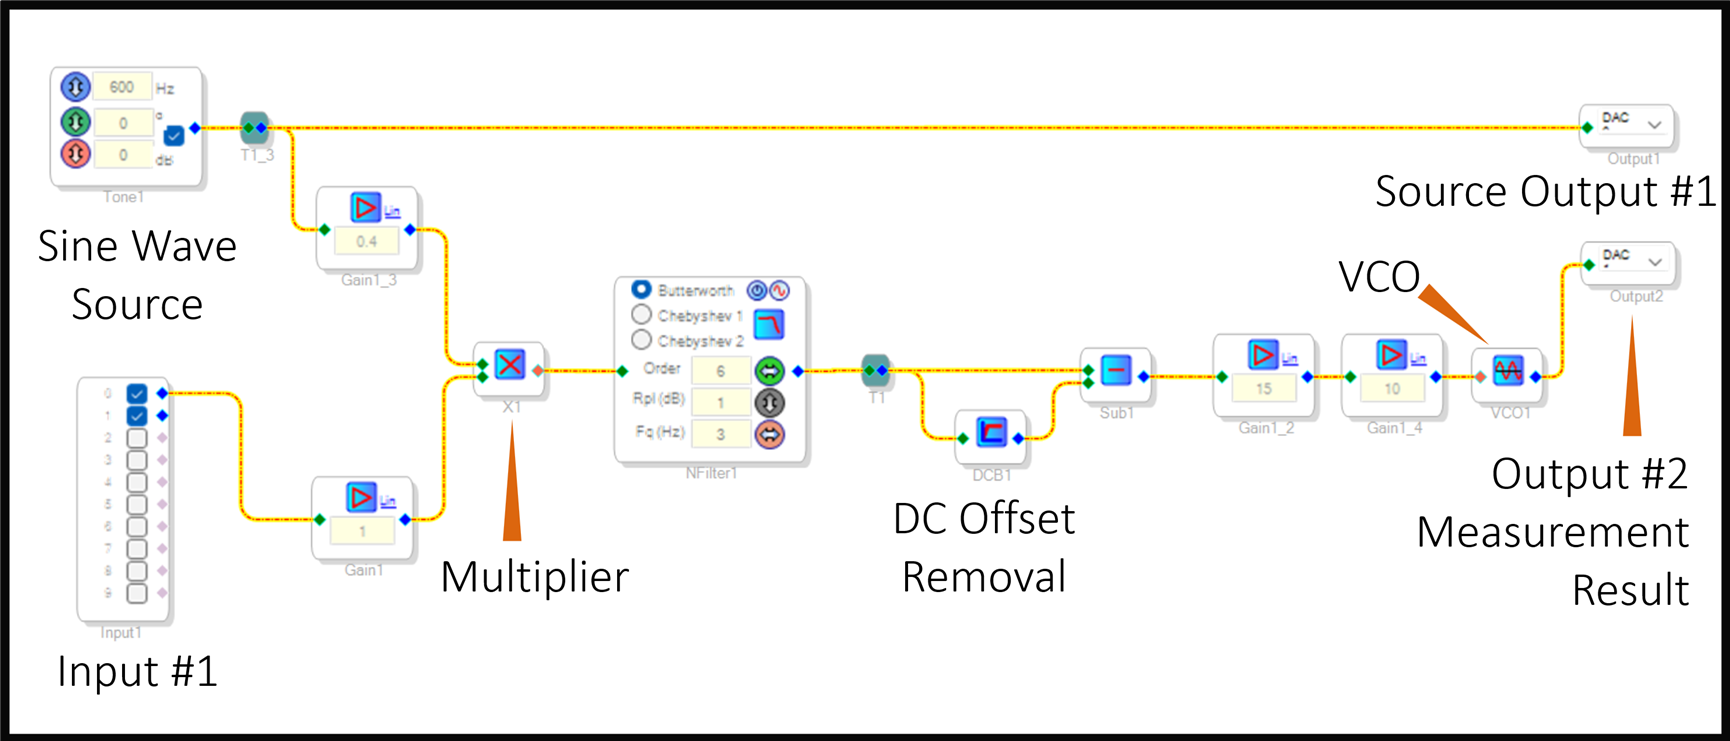
Connect a long wire (10 meters or so) to the second output channel (shown in yellow), and walk as far away as you can, holding the wire. Insert it into the ground, and you should hear a loud squeal from the speaker. This reveals the sensitivity of the lock-in amplifier, that it can detect a weak signal across such a distance.
The diagram below shows what the DSP firmware contains for this example.
Example 10: AM Demodulation
This exercise can be used to build a radio receiver, but it requires the SDR Experimenter Board as well as the PicoSynthRF or a signal generator. Alternatively, any other SDR board that is designed for connecting to a sound card can be used; there are several ham radio projects/kits that should be suitable. When the items are all connected together, an SDR-based AM radio receiver is created.

Ordinarily, the SDR board is used with PC software called SDR-Sharp that performs more sophisticated signal processing with better quality, however, the Wave Miner allows for the entire radio project to be used standalone with no PC or Raspberry Pi attached.
In this exercise the DSP is responsible for accepting the I and Q signal inputs, band-pass filtering them, mixing them down to baseband, and then summing them and low-pass filtering to get the audio output.
The quality could be improved by experimenting and modifying the implementation (I didn't spend long on it, but incidentally the low-cost DSP has limitations – it was not designed for such use-cases, so there is a limit to what can be achieved). Usually this would be hard to do with analog signal processing, but with the DSP different schemes can be tried within minutes.
To try out this project, program the DSP just like for the previous examples:
./eeload -p radio2.bin
After power-cycling the board, audio will be heard from the left channel. Adjusting the frequency that the PicoSynthRF board is set to, will tune the radio.
The DSP firmware block diagram is shown below.

This completes the example DSP exercises for this blog post.
Wave Miner Performance
The DSP module has a very basic filter on the output, and it doesn't perform as well as the datasheet specifies, but it's still very usable.
The charts below show the SINAD, THD and output amplitude flatness for three different output level settings.
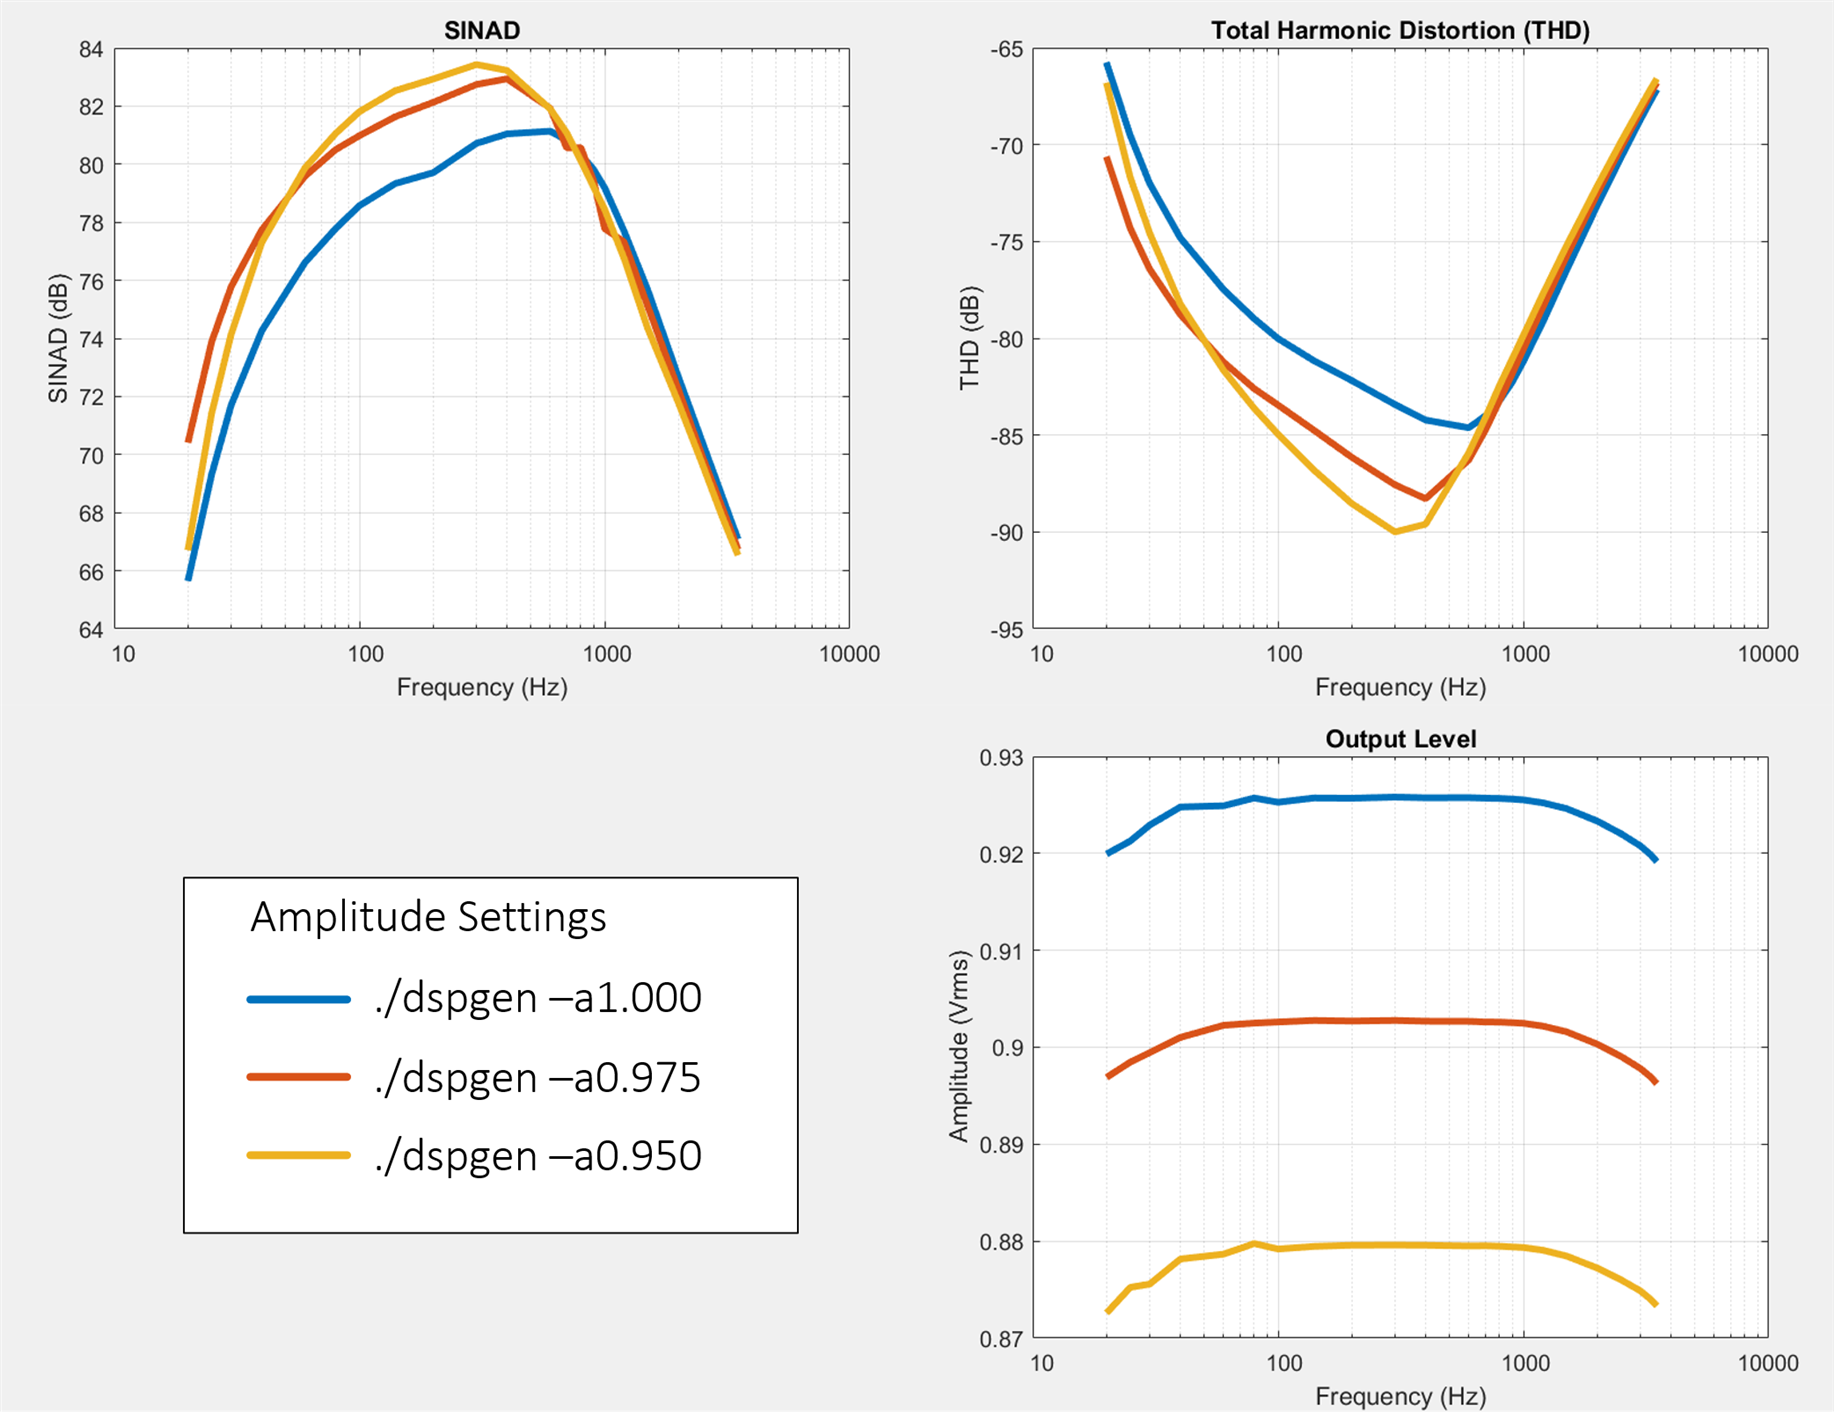
It may be possible to improve things by desoldering the filter components (there is a ceramic decoupling capacitor and passive RC filter on the board, per output) and replacing them with better components or even an active filter, but I have not explored that so far. It is possible to design and fit a custom filter board on top of the PCB in this project, to sit in between the DSP module outputs and the output connectors, by removing the jumpers.
Creating Custom Apps
The DSP firmware is built using Analog Devices SigmaStudio software. The steps to install it and to use it are described here: First Steps with Digital Signal Processing (DSP) Chips.
In brief, to summarize that web link, once you've decided what kind of algorithm or effect or signal generation you wish the board to perform, you'd look up the building blocks to assemble it together, using the free graphical SigmaStudio software. Then, you'd click in SigmaStudio to build up a firmware image (by default called E2Prom.bin) for the DSP board, and transfer that file to the Pi.
SigmaStudio expects a programmer tool to be connected, but it can generate the firmware image without it (even though it displays an error message about the absence of the programmer tool).
To build the firmware after the building blocks have been assembled graphically, click on the Link Compile Download icon. It will display the error message.
![]()
Next, go to the Hardware Configuration tab, and right-click on the DSP name and select Write Latest Compilation to EEPROM. Even though the software is not connected by any programming cable, it will generate the firmware binary in a project sub-folder called xyz_IC 2 where xyz is the project name. That binary file can be transferred to the Pi, and then the eeload -p command can be used as demonstrated in all the examples above.

If you want to control any building block from the Pi, then observe the lower pane in SigmaStudio which displays the I2C bytes as any building block is modified graphically. The Pi software needs to issue the I2C commands as reflected in that lower pane.
The waveminer source code on GitHub encapsulates all the I2C interactions for all the applications into a single file called dsputil.cpp. It already supports some popular objects like sine wave generators and filters, as shown in the examples. If you use a different building block that needs control from the Pi, then the dsputil.cpp file can be modified (and modify the dsputil.h file too).
Software Description
The diagram below explains the general architecture. The webdsp software is a front-end to the command-line waveminer software. The webdsp software provides web pages so that it is easier to use some of the apps rather than typing in a command-line prompt. The webdsp software automatically calls the waveminer software as required.

It is possible to partially run the software even if there is no Wave Miner card or Raspberry Pi. The webdsp software can be installed on any Linux machine, and it can operate using dummy data if no Wave Miner card is attached (no waveminer software needs to be installed in that case).
The waveminer software uses I2C to talk to the Wave Miner board. The i2cfunc.c file contains the low-level functions to achieve this (it supports the Raspberry Pi 4, but by making a change to register addresses called PERIPHERAL_BASE or I2C_BASE in the i2cfunc.h file, earlier Pi models can be supported).
The high-level DSP interactions occur through the file called dsputil.cpp, which calls the I2C functions as required. All of the example applications make use of dsputil.cpp.
Summary
The Wave Miner project uses low-cost hardware to implement a variety of user-configurable functionality for working with signals. The example applications allow for the project to be used as a mini lab, with a high-quality signal generator, or for signal measurement or signal manipulation purposes, using command-line and web-based apps. The board is quick to build (half a day) and the software can be installed within minutes, for use with the example applications that were created. Custom applications are easy to create using graphical building blocks.
Thanks for reading!


