RoadTest: Sign Up to Roadtest the ADI ADALM2000 Data Acquisition Module
Author: saadtiwana_int
Creation date:
Evaluation Type: Test Equipment
Did you receive all parts the manufacturer stated would be included in the package?: True
What other parts do you consider comparable to this product?: Digilent Discovery 2, Digilent Discovery 3
What were the biggest problems encountered?: The Scopy software needs polishing. Some features from ALICE are not yet ported to Scopy (and I couldn't get ALICE to work with M2k)
Detailed Review:
When it comes to exploring the fascinating world of electronics and engineering, having a reliable, versatile and (very importantly) convenient tool can make all the difference. The ADALM2000 promises to transform the way we learn, prototype, and experiment with analog and digital circuits. Packed with features and designed to cater to both beginners and experts, it combines the functionalities of multiple analog and digital instruments, all conveniently condensed into a single portable device. The datasheet/brochure boasts the following features:
The ADALM2000 accomplishes providing all these instruments by using a set of base hardware building blocks, complimented by clever software utilizing this hardware to provide higher level functionality to the user.
Recently, I had the opportunity to get my hands on the ADALM2000 from Analog Devices Inc. (ADI), as part of element14's roadtest program, and it's safe to say that this compact device has left a lasting impression, as well as earning a permenet place on my desk (and bag). In this review, I will dive into my personal experiences with the ADALM2000, exploring its hardware, user-interface, practical applications, and overall performance, to determine whether it truly lives up to its claims as an invaluable tool for electronics enthusiasts, professionals and learners alike.
I'd like to provide a brief background on my experience in the domain, as our prior knowledge plays a crucial role in shaping our perspectives on devices:
For this reason, I was super excited to receive the ADALM2000 as it promised to give a major boost to my home-testing needs. Little did I know I would end up using it quite a bit at work too, just because of how convenient it is to use.
The kit came well packed, thanks to the element14 team.
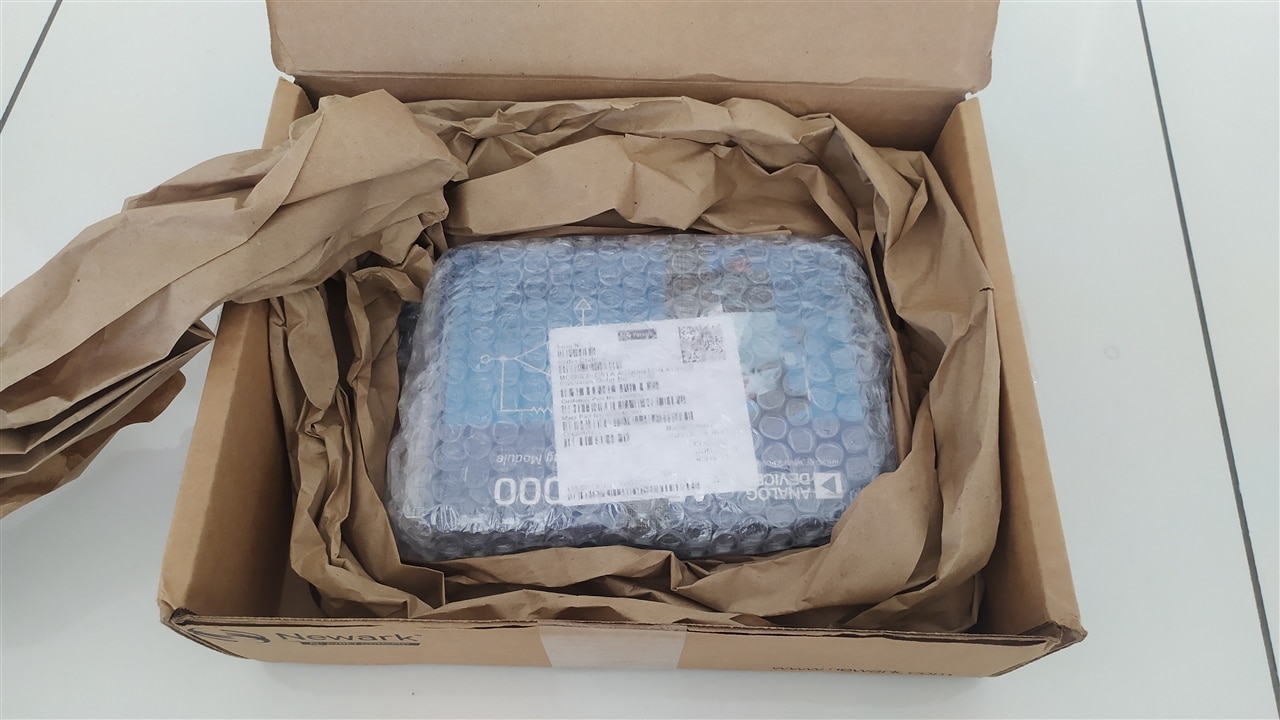
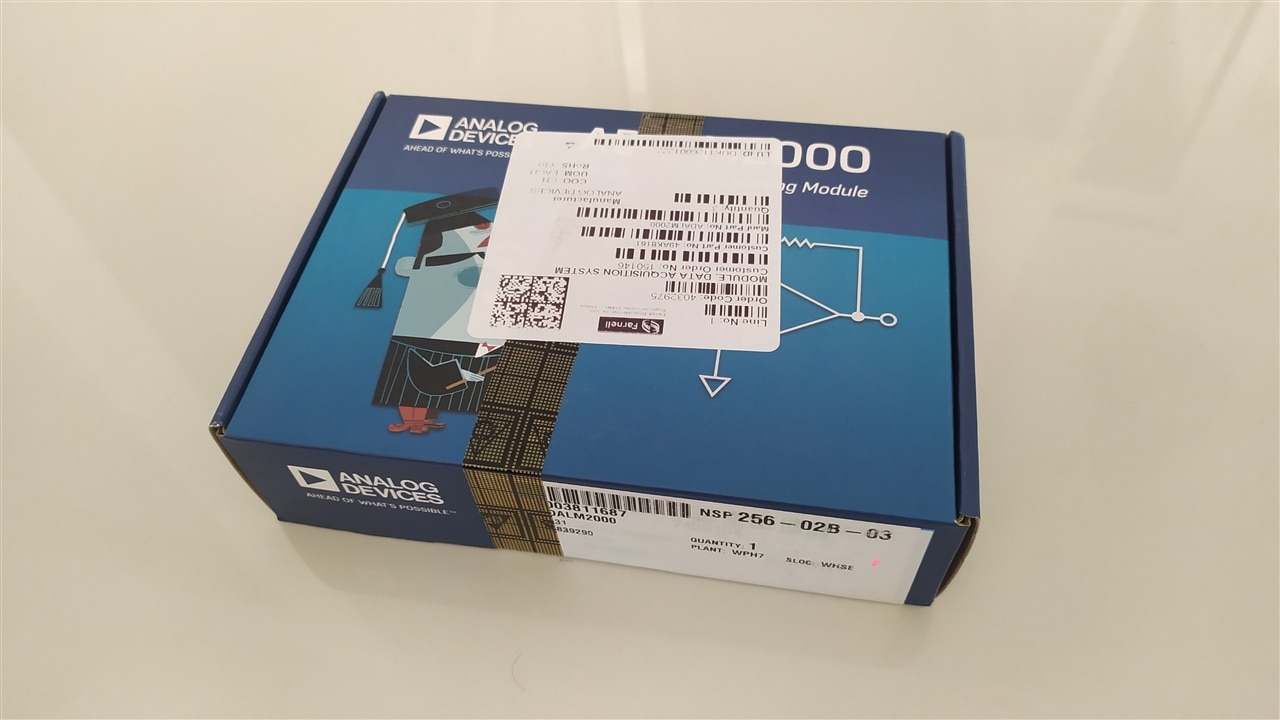
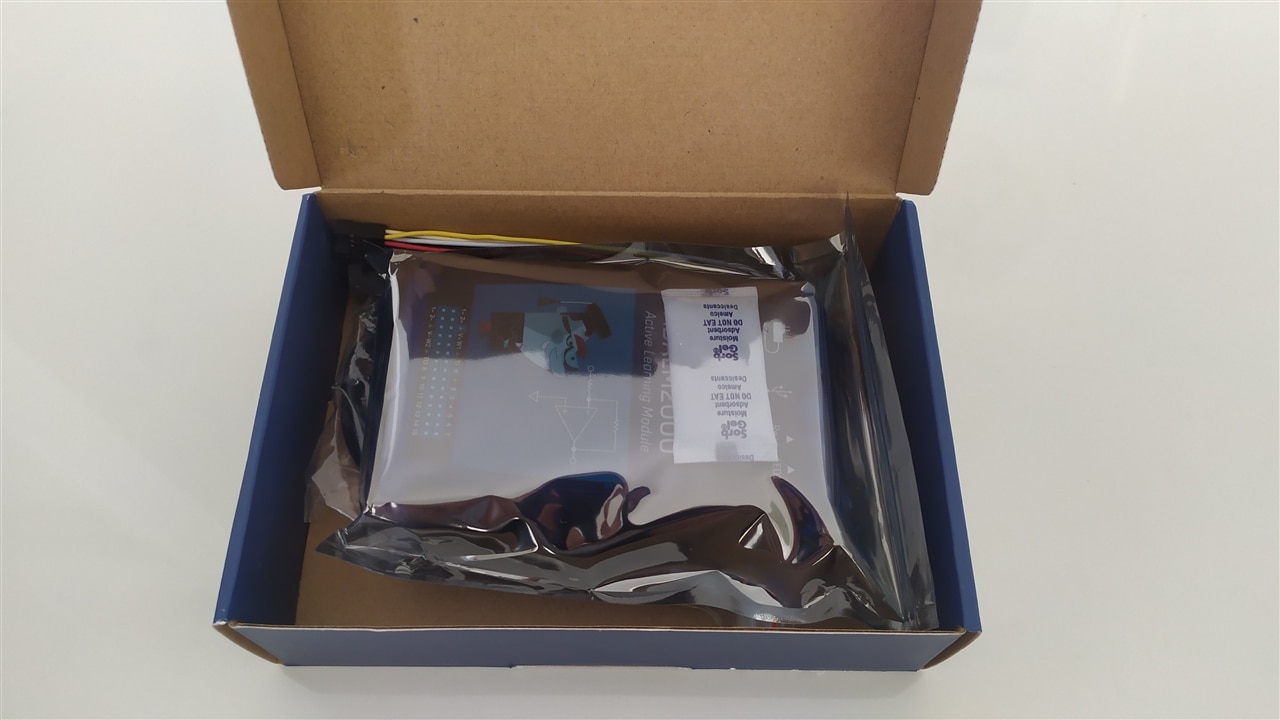

The contents of the ADALM2000 box include:
Few initial impressions & observations:
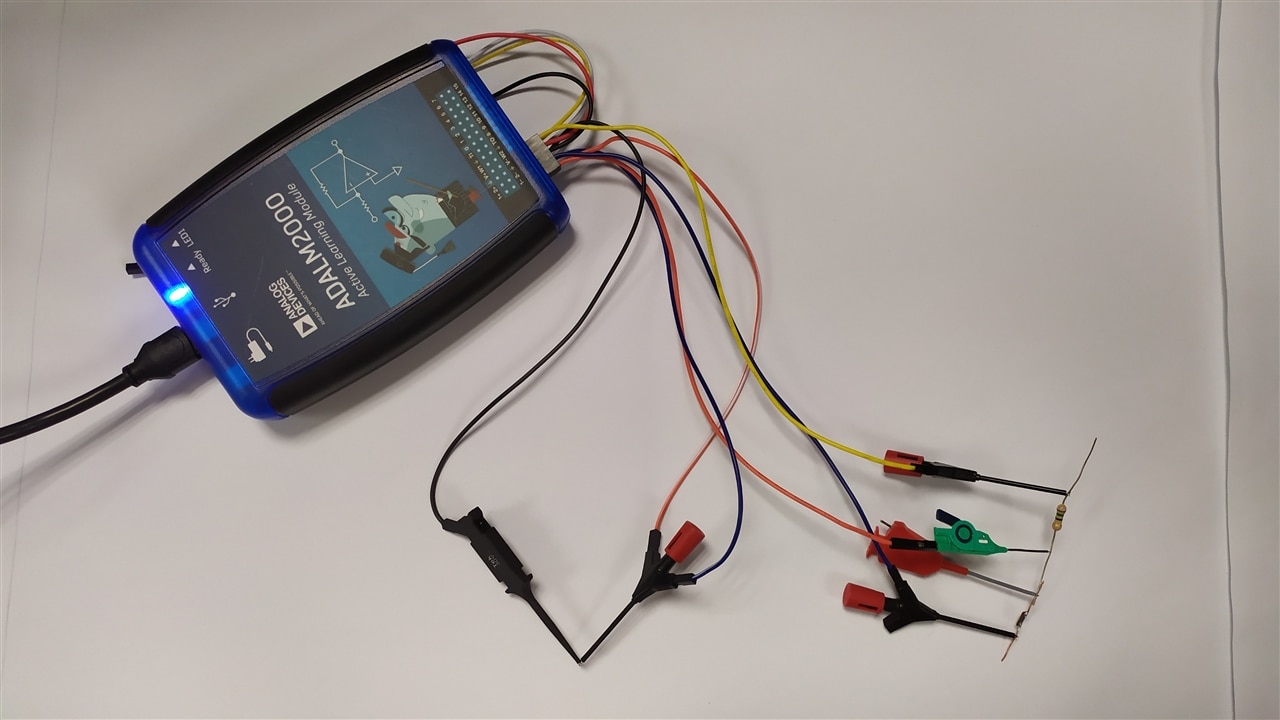
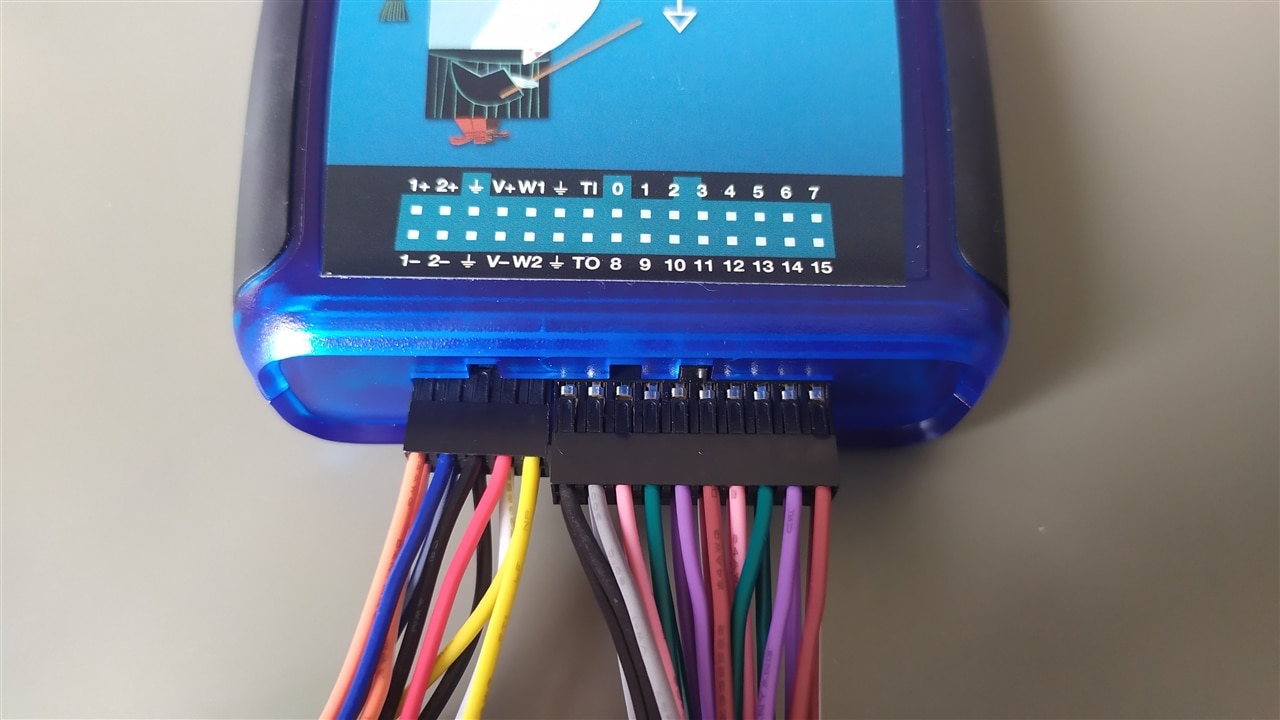
I think the main comparable devices to the ADALM2000 in the market are the Digilent's "Analog Discovery" series of devices.
When I received the ADALM2000, the Analog Discovery 2 was the latest version available from Digilent. During the course of my review, Digilent released the Analog Discovery 3, which is the successor to it's older sibling (AD2).
The three devices are quite similar to each other so instead of listing a full comparison I will only attempt to point out the differences for easier comparison:
| Feature | ADALM2000 | Analog Discovery 2 | Analog Discovery 3 | Remarks |
| ADCs | 12-bit, 100 MSPS, 15Mhz bandwidth (with BNC adapter) | 14-bit, 100 MSPS, 10Mhz+ Bandwidth (30Mhz with BNC Adapter) | 14-bit, 125 MSPS, 30Mhz BW (with BNC Adapter) | I want to point out that I found different specs on "Bandwidth" in different places, and they also change depending on whether the BNC adapters are used or not. So take these with a grain of salt. |
| DACs | 12-bit, 150 MSPS, 30Mhz bandwidth (with BNC adapter) | 14-bit, 100 MSPS, 9Mhz Bandwidth (12 Mhz with BNC Adapter) | 14-bit, 125 MSPS, 12Mhz BW (with BNC Adapter) | <Same as above> |
| Power supplies | 0 to +-5V, 50mA/ch | +-0.5 to +-5V, 700mA/ch (with external power) | +-0.5 to +-5V, 800mA/ch (with external power) | The ADALM2000's power supplies can be beefed up to 700mA using an add-on board with external supply |
| PC connection port | USB-micro-B | USB-micro-B | USB-C | |
| Embedded OS | Runs embedded Linux | No embedded Linux | No embedded Linux | |
| FPGA | Zynq 7010 | Spartan-6 (6SLX16) | Spartan-7 (XC7S25) | Zynq 7010 has dual core "hard" A9 processors. Spartan series have no hard processors. |
| Firmware Source code | Open | Closed | Closed | The Analog Discovery series seem more geared towards end users (only) while the ADALM2000 also keeps the more advanced users in consideration. |
| Schematics availability | Open, publicly available | Not available | Not available | |
| Standalone operation (without a PC) | Possible | Not possible | Not possible | The embedded linux makes it possible for ADALM2000 to run scripts natively. Useful for data logging or for running scripts unattended. |
| Remote operation options | Ethernet-over-USB, Wifi using external USB-Wifi dongle | Always needs a host PC | Always needs a host PC | The embedded linux makes it possible for ADALM2000 to work with USB wifi dongles. |
| Application Software | Scopy (Windows, Linux, Android, OSX) | Waveforms (Windows, Linux, OSX) | Waveforms (Windows, Linux, OSX) | No Android support on Digilent Waveforms. Both Scopy as well as Waveforms have "Demo" modes available for anyone to try the UI without needing hardware. |
| Approx List Price (US$) | 240$ | 299$ | 379$ | Prices from respective Analog Devices and Digilent websites. May be different on distributor websites. |
Overall, the ADALM2000 provides the lowest barrier to entry due to its lower price. Generally the devices have similar features, but some differences are there with each device having its own strengths and weaknesses. Overall, the ADALM2000 is a very solid offering for the price. I especially like the fact that the hardware and firmware are Open Source in case anyone wants to dig deeper or use it as a basis for designing their own system.
As I mentioned earlier, the package does not come with a booklet or getting started guide. So when I opened the box, I initially wondered what would be the best place to get started. My initial plan was to look up the official product page for software to install. However, when I plugged the device into my PC, it appeared as a drive in my computer. Inside this drive, I saw a "info.html" web page. It turned out that this file (a local webpage) serves as a decent starting point for this device (although it would still have been nice to have a small booklet/getting started guide in the box).
This local webpage includes information on:
- Getting Started (updating firmware, installing drivers, Scopy software)
- Frameworks (Info and links to support packages for using the ADALM2000 with Scopy, MATLAB, LabVIEW, Gnu Radio, ADI-LibM2k interface library, IIO commands)
- Firmware (Gives link to download latest firmware (also auto detects the current firmware and tells you if it's not the latest. Also retrieves and displays device's version info, device configuration settings, wireless/wired LAN settings, etc)
- Help and Support (Links to AD's virtual classroom and a link to online help wiki)
I noticed that the online help page link was wrongly pointing to the Pluto SDR help page instead of ADALM2000 help page. Anyway, at this stage, I was mostly interested with getting the device updated with latest firmware and getting started quickly. Under the "Firmware" section I could see that my device shipped with v0.27 while a newer version v0.31 was available.
I clicked the "Download version v0.31" button and that took me to the GitHub page for the v0.31 release which detailed the summary of fixes for the GitHub release as well as a bunch of files for download related to this release:
However, unfortunately there were no instructions on this page regarding which files to download and how to update the firmware after downloading those files.
So I went back to the "Getting started" section on the "info.html" webpage, which looked more promising:
For a moment I thought clicking the "Firmware" hyperlink in step 1 will do the trick, but instead it took me back to the "Firmware" section that I had looked earlier .
Anyway, this time I noticed the words "For help upgrading firmware, check out the online documentation." This had a hyperlink to an online documentation page that detailed the firmware upgrade process.
Roughly, it consisted of the following steps:
1. Download the (first) zip file from the GitHub release page.
2. Unzip and open to make sure it has the required files as described on the page
3. Copy the "m2k.frm" file (only) onto the mass storage device, and then eject it. Ejecting in this case meant right-clicking the Mass Storage device and clicking "Eject" and NOT physically disconnecting the device from the PC (which will make it lose power). This done, LED1 (on the ADALM2000) started blinking rapidly for some seconds and then went back to normal. At this point, I unplugged the device and plugged it back again. Now going back to the "info.html" inside the "M2k" mass storage drive, I could see under the "Firmware" section that I was now running the latest:
With the firmware updated, I now needed to get the necessary drivers and application software installed. So I went back to the "Getting started" section on the "info.html" page to:
- Install the drivers (PlutoSDR-M2k-USB-Drivers.exe) - it seems that Pluto SDR and ADALM2000 use the same drivers! Installing these was simple.
- Install Libiio for windows
- Install Scopy - You have the option to download the .exe which is an installable version, or the .zip which is a portable version as it doesn't require installation. I tried both. Either takes ~1GB of disk space.
The above three steps were simple as the required files were downloaded directly from the hyperlinks.
At this point, installation was complete. I launched the "Scopy.exe" application from the Scopy zip file (after extracting the zip), and I could see that the ADALM2000 device was detected.
We finally have a working Device....Hurray!
Documentation is perhaps one of the most important things for such devices, and has the potential to make or break a product. Devices that offer good documentation (and examples) always end up being more popular with developers, hobbyists, and academics alike.
One very major positive point about the ADALM2000 is that Analog Devices has made the Schematics available to everyone. As a user, this is very good because I can find answers to many questions about the device by just looking at how the particular hardware is implemented. For example, I was wondering why there is the 50mA limit on the Power supplies, and since the schematics are open, I quickly looked through the schematics to see that it's because these use ADA4805-1 (low noise amplifier) for the user power supplies, which can source/sink this much current at max. For comparison, I couldn't find the schematics for the Analog Discovery series of devices. For me personally, this is a plus for ADALM2000 and I'm sure many engineers will agree!
The schematics and other hardware information, including even the Cadence PCB project and board files for ADALM2000 are available at https://wiki.analog.com/university/tools/m2k/devs/hardware
Also keep in mind that all the firmware for the ADALM2000 is also open and made available via GitHub. This is awesome!
The ADALM2000 is built as a "Learning Module", and so Analog Devices has generously made available a huge wealth of information in the form of "Lab Activity Material" for free!!!. Over the past few years ADI has added so many lab activities that if you were to go through one every day it would take you at least 84 days to just finish these! The activities are divided into few categories:
In fact some of these activities (or "Labs") actually consist of multiple sub activities, so they are sure to keep a curious mind occupied for a long time! Personally I am really amazed by this wealth of hands-on materials covering such a diverse range of topics. Absolutely Amazing!
One thing I want to mention here is that while you could source/build your own components for these activities, the best way to go about would be to pick up one of the ADALP2000 kits. For about 110US$ you can save yourself the hassle of gathering components separately and it sure will save you a lot of time! I noticed that most of the training material actually refers to components in this kit. Personally I didn't have the ADALP2000 kit during the review period but if I had to do it again, I would get it right away. Regardless, since I had quite a few components from before, I was able to follow along several activities with my own components and had a lot of fun doing that!
I encourage you to visit the official wiki page (https://wiki.analog.com/university/courses/electronics/labs ) to see the full list of these activities. I think just the value of these training materials is enough to justify the price of an ADALM2000 for anyone! And afterwards you get to keep the ADALM2000 device too!
Most of the documentation for the ADALM2000 is made available via online wikis. Generally I found the information sufficient for most of the things I've looked for, so far.
One thing I noticed noticed time and again during my roadtest was that in many places the online documentation refers to ADALM-PLUTO, while that information is also relevant to the ADALM2000 (aka "M2k"). It would be nice if these wiki pages get updated over time with both names. This would also improve search results for relevant information. As an example, when searching for compatible WIFI adapters for the ADALM2000, i didn't get any hits on google. However, when I instead searched for the ADALM-PLUTO compatible WIFI adapters, I immediately got to the relevant page. I realized later that this page was actually referring to the ADALM2000 by it's shorter name "M2k" which is why it wasn't appearing in search results. As I understand, both the ADALM-PLUTO and ADALM2000 are built on some common building blocks (The Zynq 7010 being a major one) so a lot of information applies to both devices.
One thing I especially like in Scopy is that when you have any instrument open, you get a "See more info" button on the top left.
If you click this button, it takes you directly to a wiki webpage, that serves as a user guide for that particular instrument. Also, included on all these pages is a video tutorial from ADI which I found very helpful. In some cases, these tutorials were a life saver because there are cases were I found that the Scopy user interface is not the most intuitive. For example, I couldn't initially figure out how to group the channels in the Pattern generator, and the video tutorial came to my rescue. Similarly when using the Logic Analyzer, I couldn't initially figure out how to assign a protocol decoder to a channel, and got my answer from the video tutorial afterwards (you need to select the channel/group in the display window first). This didn't look too good on the UI design, but thankfully the documentation made up for it!
The video tutorials are available on Analog Devices' YouTube channel. The full ADALM2000 playlist can be watched at the following link:
(99) ADALM2000 Videos - YouTube
The ADALM2000 provides several options in terms of connecting with the host computer. This makes it very useful for lab/field use scenarios where you can't always have your PC connected to the device directly.
Since the device built with a Zynq 7010 FPGA which has dual core A9 "hard" processors inside and running Linux, this has opened up some interesting connectivity possibilities via the "USB On-The-Go" function. This is where the the ADALM2000 gets even more interesting.
Overall, there are 4 ways you can connect the device to a host, plus a 5th bonus way!
1. USB
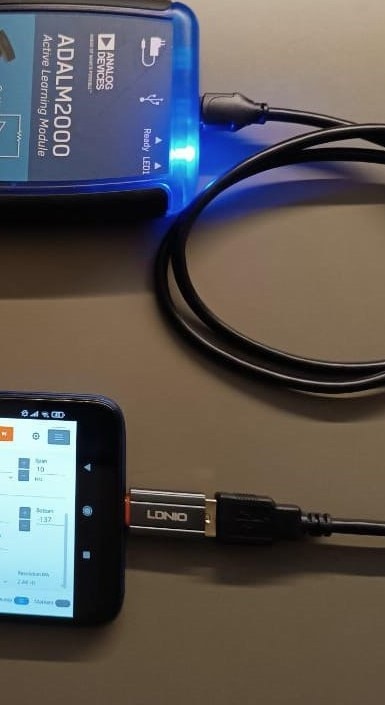
This is the simplest, easiest and most common method that most people will use most of the time. Once the drivers are installed, this works flawlessly over a USB cable. The device comes included with a USB-A to USB-micro-B cable. However, if your computer/tablet only has a USB-C port available, then a USB-C to USB-A adapter works very well!
2. Ethernet over USB via Host
When you connect the device to your computer, it appears as a USB disk drive. Inside this disk drive, there is a config.txt file.
Inside this file we can configure three different types of network connectivity. The first one requires no additional hardware, while the next two require respective (supported) USB dongles.
The first one "NETWORK" is the settings for Ethernet over USB via the host. Once you configure it, and follow the few steps at the top of the file, the device will appear as a Ethernet device on your host computer. This means now it's on the network and as long as you have the network configured appropriately, you can access the device from another computer on the same network. Basically the host PC (which could be a Raspberry Pi even!) is just acting as a network adapter...sort of. I was able to get this working in no time, and it didn't require any additional hardware. Now whenever I connect the device to my computer's USB port, it appears as a Ethernet connection on my computer. This does not interfere with the normal USB functionality needed to use the device via Scopy.
3. Ethernet over USB - Standalone
For this one you need a USB-to-Ethernet adapter, and then you need to configure the "USB_ETHERNET" section of the config file. I didn't have a dongle available so I couldn't try, but the option is there. The good thing about this one is that you don't need to have a host connected to the device (unlike the previous option). Since the middle USB port will get with the dongle, you can use the off-center USB port on the ADALM2000 to power up the device.
4. WIFI over USB - Standalone
Like the previous option, you don't need a host for this mode also. For this to work, you need to source a supported USB-WIFI dongle, and then edit the "WLAN" section of the config file accordingly. Due to the limited flash space on the device, the developers chose to support a limited set of WIFI chipsets. Any dongle that uses one of those should work. The support list of chipset can be found on one of the wiki pages
More details can be found on the Pluto USB-OTG wiki page: https://wiki.analog.com/university/tools/pluto/usb_otg_host_function_support
5. *Bonus* 100% Standalone operation
Did I mention a 5th bonus option? Well, again thanks to the Linux running natively on the device itself, you can run some applications on the device itself without requiring any external network connectivity or needing to connect to a host computer. The device only needs power and will keep running your scripts as long as the power is there! This is very helpful for logging applications. I found a short video on the ADI official YouTube channel that describes the process very well, so instead of replicating the process here, I will just leave a link here:
https://www.youtube.com/watch?v=-QblCcu9x_o&t=284s
Needless to say, I was able to follow along with the tutorial and replicate the logging experiment without any issues. This is one of the features I will definitely be using for some long running tests for work, in future.
As a final word, I want to briefly mention here that, to my best knowledge, in comparison to the ADALM2000 you always need a host computer connected directly to the Analog Discovery series of devices so this is a huge plus point for the ADALM2000.
The main app that Scopy is intended to be used with is the "Scopy" application from ADI. The same app is available for Windows, Linux, Mac OS as well as Android. The full list of compatible OS can be seen from the files on the release page:
Releases · analogdevicesinc/scopy · GitHub
Sorry iPhone users...no iOS!
So far I have tried Scopy on Windows and Android and both worked effortlessly without any issues. Since for most of the roadtest I used the Scopy Windows app, my observations are mentioned in the relevant sections in this review and I will refrain from repeating that here. I'll just say here that Scopy is very usable application and although it leaves room for improvement/polishing, overall it will get most of the things done in today's form.
During the course of this roadtest I found that previously ADI had made available the "ALICE" app for ADALM1000. From my understanding, the version 2.0 of ALICE is supposed to work with ADALM2000, as per the wiki page dedicated to ALICE for "M2k" (ADALM2000). The wiki page is available here:
Active Learning Interface (for) Circuits (and) Electronics for M2K: [Analog Devices Wiki]
However, even after multiple attempts of following the instruction on the wiki page, I couldn't get it to work as I was getting an error that libiio wasn't found.
I did make sure that libiio was installed and that it could even see the ADALM2000 devices but it somehow didn't work (I tries on 2 PCs!)
The reason I wanted to try ALICE was some interesting extra features I saw in the ALICE specifications that are not (yet?) implemented in Scopy:
When I came across ALICE, I was coincidentally doing some work that involved making such measurements and I wanted to try those out with ALICE + ADALM2000. However it didn't work. I also saw that a v2.1 of ALICE for ADALM2000 was created which uses the "ADI-LIBM2k" library instead of the lib-iio library. However, I couldn't find any release binaries for it so I gave up on going further on that. I do hope that these extra features from ALICE make it to the Scopy software in the future software updates.
Apart from Scopy and ALICE, I tried to look around if there are any open source community tools that also support Scopy. I was mainly curious if Sigrok (sigrok.org) supports it as that was something I had used in the past. Anyway, long story short, it doesn't support ADALM2000. However, I also noticed that the project seems stale now and not being actively updated anymore, so no love lost there!
The Scopy app, as per my understanding, is designed for cross-compatibility across platforms, i.e., the same application can be compiled and used for most major platforms. This includes Windows, Linux, Mac/OSX, and.... Android! The good thing about this approach is that you get the same familiar user interface irrespective of what host platform you're using. I found this to be a potentially useful feature since I wanted to be able to use ADALM2000 with my Android devices. This would take things to another level in terms of mobility for me. Put the Scopy in one pocket and phone in another and carry your lab with you!
Installing on Android is as simple as downloading the app from the app store. I verified that the version on Google Play store was indeed the latest one.
Since my phone uses USB-C, I used an appropriate OTG adapter to connect with ADALM2000.

After executing the app, it took permission to use the USB device, and that was it! I had ADALM2000 working with my phone!
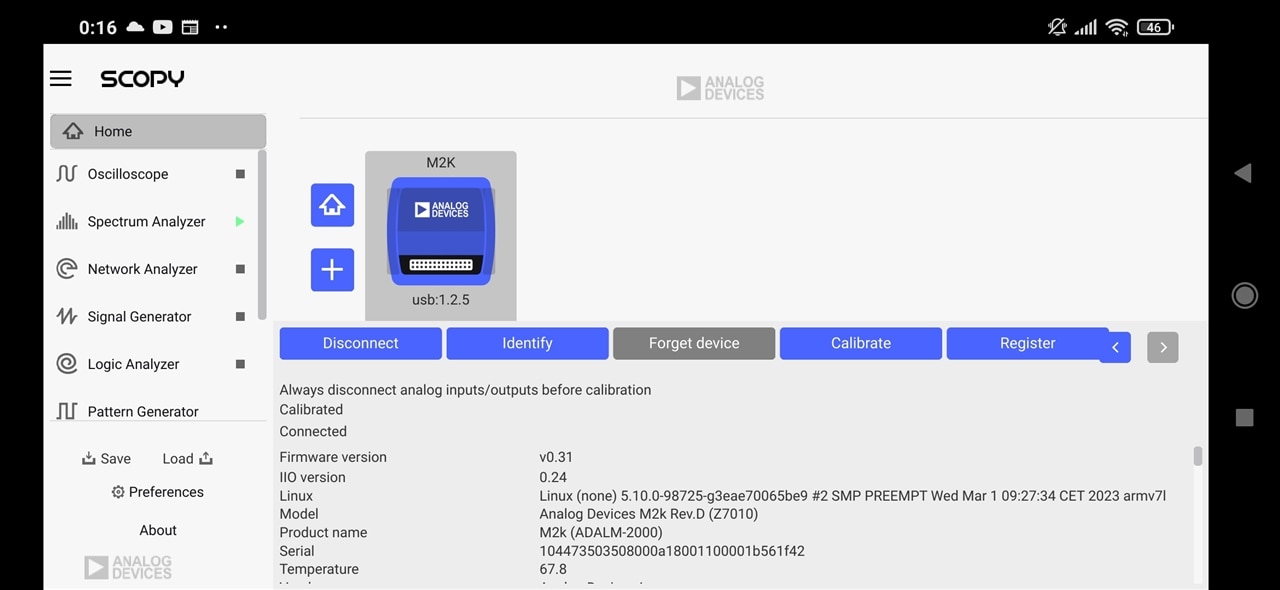
I then played around with it to see how usable it was with my phone. A simple test is shown below whereby I started the Signal generators to generate Sine and Square waves.
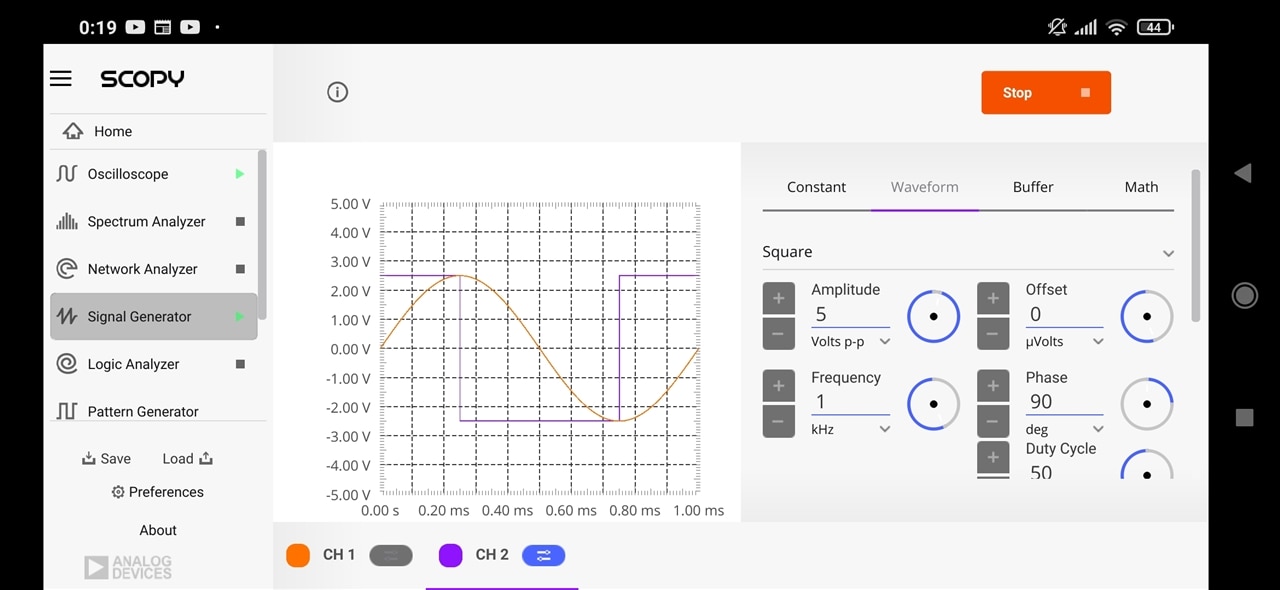
Then, after connecting the signal generator channels to respective oscilloscope channels, I could observe these on the oscilloscope channels as well as on the Spectrum Analyzer.
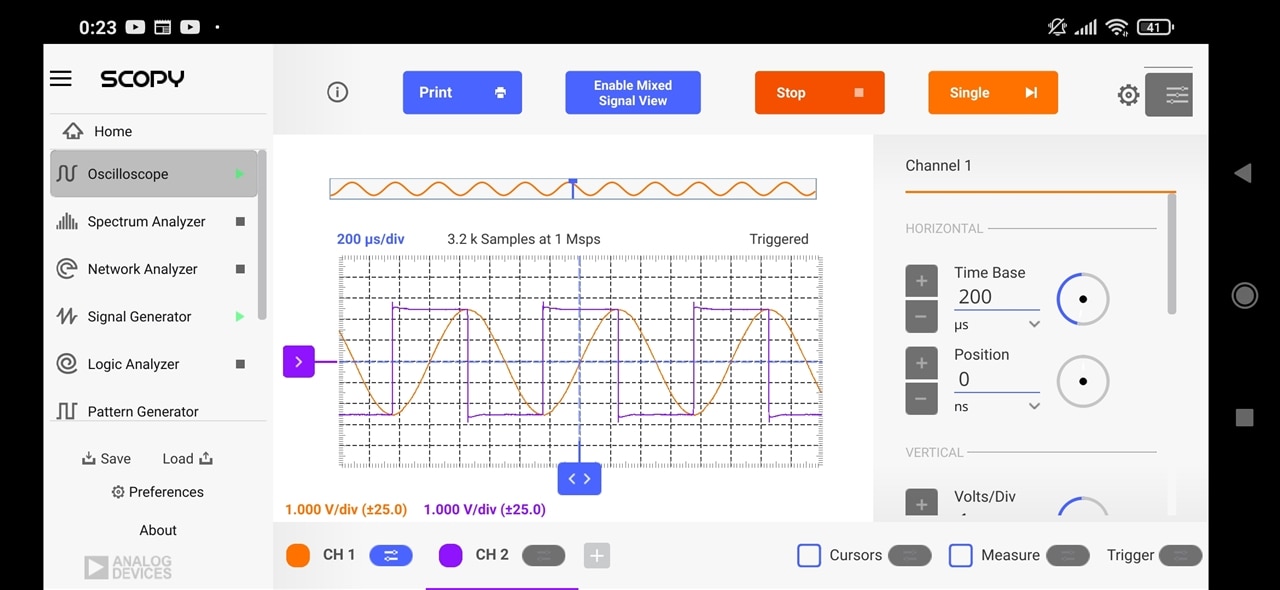

All the above screenshots are taken directly from my phone. I used the Light Mode here (from the "Preferences" page in Scopy) instead of the default dark mode.
Although the user interface was usable, due to smaller sizes of controls (compared to my fingers) it was a bit harder to tap in the right places. Of course the controls had scaled down based on my phone screen (6 inch). So I figured it's more suited to a tablet instead, something with a bigger screen. Unfortunately I didn't have access to any android tablet except my BOOX ePaper tablet. It runs android so I decided to try it anyway despite the ePaper screen. Again, installing was easy and the device did seem to get connected without issue. However, I found that the interface element didn't display too well with the ePaper display (I tried all ePaper modes).
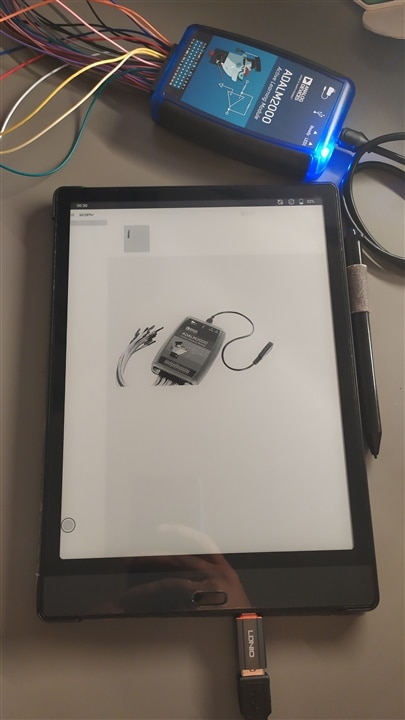
Unfortunate outcome for me, but to be fair this is NOT Scopy's fault since I am sure no one had ePaper displays in mind when they thought of Android support. ePaper tablets are an extremely small population among android tablets anyway so it doesn't matter. Should work fine on a normal Android tablet.
Going back to my experience of using the ADALM2000 with phone, I observed that while it was usable, there were few things which I think can be improved:
One word of caution: Keep in mind that when used with phone/tablet in the configuration shown above, the ADALM2000 consumes power from your Android phone/tablet so the phone/tablet battery will deplete (much) faster than usual. For prolonged usage in this configuration, if needed, you can use the second USB port on the ADALM2000 to provide power to the ADALM2000 separately while still staying connected to your phone/tablet.
I have used the ADALM2000 quite extensively over the last two months. The arrival of the device at my doorstep coincided with some projects at work that required things like characterizing different types of (long) cables and components (e.g. signal transformers) for low frequency wired communications. This was a somewhat new territory for me since I mostly try to stay on the digital sides of things. Anyway, this turned out to be a very good opportunity and the ADALM2000 helped me tremendously with trying to understand the behaviour of things on a very fundamental level for these items. Even though I had access to big, specialized (and expensive) instruments, this was the instrument I could even use at my desk to run different experiments on the components and study their behaviour to get an intuitive sense of how they worked. Interestingly, I ended up using the Network Analyzer the most, which as I have learnt, is one of the most interesting instruments when you want to characterize components for communication/transmission systems.
I have previously written two blog posts with experiments which were heavily inspired by some of that work:
I have grouped these Instruments together since most of the time I ended up using all of these instruments in succession to look at the DUTs in time and frequency domains. I thoroughly enjoyed this process.
BLOG POST - ADI ADALM2000 - Exploring the Mysteries of a Crystal Oscillator
I published this blog post several weeks ago. In this blog post I experimented with a 12 MHz crystal oscillator, using the ADALM2000 to stimulate and capture response of a crystal oscillator. I first considered the oscillator as an unknown oscillator and tried to find the oscillation frequency. Once that was accomplished, I then explored how the crystal responds to frequency stimuli close to its oscillation frequency, which showed some very interesting behaviour in terms of Amplitude and phase response of the oscillator.

I encourage you to read the full blog post if you haven't already done so.
ADI ADALM2000 - Exploring the mysteries of a Crystal Oscillator
BLOG POST - ADI ADALM2000 - Exploring Twisted-Pair transmission lines
In this blog post I connected a slightly long (~30m) twisted pair cable with the ADALM2000 and studied it's response. First I looked at why it was a good idea to use a BALUN for such testing to convert from ADALM2000's single ended function generator signal to a differential signal. Then I moved on to looking at the DUT in the time domain. This involved launching a pulse down the cable and observing the pulse travelling and reflecting between the ends. I also tried to use this information to try to estimate the speed at which the electrical pulses were travelling inside the cable. After this I moved to the frequency domain (using the Network Analyzer) and here I saw the reflections appear as standing waves inside our cable at certain frequencies. I tried to explain the theory of what was being observed with some diagrams. Finally, I tried to determine the characteristic impedance of the cable by tuning the termination resistor at the receiving end to minimize reflections.
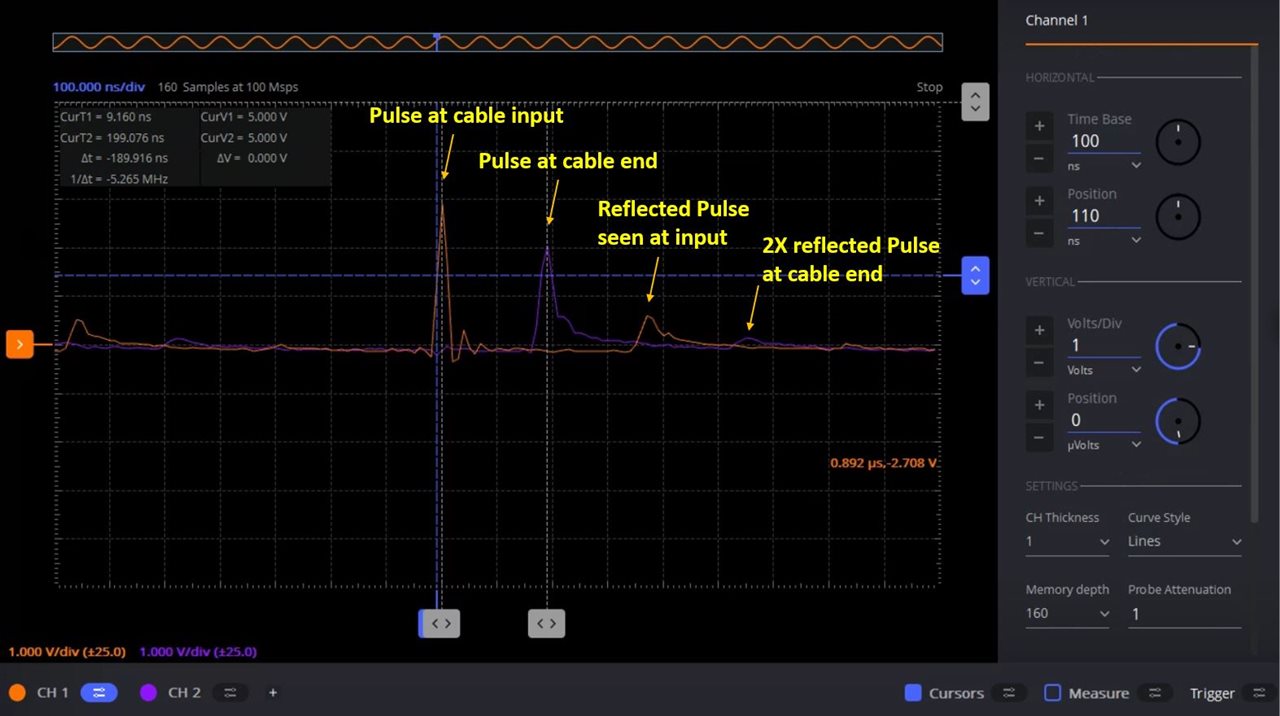
Again, I encourage you to read the full blog post if you haven't already done so.
ADI ADALM2000 - Exploring Twisted-Pair transmission lines
Other than these two blog posts, I did a lot of other experiments with the various instruments inside the ADALM2000. As much as I would have liked to blog about each experiment I performed, it wasn't possible to do so due to the time it takes to write every blog (perhaps I need to learn the art of writing short blog posts!). However I did note down observations regarding the experience of using the ADALM2000 to conduct all those experiments. After all the roadtest is about the ADALM2000 device and less so about the things I tested.
2-ch Oscilloscopes:
Overall, I found the oscilloscope channels to work as advertised and was very easy to use. You get the usual oscilloscope settings of setting time base, Voltage/div scale, trace positions in X and Y, etc.
I did not have the BNC adapter board for the ADALM2000, and so with the flying lead setup I could see the ringing at the edges even at 100kHz (although it has more to do with the fast edge than the frequency of the square wave). I think if I had the BNC Adapter board with some proper probes, I could have used the compensation potentiometer on the probe to get rid of the ringing.
Although the frequency of the oscilloscope channels is much limited compared to most lab bench oscilloscopes, the fact is that 90% of the time we are looking at signals that don’t go beyond a few Mhz. That said, do keep in mind that Bandwidth and Sample rate are not the same thing!! There is a very good video by "The bald engineer" on this topic that I would refer you to (https://www.youtube.com/watch?v=9AJRaDJ0ofQ ). My point here being that 100MSPS is the sample rate of the ADCs, not the bandwidth! A visual demonstration in this case is that at 10Mhz, the captured signal (square wave) is already looking like this:
One strange observation I had was that there is something with the sample rates or the input filters such that when I increase the timebase, the signals seemed to get filtered. As an example, the 10Mhz signal displayed above was captured at 100ns timebase (minimum possible value). If i switch the timebase to 100us, the signal totally disappers.
I am not sure if this is the expected behaviour. At least I don't remember the normal benchtop oscilloscopes doing this. Perhaps someone more experienced with this can help explain!
Anyway, you get to display the 2 hardware channels, and in addition you can also display Math channels, Import and display reference signals (that you perhaps saved before), and you can also enable the mixed signal view to show logic channels alongside the oscilloscope channels.
For the snapshots, I noticed that you can display up to 4 snapshots at a time for comparison (the "Snapshot") button on bottom right of screen is handy for that! Once you take and display the snapshots, you can shift them in the Y direction but not in the horizontal direction.
You can also enable the FFT, X-Y and Histogram displays, which then appear as tabbed displays in the window (you can view up to 2 at a time). I did not use these views too much in my own testing but I believe these would be useful when you're looking for the relevant information.
The (edge) triggering worked fine and having the option to set hysteresis on the trigger was helpful especially when dealing with noisy signals. You can also trigger on digital signals as well as from an external trigger.
Lastly, you can add the usual cursors (2 horizontal, 2 vertical), as well as vertical and horizontal measurements (Duty cycle, freq, pk-pk voltage, etc etc etc)
One very interesting thing about the oscilloscope in the ADALM2000 is that the inputs are "differential" in nature, which is very interesting since most lab oscilloscopes have single ended inputs and require special (expensive) differential probes for looking at differential signals. This was very useful to me when doing the experiments with twisted cables (differential signals), and also when looking at some differential encoder signals during a field visit.
2-ch Function Generator:
The function generator is a very integral part of an instrument like the ADALM2000 since in many experiments you need a controlled source to stimulate your Device Under Test. The dual channel function generator inside the ADALM2000 worked well in my testing. Keep in mind that the outputs of the function generator are single ended (unlike the oscilloscope channels which are differential). For this reason in my experiments with twisted cables I used a BALUN to convert the signals to differential.
Some things I really liked about the Function generator:
One thing I missed in the function generator was a way to generate a frequency sweep. Currently if I were to do that, I would need to generate a sequence using an external tool like MATLAB , save it as a buffer, then load and use that. It would be very nice if the instrument can do that directly.
Network Analyzer:
Before this roadtest, this was the instrument I had least amount of experience with. Little did I know I would fall in love with the Network Analyzer. I think of all the instruments in the ADALM2000 this is the one I used the most over the past two months. I tested so many components as DUTs using the network analyser to see how they behaved at different frequencies and how the phase response changes. I did this with twisted and coax cables, communication transformers, BALUNs, RC/LC filters, crystals, etc and learned a lot about them during the process.
I will not go into too much detail on the Network analyzer her since I covered them quite a bit in my blog posts published earlier (linked in this post above). I again encourage you to have a read through those.
One thing I want to mention here is that I really liked the "buffer previewer" feature in the Network analyzer which allows the user to look at the raw signals on both ends of the DUT. I found it really handy to "see" how the signals changed in the time domain.
Spectrum Analyzer:
The spectrum analyzer in the ADALM2000 allows you to look at the signals (on the oscilloscope channels) in the frequency domain. There are a few settings, and so getting it to work was simple and easy. You mainly select the frequency span and hit Run. Here you can see a screenshot of a 10MHz sine wave on Channel 1. If you look carefully, you'll also see a smaller peak on channel 2 due to cross talk; something not as easy to notice in the time domain on the oscilloscope channels.
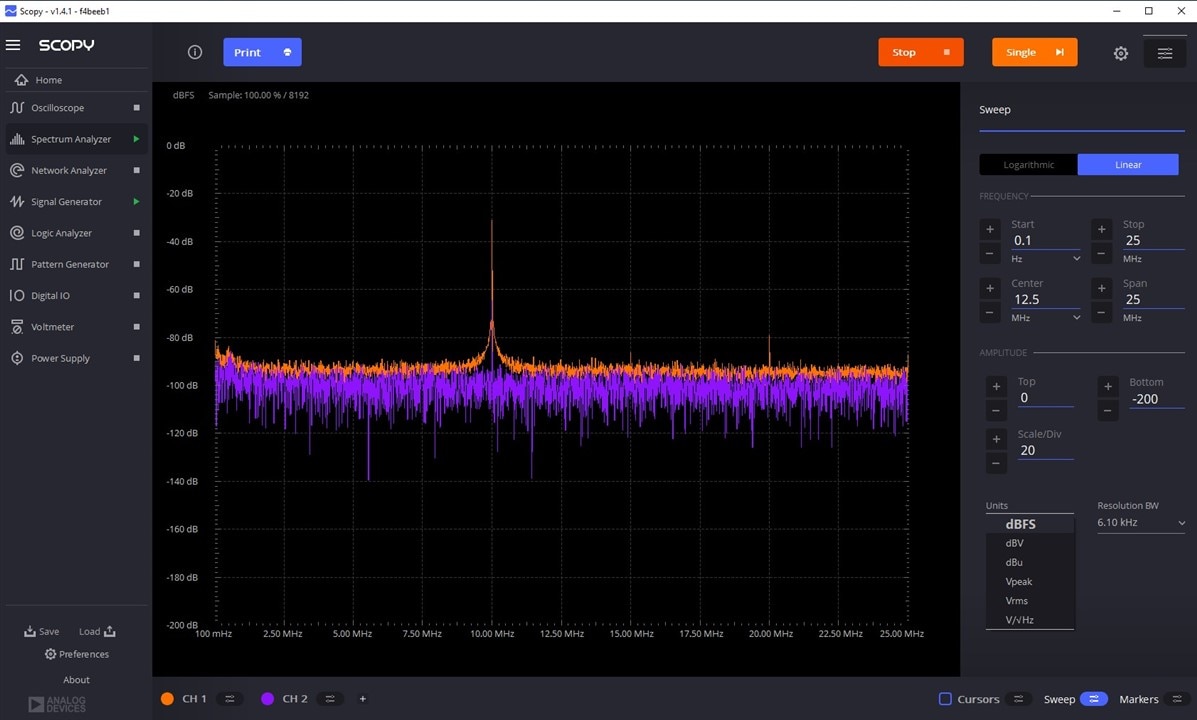
There are a few settings to give you more control. For example you can change to different units (shown on bottom right), as well as change to a lower or higher resolution on the displayed FFT by switching to a different "Resolution Bandwidth". Overall it worked well in my use and helped increase my knowledge by seeing signals in the frequency domain.
The pattern generator allows you to use a single or multiple (grouped) Digital IO lines (of which there are a total of 16) to generate different types of signals.
The Logic Analyzer does the reverse (i.e., receive the signals) and in addition allow you to decode them using a protocol analyzer.
When working with both these instruments, you can divide the available 16 Digital IO channels between the Pattern Generator (outputs) and Logic Analyzer (inputs) in any combination. In fact, I was even surprised to find that I could use the same channel to generate a pattern and read back the pattern from the same channel in the Logic Analyzer. I had expected that the application would complain, but it didn't.
For the pattern generator, once you select (double click) a single channel or group in the graphic window, you can see the "Channel settings" window on the right where you can rename a channel and also select
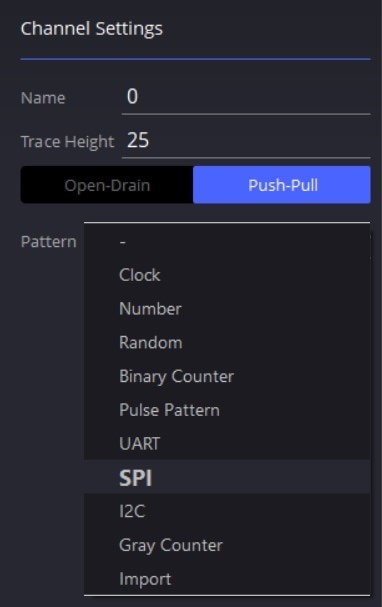
Once you assign a particular Pattern, then the settings window gets populated with more controls related to that particular pattern. For example, if I set it to send UART message on channel 0
This start sending the selected pattern on the chosen lines. You can choose whether you want to do this "one shot" or continuously.
I also tried to use the Pattern generator to generate BT.656 frames, since that's something I use quite a bit for some projects. I estimated that for a full frame set of (Even + Odd) frames, I need to be able to send a 8-bit pattern of ~1M samples long sequence. I tried this using the "Import" function in the pattern generator, which takes in a csv file with each column as one "channel" of data. I created a dummy pattern using excel and exported it as csv file. I got to more than ~600k samples length without issues. However once I tried a ~1M points long file, Scopy crashed on me. I tried this several times and then repeated it on a different PC and Scopy would crash without saying anything. I am not sure if this was due to a limit on how many samples can be sent to the device's buffer at one time, or if the app crashed while loading this many points.
On the Logic Analyzer side, you similarly select what DIO channels to use and optionally assign a decoder to single or group of channels. The difference, though, is that in this case there is a LONG list of decoders to choose from, which I was very pleased to see.

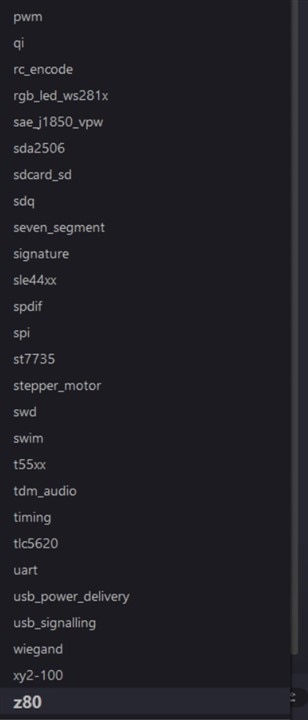
A uart decoder on the same channel with matched baud rate enabled me to see the decoded data on the screen.
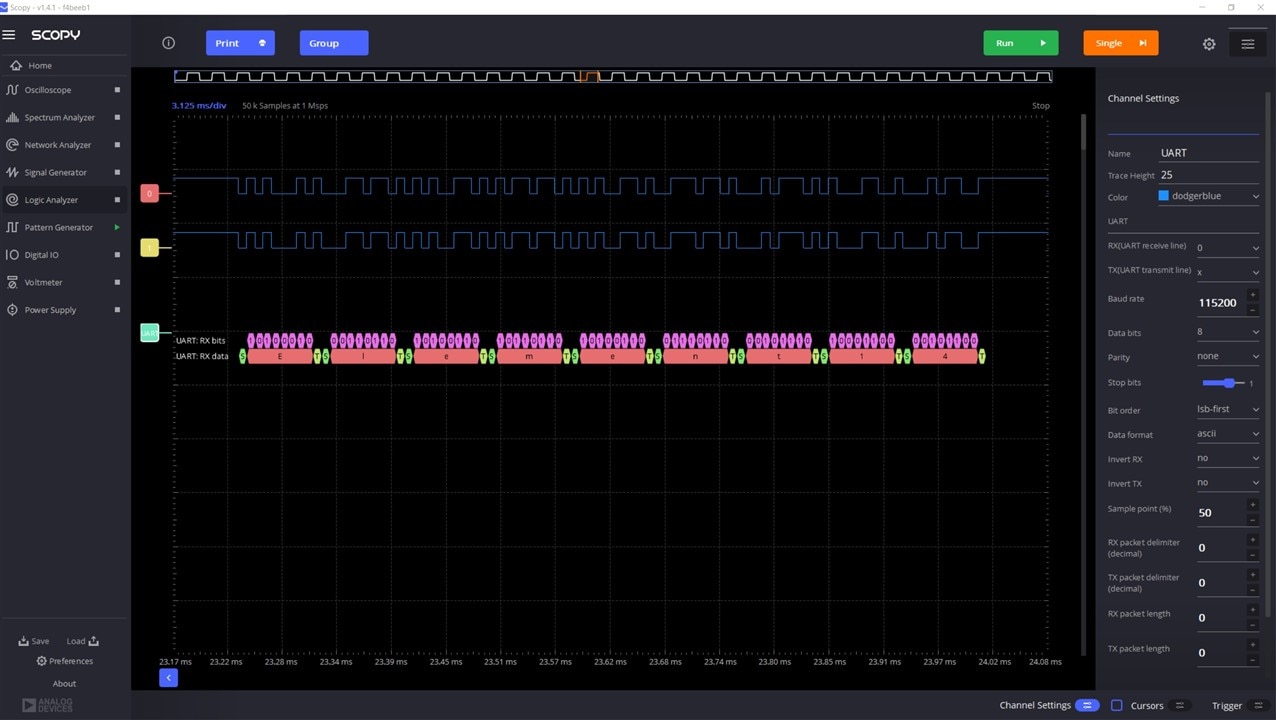
Some issues I encountered:
One limitation of the pattern generator is that as you go to higher frequencies (tens of megahertz), you cannot generate a signal of just any frequency. For example you can generate a clock of 25Mhz or 33.33Mhz, but nothing in between. My guess is that it has to do with the fixed maximum sample rate of the instrument. Since there is no PLL which is generating these frequencies, so the frequency options get limited.
Overall, my verdict for the Logic Analyzer is that it is only usable for basic use. For me, the gold standard for logic analyzer is the Saleae Logic devices, but it's not so much the hardware but their software that makes those devices so usable! The user interface is very clean and intuitive. You can setup and begin capturing & decoding the traces in seconds. Above all, it provides a very good interface to browse through the captured traces, see them in tabular form, search through the captures etc. I would really recommend the Scopy developers to have a look at the Saleae software for some good inspiration.
For now, as far as logic analyzer goes, I will not be moving from my Saleae to the ADALM2000.
For some reason the datasheet on Farnell for ADALM2000 (https://www.farnell.com/datasheets/2261938.pdf ) said "Single channel voltmeter (AC, DC, ±20V)". However, in practice I have found it to be a 2 channel Voltmeter. In fact, the voltmeter uses the same hardware (and the same pins for connection) as the Oscilloscope channels. My guess is that the difference probably is on the software side, whereby the voltmeter channels have more filtering to only capture DC voltages or AC voltage in the 20-40kHz range. The datasheet also mentioned +-20V range, while the Scopy UI shows +-25V. Perhaps the datasheet is out-dated and needs updating.
In the following screenshot I have the voltmeter wires(same as oscilloscope wires) connected to Signal generator channels and feeding it with 0.2Hz signals of 2V and 5V (pk-pk) signals.
You can see that the voltmeter instrument is correctly displaying the real time voltages. In my experience the voltages displayed are not as accurate as a 5 digit multimeter, but for many normal usages they should work fine. If you need to measure/log very accurate voltages then you should be using the more expensive dedicated DMMs.
The voltmeter also displays a "History" (the graphs), which can be turned on or off. You can also change the length of this history graph to 1, 10 or 60 seconds.
Lastly, a nice feature is that the voltmeter gives you the option to do data logging from the same screen (bottom right). Using this is very simple. Select a file, set the timer and Turn it on. The timer sets the logging interval, not the total logging time, which ends when you turn the logger off manually. The file is saved in csv file and contains the following data after I opened it in Notepad.
The ADALM2000 has two power supplies built-in that you can use to power up small circuits. One goes from 0 to +5V and the other goes from 0 to -5V. Both of them can supply a maximum of 50mA, which is why i said "small circuits". Nevertheless it's enough to power up most ICs like op amps, logic ICs, etc. If you need more current or voltage than either you will need to switch to a different power source, or use the AD-M2KPWR-EBZ power booster board (up to 700mA) which is an optional accessory for the ADALM2000.
Overall, the Power supplies work well for what they are.
The UI is simple and functional. You can set the voltage for each channel independently, or in "tracking" mode (see top-right of screenshot). In this mode you set a ratio between the Positive and negative outputs. So for example if you set it to 50%, then the negative supply will always be at 50% of the positive supply. So 5V at positive supply will give you -2.5V at the negative supply. Interestingly, you cannot set the ratio such that the negative voltage has a higher magnitude than the positive voltage in this mode. I am not sure why this is set as such.
One nice thing I noticed in the Programmable power supplies is that they also measure and report back the "actual" voltage at the pins in real time. This is helpful because sometimes the actual voltage on the power supply output pins is not same as what the power supply is set to output. This is especially true when the outputs get overloaded so the voltage cannot be maintained. The fact that the ADALM2000 power supplies can source a maximum of 50mA each makes this even more useful since you can see if the power supply cannot keep up with what the circuitry being powered up requires.
One day the power supplies inside the ADALM2000 served an interesting purpose. A colleague of mine asked me to look at her wireless earphones that seemed dead. I was at my office desk without any instruments. However, I had my ADALM2000 in my bag. Anyway, I opened the cover and checked the voltage on the single cell battery (with ADALM2000's voltmeter), which was below 2.5V so the protection circuitry had decided to disconnect it and was refusing to charge it back. I then used the power supply inside the ADALM2000 to "jump start" the battery again by setting it to the measured voltage, and slowly increasing it to 4.2V in steps of few hundred millivolts. Since the measured value is shown along with the commanded value, I could see when the battery had charged to the commanded value (so I could increase further). Long story short, the battery was brought back to life and the earplugs started working again without me having to even leave my desk.
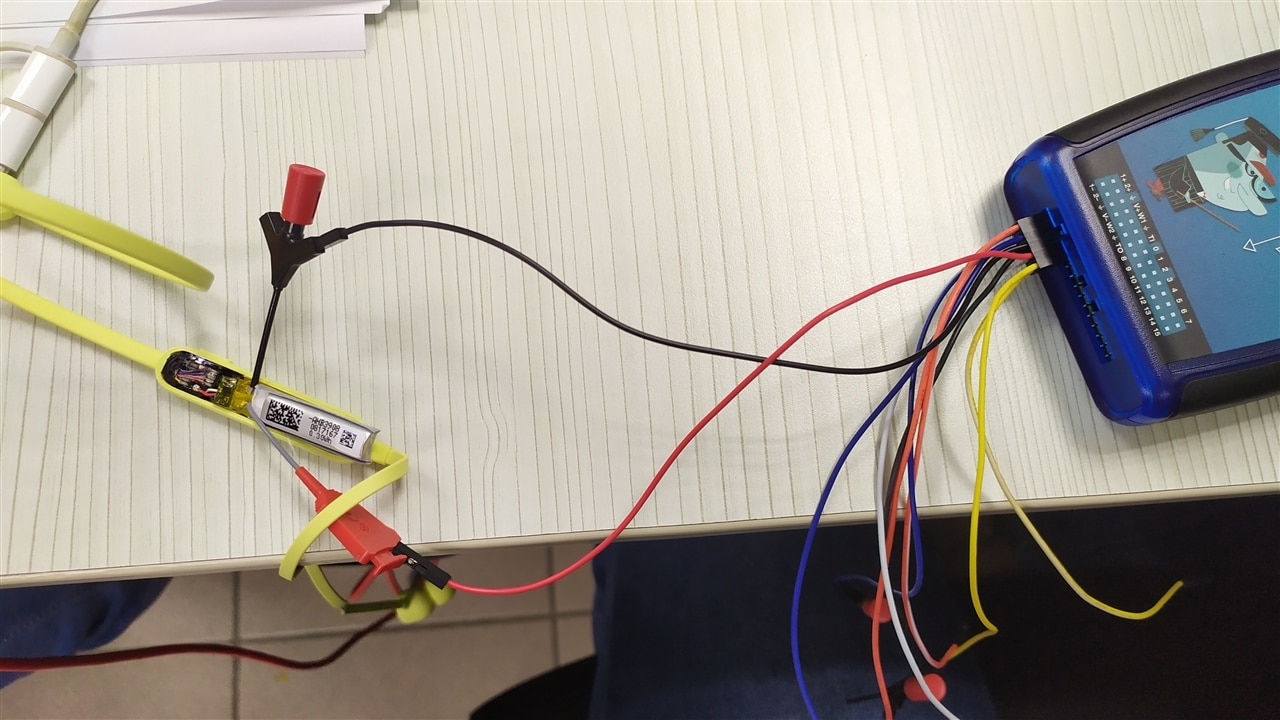
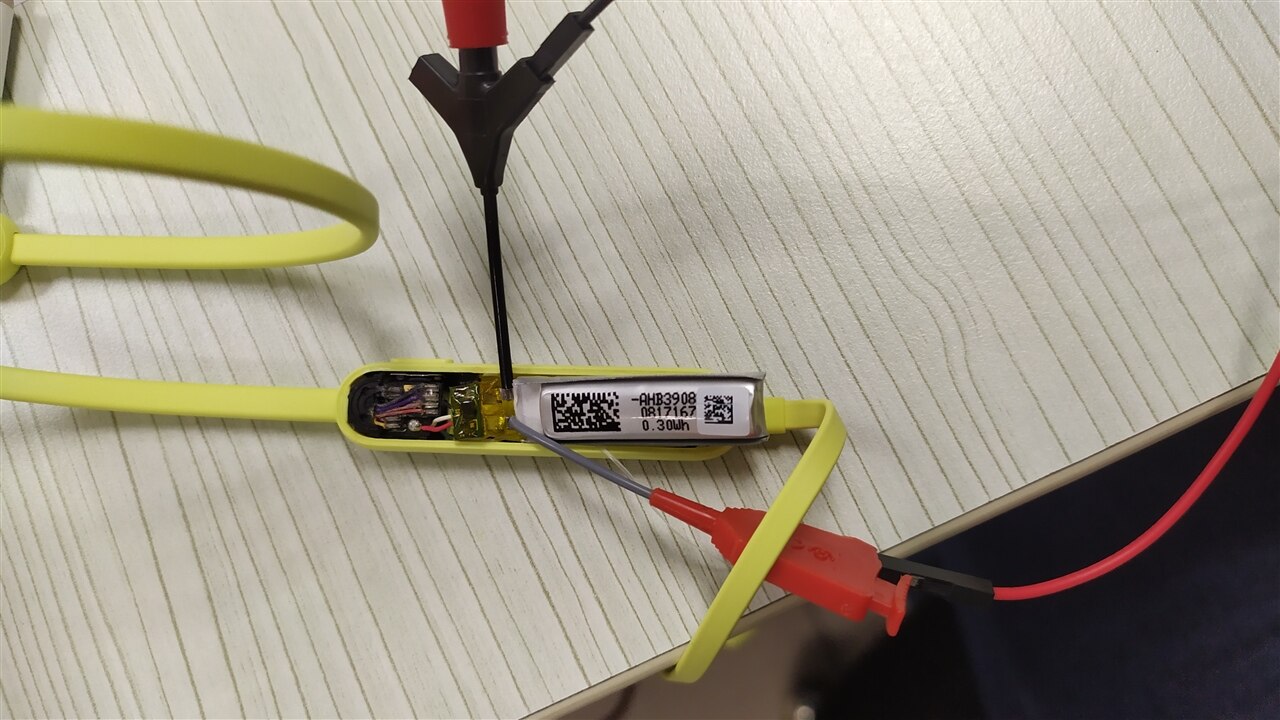
The ADALM2000 clearly saved the day!
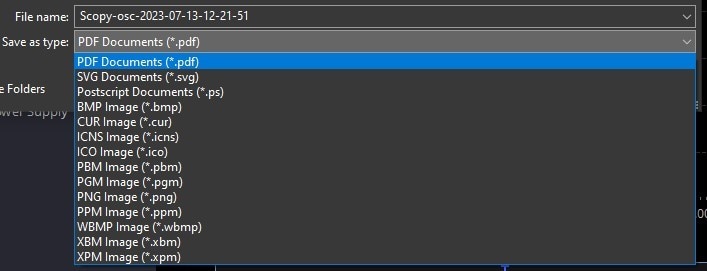
First of all, you can save screenshots of the graphic window in any instrument window directly by clicking the "Print" button on top left of screen. This allows you to save the graphic window in one of several image and pdf file options. The list of supported formats is quite extensive so you're sure to find the format you like.
Sometimes you want to export the actual values you record in Scopy to process it in an outside tool. This can be the raw data recorded on the oscilloscope channels, or it can be the processed output form a tool like the Spectrum Analyzer or Network Analyzer. Scopy provides an easy way to do this. Click the Gear icon on the top right while in any instrument and then click the "Export" button.
The export window will allow you to export the data in the graphic window as:
Form here the data can be process in other tools like MATLAB, python, excel, etc. Not only does this open some additional use cases, but it also allows to work around some of the current shortcomings/limitation in Scopy.
As an example, I was experimenting with FT-X3 communication transformer from Echelon which has 4 coils wound around a single core. I was interested in verifying the polarities of terminals relative to each other as well as see any differences in coupling between the 4 coils. I used the Network Analyzer to get the gain and phase graphs for each coil output, with one coil fixed as the input. To compare, however, I found that the NWA only give option to load one previous reference trace (I needed to load 3!). So I exported the Amplitude graphs for all the coils to csv files, combined them together in excel, and was able to graph them all together for comparison:
While the Scopy app should work fine for basic to intermediate testing needs of many users, sometimes you need the "extra power" to accomplish more complex tasks. I was pleased to find that the ADALM2000 gives several different options to work with the device. The best way to see all options actually is the "info.html" webpage on the device's virtual disk drive:
You can see in the list that the available options cover all major frameworks that one could use.
Overall this is an impressive set of supported frameworks and should cover the needs for most users.
On a side but related note, talking of LabView, I found while looking at these frameworks that NI has made available a fully featured "community" version of LabVIEW at NO COST for home/hobby use. In the past the licensing costs was one thing that prevented me from using it for hobby projects, so I will definitely be seeing more of it in the coming times.
One interesting feature I found while browsing the wikis is that you can execute scripts on the device itself. This is supposed to provide an advantage in terms of speed since the host machine is not in the loop anymore, so you could for example, run things like control loops on the device itself. This is accomplished via support for JavaScript, along with a set of commands for each instrument.
The relevant wiki page gives very detailed information on this so I don't want to replicate that info here.
https://wiki.analog.com/university/tools/m2k/scopy/scripting-guide
I did not try running these scripts myself, however, I did follow the links in the wiki to see that several example scripts are provided to get started, which should make for an easy start for anyone interested in this functionality.
I want to briefly touch this topic since I saw some confusion/misunderstanding about this on the online forums.
As such, the ADALM2000 datasheet/brochure mentions the following 11 instruments inside the device:
However, it's important to note that at the hardware level, the ADALM2000 works on a set of 5 base hardware devices, as shown below:
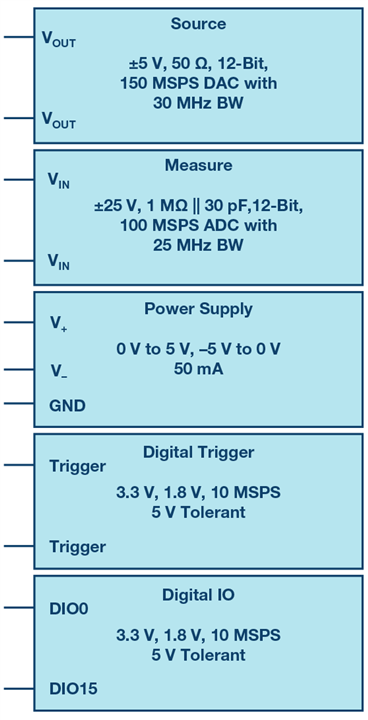
The first three are analog devices (function generators, oscilloscope channels, +-5V power supplies), while the last two are digital functions. So how does the ADALM2000 manage to get 11 instruments out of the 5 hardware devices? Well, that happens via the software running on the ADALM2000.
| Instrument | Hardware used |
| 2-ch Oscilloscope | 2 x ADC channels |
| 2-ch Arbitrary Waveform Generator | 2 x DAC channels |
| 16-ch Logic Analyzer | 16-ch Digital IO |
| 16-ch Pattern Generator | 16-ch Digital IO |
| 16-ch Virtual (digital) IO | 16-ch Digital IO |
| Digital Trigger synchronization (for multiple devices) | Digital Trigger hardware |
| 2-ch Voltmeter | 2 x ADC channels |
| Network Analyzer | 2 x ADC channels, 1 x DAC channel |
| Spectrum Analyzer | 2 x ADC channels |
| Logic Analyzer (Digital Bus Analyzer) | 16-ch Digital IO |
| 2 x programmable power supplies | 2 x Power supplies |
You can see from the above table that the hardware components are shared by some instruments. As a result:
Analog Devices has made available some optional purchases to complement the ADALM2000:
On a related note, I have read on some forums that since the interface connectors on the ADALM2000 and Analog Discovery are the same, some of the add-on boards are compatible between the two. I especially noticed the BNC adapter boards being mentioned. I have not tried this myself, but if you happen to have one type of add-on board and the other type of device you might be able to reuse across devices.
While using the device over the past 2 months, I kept a log of observations and issues I encountered in a notebook. Some I have mentioned previously, but I will try to summarize the major points here:
Now I am not entirely clear what all the calibration does, and how much the calibration parameters drift over shorter periods of time (a few hours to few days) but I kept wondering if one could calibrate it once when convenient, store the calibration values to file in Scopy, and just reuse them until a new calibration was done at some time later. This would save the hassle of disconnecting and reconnecting the analog connector after every power cycle of the device.
A similar example was me wishing there was a way to see multiple waveforms (since they're cyclic) when configuring the Arbitrary Waveform Generator to generate a "Sinc" pulse, and I was worried about how it will transition from one pulse to the next. And later I saw the option to do exactly that on the Preferences page. Would have made more sense to keep that on the Function generator page itself (I think!)
In conclusion, the ADALM2000 stands out as an exceptional hardware offering, providing remarkable value at an affordable price point. However, on the software front, while it is currently functional for most applications, there is ample room for improvement. The user interface, although visually appealing, could benefit from further refinement to elevate the instrument to top-notch status.
Personally, my inclination has always been toward the digital side of electronics. Yet, having the ADALM2000 on my desk and immersing myself in its capabilities over the past couple of months has rekindled my interest in the analog side of electronics. The convenience of being able to experiment right at my desk has resulted in more hands-on exploration of analog electronics in these past two months than I have undertaken in the previous two years. This convenience is where the true value of the ADI ADALM2000 shines for hobbyists and professionals alike. Since acquiring the device, I have relied on it extensively for quick measurements and debugging tasks, both at home and in the office. Its compact size and lightweight nature have seamlessly integrated it into my everyday carry without even realizing it.
Reflecting on my college years, I can't help but wish I had access to a device like the ADALM2000. It would have undoubtedly enhanced my practical understanding of electronic circuits in ways I can only imagine.
If I were to highlight a single standout feature of this device above all others, it would be its unparalleled convenience. The ADALM2000 simplifies experimentation to such an extent that sometimes engaging in the experiments becomes more convenient than procrastination itself. Just imagine that! Therefore, I propose a new marketing slogan for the ADALM2000:
"ADALM2000 - Procrastinate less, do more!"
I am very thankful to Element14 and Analog Devices for giving me this opportunity to test and review his very nice piece of test equipment.