


In this blog series, I build a Texas Instruments MSPM0 example with VS Code as IDE, and CMake as build infrastructure.
Post 2 covered the software build. In this post: debugging the firmware.
If not done yet, open the TI Embedded Debugger plugin, and select install dependencies. It installs a version of GCC's GDB executable, support for the XDS110, drivers, and an OpenOCD install.
Debugger
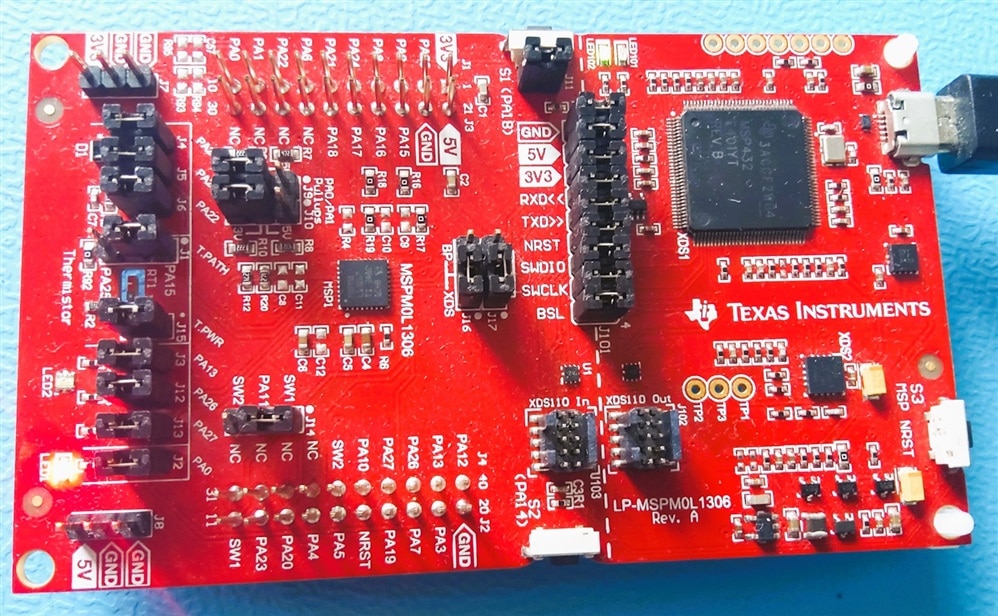
For this post, you need a debugger. If you use a LaunchPad, you already have one ( Cheap debugger ($6) for EasyL1105 MSPM0 board ). The example is configured for TI's XDS110.
Configure Environment Variables
Set the GCC ARM toolchain used for debugging*. The easiest way is to override what the TI VS Code extensions put in your user file. We can do that in the Workspace settings.json file.
{
	"folders": [
		{
			"path": "msmp0_cmake"
		}
	],
	"settings": {
		"cmake.cmakePath": "C:/Users/jancu/.pico-sdk/cmake/v4.2.1/bin/cmake.exe",
		"cmake.generator": "Ninja",
		"cmake.environment": {
			"CMAKE_PROGRAM_PATH": "C:/Users/jancu/.pico-sdk/ninja/v1.13.2/ninja.exe",
			"SYSCONFIG_CLI": "C:/ti/sysconfig_1.27.1/sysconfig_cli.bat"
		},
		"cmake.configureEnvironment": {
			"SDK_ROOT": "C:/ti/mspm0_sdk_2_11_00_07"
		},
		"cmake.enableTraceLogging": false,
		"cmake.loggingLevel": "info",
		"ti-embedded-debug.armToolchainPath": "c:/Users/jancu/Documents/toolchains/arm-gnu-toolchain-15.2.rel1-mingw-w64-i686-arm-none-eabi/bin",
		"cortex-debug.armToolchainPath": "c:/Users/jancu/Documents/toolchains/arm-gnu-toolchain-15.2.rel1-mingw-w64-i686-arm-none-eabi/bin"
	}
}
* the ti-embedded-debug.armToolchainPath setting is used to find the GDB executables. TI defaults it to a TI GCC toolchain installed with their TI Embedded Debug extension. I prefer to have it point to the same toolchain that I use for building the firmware. Sometimes, there are incompatibilities when you debug firmware that's built with a newer version of the GCC tools.
My current setup requires me to set up a number of links to different locations. If I find the energy, I may replace that with a set of variables, and then relative paths in the scripts. Less room for mistakes, and less work when changing toolchain versions ....
Debug Project
Prepare a launch.json script, and place it in your project's .vscode folder:
    "version": "0.2.0",
    "configurations": [
        {
            "cwd": "${workspaceFolder}",
            "executable": "${command:cmake.launchTargetPath}",
            "name": "Debug with TI Embedded Debug for VS Code",
            "request": "launch",
            "type": "cortex-debug",
            "servertype": "openocd",
            "configFiles": [
                "./interface/xds110.cfg",
                "./board/ti_mspm0_launchpad.cfg"
            ],
            "searchDir": [
                "C:/Users/jancu/AppData/Local/Texas Instruments/ti-embedded-debug/openocd/1.5.0.75/share/openocd/scripts"
            ],
            "runToEntryPoint": "main",
            "showDevDebugOutput": "none",
            "deviceName": "MSPM0L1306"
        }
    ]
}
Point the OpenOCD searchDir to script folder of where the TI Extension installed its tools (or yopur own OpenOCD install, if you have one). You can find that location in the settings.json script you just edited.
Now all is ready. Press Run and Debug in the left toolbar. Select the debug configuration you just created. Then press the green button.
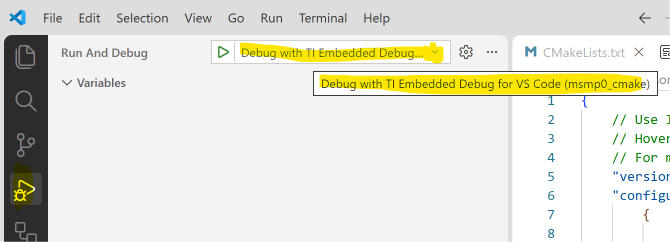
If all is well, the debugger programs the MSPM0, then starts execution and stops on the first line of main:

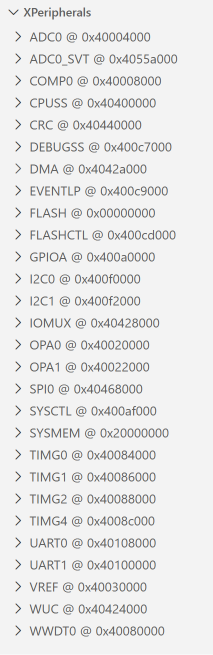
If you also installed TI's extension Cortex-Debug: Device Support Pack - Texas Instruments MSPM0, you can also see (and change) the Peripheral registers. To do that, select View -> Open View -> xPeripherals:
I attached my complete VS Code workspace. If you use this, you 'll have to adjust some paths in the .vscode/*.json files in the root and project folder: workspace_vscode_mspm0.zip
Post 2: MSPM0 project with VS Code, CMake and GCC - part 2: build a real project
part 4: MSPM0 project with VS Code, CMake and GCC - part 4: EasyL1105 example
part of the EasyL1105 series. all posts

