element14 Community
element14 Community
    Register Log In
  • Site
  • Search
  • Log In Register
  • Members
    Members
    • Benefits of Membership
    • Achievement Levels
    • Members Area
    • Personal Blogs
    • Feedback and Support
    • What's New on element14
  • Learn
    Learn
    • Learning Center
    • eBooks
    • STEM Academy
    • Webinars, Training and Events
    • More
  • Technologies
    Technologies
    • 3D Printing
    • FPGA
    • Industrial Automation
    • Internet of Things
    • Power & Energy
    • Sensors
    • More
  • Challenges & Projects
    Challenges & Projects
    • Design Challenges
    • element14 presents
    • Project14
    • Arduino Projects
    • Raspberry Pi Projects
    • More
  • Products
    Products
    • Arduino
    • Dev Tools
    • Manufacturers
    • Raspberry Pi
    • RoadTests & Reviews
    • Avnet Boards Community
    • More
  • Store
    Store
    • Visit Your Store
    • Choose Another Store
      • Europe
      •  Austria (German)
      •  Belgium (Dutch, French)
      •  Bulgaria (Bulgarian)
      •  Czech Republic (Czech)
      •  Denmark (Danish)
      •  Estonia (Estonian)
      •  Finland (Finnish)
      •  France (French)
      •  Germany (German)
      •  Hungary (Hungarian)
      •  Ireland
      •  Israel
      •  Italy (Italian)
      •  Latvia (Latvian)
      •  
      •  Lithuania (Lithuanian)
      •  Netherlands (Dutch)
      •  Norway (Norwegian)
      •  Poland (Polish)
      •  Portugal (Portuguese)
      •  Romania (Romanian)
      •  Russia (Russian)
      •  Slovakia (Slovak)
      •  Slovenia (Slovenian)
      •  Spain (Spanish)
      •  Sweden (Swedish)
      •  Switzerland(German, French)
      •  Turkey (Turkish)
      •  United Kingdom
      • Asia Pacific
      •  Australia
      •  China
      •  Hong Kong
      •  India
      •  Korea (Korean)
      •  Malaysia
      •  New Zealand
      •  Philippines
      •  Singapore
      •  Taiwan
      •  Thailand (Thai)
      • Americas
      •  Brazil (Portuguese)
      •  Canada
      •  Mexico (Spanish)
      •  United States
      Can't find the country/region you're looking for? Visit our export site or find a local distributor.
  • Translate
  • Profile
Test & Tools
  • Technologies
  • More
Test & Tools
Blog Sound and Vibration Measurement: Calculate Acceleration Energy, to drive Maintenance Decisions
  • Blog
  • Forum
  • Documents
  • Events
  • Members
  • Mentions
  • Sub-Groups
  • Tags
  • More
  • Cancel
  • New
Test & Tools requires membership for participation - click to join
Blog Post Actions
  • Subscribe by email
  • More
  • Cancel
  • Share
  • Subscribe by email
  • More
  • Cancel
Group Actions
  • Group RSS
  • More
  • Cancel
Engagement
  • Author Author: Jan Cumps
  • Date Created: 13 Jun 2022 3:51 PM Date Created
  • Views 6413 views
  • Likes 11 likes
  • Comments 2 comments
  • RoadTest
  • predictive_maintenance
  • maintenance
  • acceleration
  • mcc172
  • labview
Related
Recommended

Sound and Vibration Measurement: Calculate Acceleration Energy, to drive Maintenance Decisions

Jan Cumps
Jan Cumps
13 Jun 2022
Sound and Vibration Measurement: Calculate Acceleration Energy, to drive Maintenance Decisions

For the Sound and Vibration Measurement Hat for Raspberry Pi road test, I'm reviewing Measurement Computing's IEPE Measurement DAQ HAT for Raspberry Pi. In this post: calculate the acceleration energy - a mayor signal for wear issues and a parameter to predict maintenance needs.

The knowledge in this post comes from martinvalencia. He defines vibration analysis strategies, for mining equipment maintenance, in the Peru ore mining industry, as part of his job:

"A vibration wave is compound, so it is impossible to analyze in the dimension of time. Its analysis is carried out in the frequency dimension, which is much easier What we do is store the vibration signatures (velocity and acceleration spectra), of a sector of the motor, bearings, bases, shafts, etc , every week, 15 days, 1 month, ...
Depending on the work that this motor does, if it is a critical motor for the operation of the mine, it is monitored 24 hours a day, 7 days a week all year round. Example: the motors of the belts that transport the ore to be processed in the primary crushing.
With the database that we have with the vibration info, preventive and predictive maintenance plans are put together for the motors. Thus we avoid plant stoppages due to unexpected failures, and reduce downtime without affecting the company's production."

This post shows some tricks of the trade. You'll find it in text books, but it isn't often shared in a practical form. For this exercise, Martin and I started from an FTT flow I had made for this road test. He showed me how to convert the FFT to a form that's better suited for maintenance analysis. And how to calculate the overall power that the vibrations cause. These data sets, and the evolution of them over time, is what drives maintenance decisions in his industry.

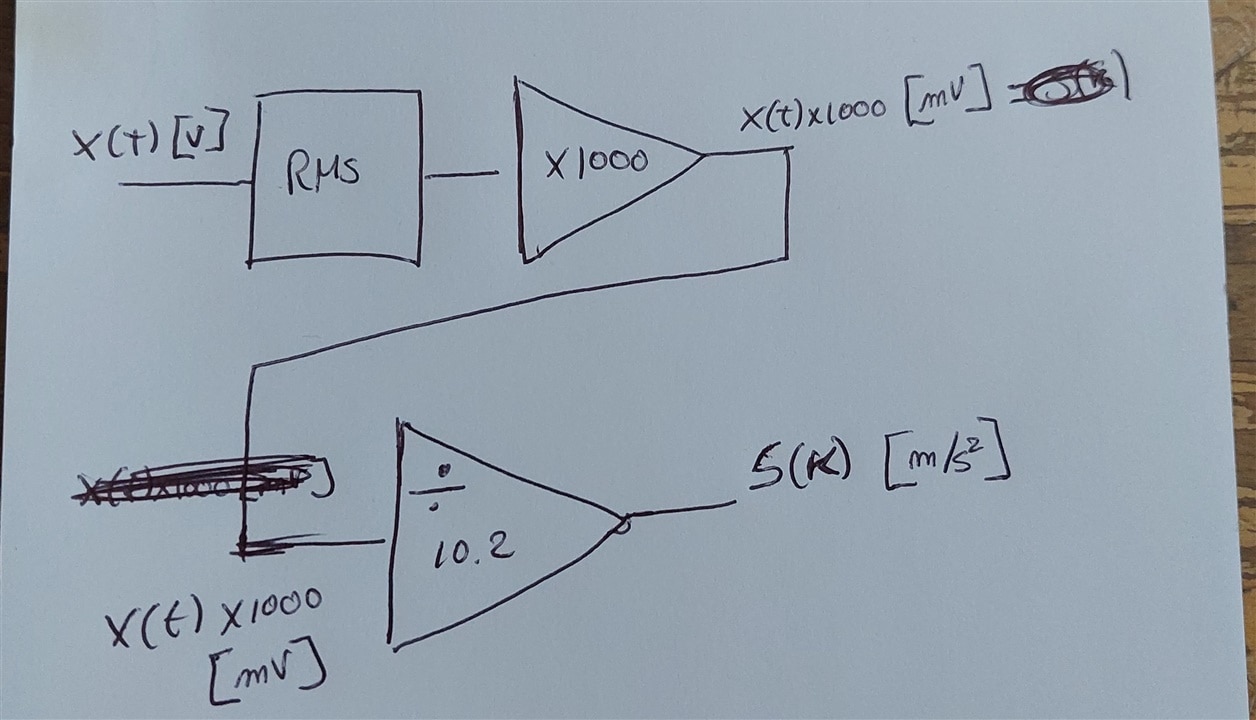
image: initial concept from Martin

Linear FFT gives better insight for vibration analysis

In my original design, I had used power spectrum and a dB scale for the transform. Turns out that I needed RMS and Linear scale.
 
image: LabVIEW FFT settings

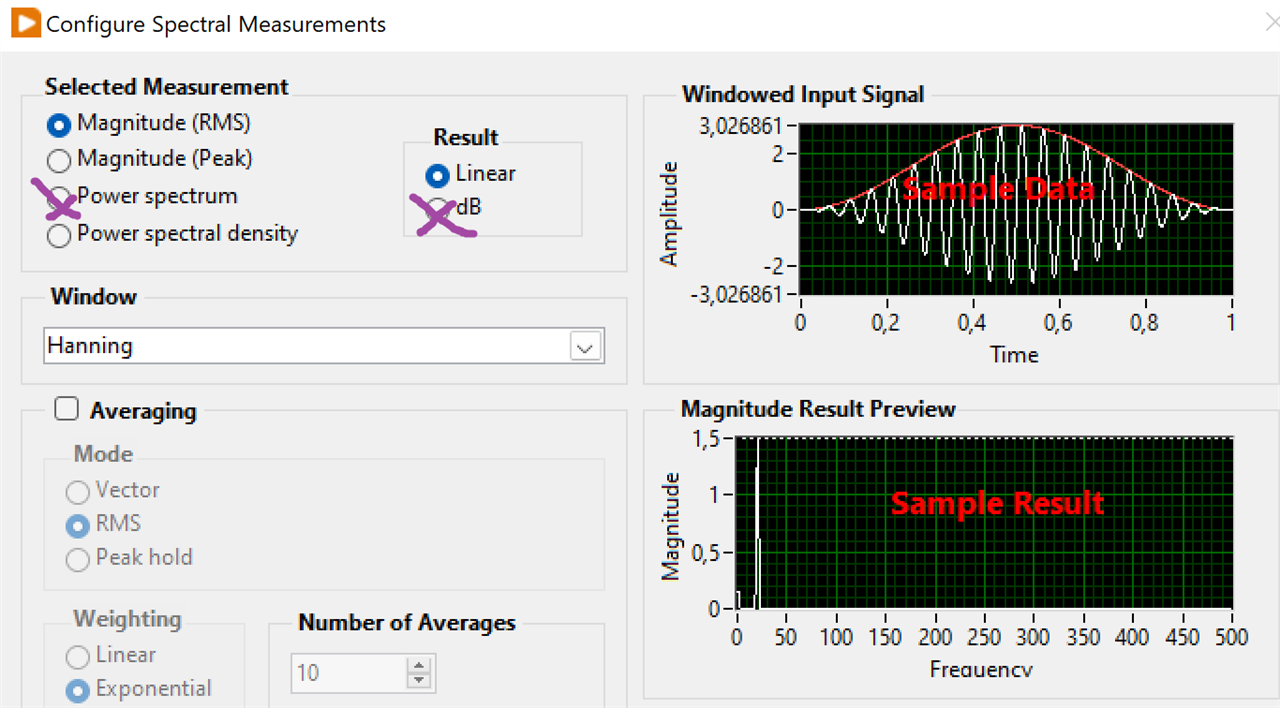
The FFT shows what's shaking at which frequencies. Changes in the spectrum can indicate wear and tear. New peaks showing in higher frequency may indicate early wear in a bearing.
The data by itself is useful, in particular if you have similar machines to compare to. But checking changes over time is what they are particularly looking for. A motor, shaft and gearbox combination doesn't start vibrating at different frequencies or levels, unless something is aging inside, or needs maintenance.

In the design here, the FFT Y axis is expressed in Volt. The output is 100 mV/g. It may be useful for a vibration monitor to adapt the axis to show grams. But for today's post, keeping it in V works better when proving the end results.

Total acceleration energy is a key indicator

The second parameter that drives maintenance decisions is the total energy that's contained in the vibrations. It's a single figure, representing the area under the FFT line. The figure is based on the RMS value of the measurements, and expressed in m/s². The specs of the sensor say that the sensitivity is 10.2 mV/(m/s²). This is exact the same as 100 mV/g, given 1g = 9.81 m/s².
Here's the calculation to convert the samples from raw voltage measurements to an acceleration in m/s²:
image: formula from Martin

My example flow already knows how to capture and store an array of samples. The FFT display is based on that.
So I can just plug in on that level, and use the same data set to calculate the acceleration force - starting from the given that for this sensor, sensitivity is 10.2 mV/(m/s²)

  • take xxxx samples in V (x should be a power of 2 for the FFT to work well)
  • calc RMS
  • multiply by 1000 to get mV (this gives the change over time)
  • divide by 10.2 = S(K), the acceleration

This is how I plugged that into the FFT flow that I made a few posts earlier:

image: LabVIEW flow with RMS/acceleration calculation fitted into FFT example

This is how the results of a random test looked look like. The sensor was sitting on my desk and I tapped on the table surface.

image: FFT and acceleration , using 1024 samples


FFT shows frequency view of the energy in the vibrations collected. The indicator shows the total acceleration measured.

image: actual device in a Peru mine that's managed by the algorithm

Validation

Although Martin said that the results looked good, based on his experience, it's not that easy to validate without access to the raw data. I can give access to a file with that data, but there's a simpler test:
When you use a pure sine signal as input, there's only 1 energy point, at the sinus frequency.
If we know the frequency and amplitude, we can check the FFT value (there should exactly be one energy point), and the acceleration. So that's the approach we took.
I made a sinus of 100 Hz, 400 mVPP as test signal.

image: calculate FFT and acceleration of a sinus, with 260K samples

The FFT shows 0.14 VRMS at 100 Hz. That's correct:

source: https://www.allaboutcircuits.com/tools/rms-voltage-calculator/

Then, the acceleration should be that value * 1000 / 10.2: 

image: confirm what's on screen with calculations

Mathematically sound, we think Slight smile. Thank you for reading.

Link to all posts.

Anonymous
  • Jan Cumps
    Jan Cumps 1 month ago

    vilaksh01 posted an interesting blog on the same subject. But from a different angle.

    He's using the same data as me (vibration measurements), but uses machine learning (TinyML) to predict maintenance needs:
    TinyML Gearbox Fault Prediction on a $4 MCU

    • Cancel
    • Up 0 Down
    • Reply
    • More
    • Cancel
  • mp2100
    mp2100 1 month ago

    Good stuff. I always like to see real “ tricks of the trade” being used.   Vibration monitoring prediction is an important topic. 

    • Cancel
    • Up 0 Down
    • Reply
    • More
    • Cancel
Element14

element14 is the first online community specifically for engineers. Connect with your peers and get expert answers to your questions.

  • Members
  • Learn
  • Technologies
  • Challenges & Projects
  • Products
  • Store
  • About Us
  • Feedback & Support
  • FAQs
  • Terms of Use
  • Privacy Policy
  • Legal and Copyright Notices
  • Sitemap
  • Cookies

An Avnet Company © 2022 Premier Farnell Limited. All Rights Reserved.

Premier Farnell Ltd, registered in England and Wales (no 00876412), registered office: Farnell House, Forge Lane, Leeds LS12 2NE.

ICP 备案号 10220084.

Follow element14

  • Facebook
  • Twitter
  • linkedin
  • YouTube