|
For the Sound and Vibration Measurement Hat for Raspberry Pi road test, I'm reviewing Measurement Computing's IEPE Measurement DAQ HAT for Raspberry Pi. In this post: calculate the acceleration energy - a mayor signal for wear issues and a parameter to predict maintenance needs. |
The knowledge in this post comes from martinvalencia. He defines vibration analysis strategies, for mining equipment maintenance, in the Peru ore mining industry, as part of his job:
"A vibration wave is compound, so it is impossible to analyze in the dimension of time. Its analysis is carried out in the frequency dimension, which is much easier What we do is store the vibration signatures (velocity and acceleration spectra), of a sector of the motor, bearings, bases, shafts, etc , every week, 15 days, 1 month, ...
Depending on the work that this motor does, if it is a critical motor for the operation of the mine, it is monitored 24 hours a day, 7 days a week all year round. Example: the motors of the belts that transport the ore to be processed in the primary crushing.
With the database that we have with the vibration info, preventive and predictive maintenance plans are put together for the motors. Thus we avoid plant stoppages due to unexpected failures, and reduce downtime without affecting the company's production."
This post shows some tricks of the trade. You'll find it in text books, but it isn't often shared in a practical form. For this exercise, Martin and I started from an FTT flow I had made for this road test. He showed me how to convert the FFT to a form that's better suited for maintenance analysis. And how to calculate the overall power that the vibrations cause. These data sets, and the evolution of them over time, is what drives maintenance decisions in his industry.
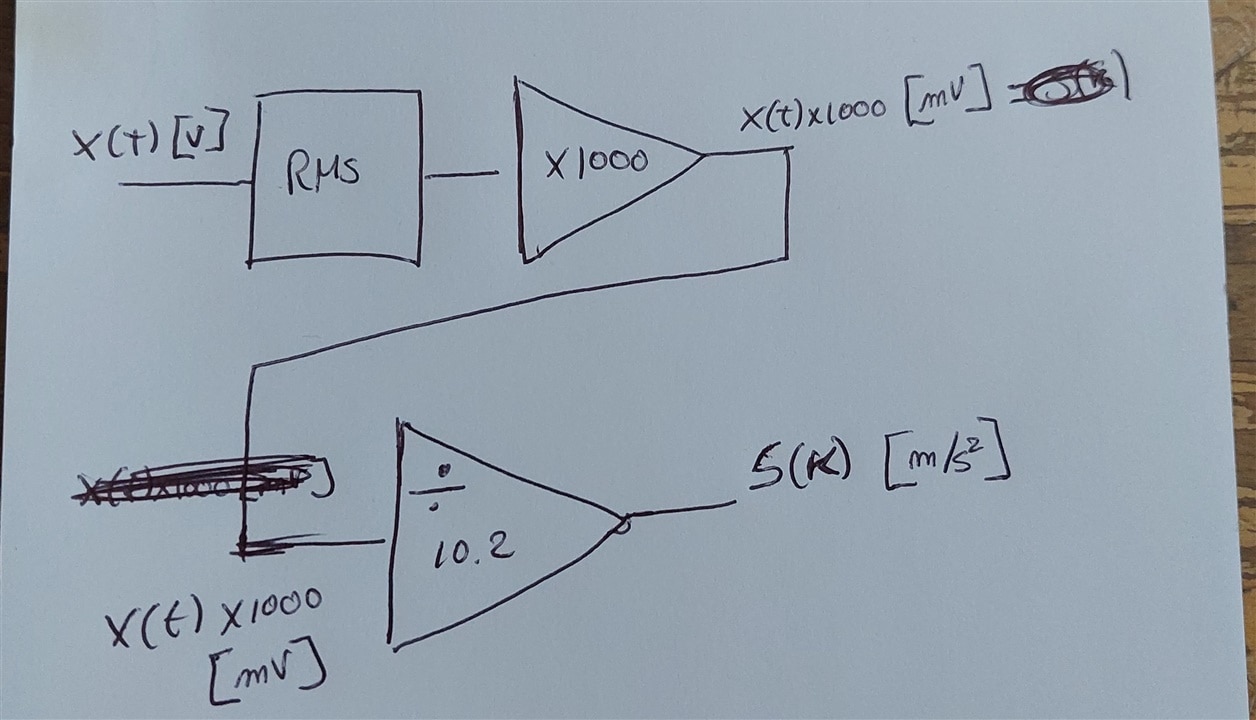
image: initial concept from Martin
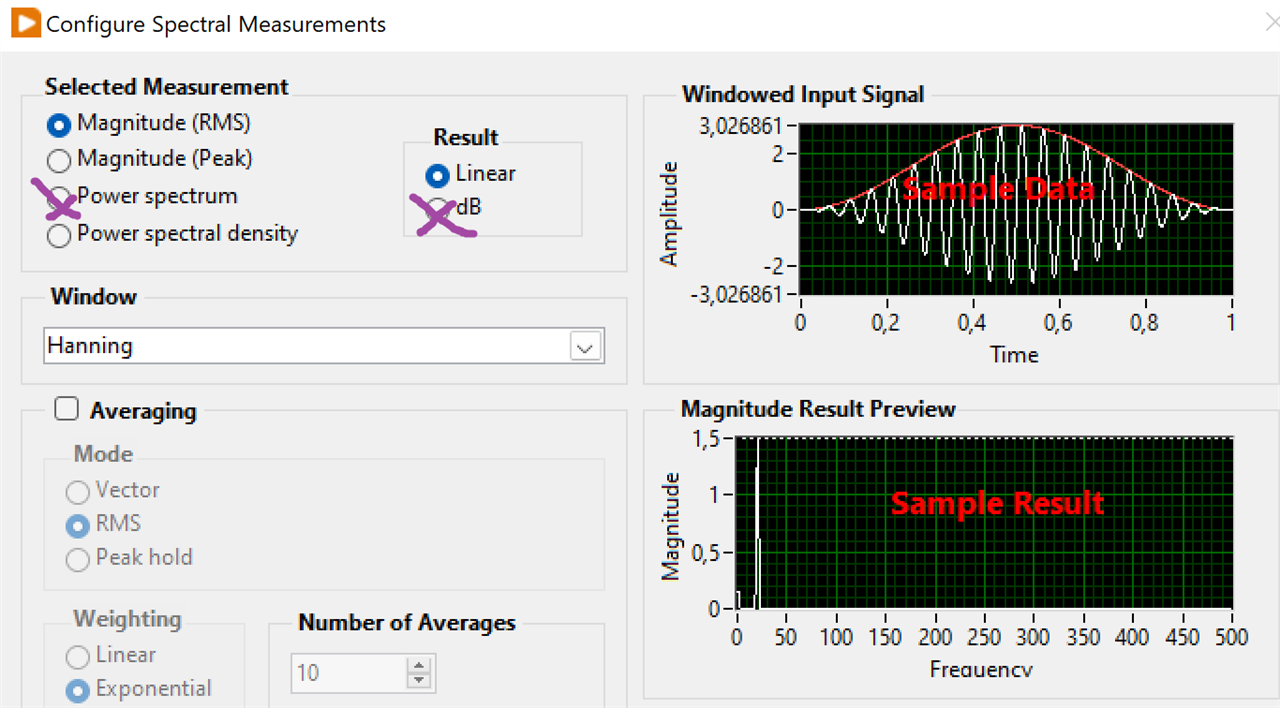
Linear FFT gives better insight for vibration analysis

The FFT shows what's shaking at which frequencies. Changes in the spectrum can indicate wear and tear. New peaks showing in higher frequency may indicate early wear in a bearing.
The data by itself is useful, in particular if you have similar machines to compare to. But checking changes over time is what they are particularly looking for. A motor, shaft and gearbox combination doesn't start vibrating at different frequencies or levels, unless something is aging inside, or needs maintenance.
Total acceleration energy is a key indicator
Here's the calculation to convert the samples from raw voltage measurements to an acceleration in m/s²:

My example flow already knows how to capture and store an array of samples. The FFT display is based on that.
So I can just plug in on that level, and use the same data set to calculate the acceleration force - starting from the given that for this sensor, sensitivity is 10.2 mV/(m/s²)
- take xxxx samples in V (x should be a power of 2 for the FFT to work well)
- calc RMS
- multiply by 1000 to get mV (this gives the change over time)
- divide by 10.2 = S(K), the acceleration
This is how I plugged that into the FFT flow that I made a few posts earlier:
image: LabVIEW flow with RMS/acceleration calculation fitted into FFT example
This is how the results of a random test looked look like. The sensor was sitting on my desk and I tapped on the table surface.
image: FFT and acceleration , using 1024 samples
FFT shows frequency view of the energy in the vibrations collected. The indicator shows the total acceleration measured.
image: actual device in a Peru mine that's managed by the algorithm
Validation
Although Martin said that the results looked good, based on his experience, it's not that easy to validate without access to the raw data. I can give access to a file with that data, but there's a simpler test:
When you use a pure sine signal as input, there's only 1 energy point, at the sinus frequency.
If we know the frequency and amplitude, we can check the FFT value (there should exactly be one energy point), and the acceleration. So that's the approach we took.
I made a sinus of 100 Hz, 400 mVPP as test signal.
image: calculate FFT and acceleration of a sinus, with 260K samples
The FFT shows 0.14 VRMS at 100 Hz. That's correct:
source: https://www.allaboutcircuits.com/tools/rms-voltage-calculator/
Then, the acceleration should be that value * 1000 / 10.2: 
image: confirm what's on screen with calculations
Mathematically sound, we think . Thank you for reading.


-

mp2100
-
Cancel
-
Vote Up
0
Vote Down
-
-
Sign in to reply
-
More
-
Cancel
Comment-

mp2100
-
Cancel
-
Vote Up
0
Vote Down
-
-
Sign in to reply
-
More
-
Cancel
Children