element14 Community
element14 Community
    Register Log In
  • Site
  • Search
  • Log In Register
  • Community Hub
    Community Hub
    • What's New on element14
    • Feedback and Support
    • Benefits of Membership
    • Personal Blogs
    • Members Area
    • Achievement Levels
  • Learn
    Learn
    • Ask an Expert
    • eBooks
    • element14 presents
    • Learning Center
    • Tech Spotlight
    • STEM Academy
    • Webinars, Training and Events
    • Learning Groups
  • Technologies
    Technologies
    • 3D Printing
    • FPGA
    • Industrial Automation
    • Internet of Things
    • Power & Energy
    • Sensors
    • Technology Groups
  • Challenges & Projects
    Challenges & Projects
    • Design Challenges
    • element14 presents Projects
    • Project14
    • Arduino Projects
    • Raspberry Pi Projects
    • Project Groups
  • Products
    Products
    • Arduino
    • Avnet Boards Community
    • Dev Tools
    • Manufacturers
    • Multicomp Pro
    • Product Groups
    • Raspberry Pi
    • RoadTests & Reviews
  • Store
    Store
    • Visit Your Store
    • Choose another store...
      • Europe
      •  Austria (German)
      •  Belgium (Dutch, French)
      •  Bulgaria (Bulgarian)
      •  Czech Republic (Czech)
      •  Denmark (Danish)
      •  Estonia (Estonian)
      •  Finland (Finnish)
      •  France (French)
      •  Germany (German)
      •  Hungary (Hungarian)
      •  Ireland
      •  Israel
      •  Italy (Italian)
      •  Latvia (Latvian)
      •  
      •  Lithuania (Lithuanian)
      •  Netherlands (Dutch)
      •  Norway (Norwegian)
      •  Poland (Polish)
      •  Portugal (Portuguese)
      •  Romania (Romanian)
      •  Russia (Russian)
      •  Slovakia (Slovak)
      •  Slovenia (Slovenian)
      •  Spain (Spanish)
      •  Sweden (Swedish)
      •  Switzerland(German, French)
      •  Turkey (Turkish)
      •  United Kingdom
      • Asia Pacific
      •  Australia
      •  China
      •  Hong Kong
      •  India
      •  Korea (Korean)
      •  Malaysia
      •  New Zealand
      •  Philippines
      •  Singapore
      •  Taiwan
      •  Thailand (Thai)
      • Americas
      •  Brazil (Portuguese)
      •  Canada
      •  Mexico (Spanish)
      •  United States
      Can't find the country/region you're looking for? Visit our export site or find a local distributor.
  • Translate
  • Profile
  • Settings
Test & Tools
  • Technologies
  • More
Test & Tools
Blog Sound and Vibration Measurement: Frequency Band analysis of the test jig - is it linear?
  • Blog
  • Forum
  • Documents
  • Files
  • Members
  • Mentions
  • Sub-Groups
  • Tags
  • More
  • Cancel
  • New
Join Test & Tools to participate - click to join for free!
  • Share
  • More
  • Cancel
Group Actions
  • Group RSS
  • More
  • Cancel
Engagement
  • Author Author: Jan Cumps
  • Date Created: 30 Apr 2022 7:29 PM Date Created
  • Views 1036 views
  • Likes 7 likes
  • Comments 0 comments
  • RoadTest
  • raspberry
  • mcc172
  • labview
  • vibration
Related
Recommended

Sound and Vibration Measurement: Frequency Band analysis of the test jig - is it linear?

Jan Cumps
Jan Cumps
30 Apr 2022
Sound and Vibration Measurement: Frequency Band analysis of the test jig - is it linear?

For the Sound and Vibration Measurement Hat for Raspberry Pi road test, I'm reviewing Measurement Computing's IEPE Measurement DAQ HAT for Raspberry Pi.
In this post I qualify the frequency behaviour and linearity of the test gig.
image

The test device is now built (see this post with fellow e14 member balearicdynamics in action). 
image
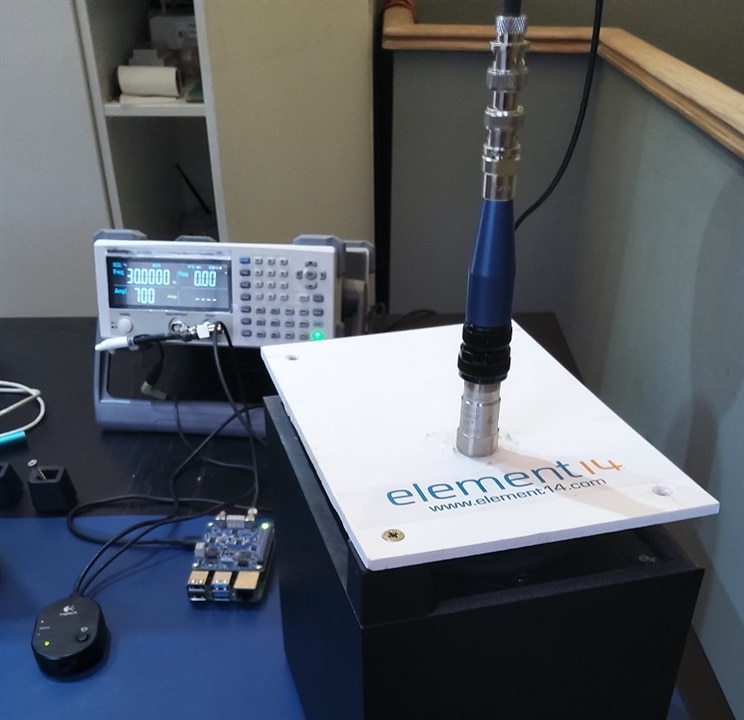
I've done two sweeps. Both started at 20 Hz. First one to 100 Hz. Second one to 200 Hz. Each time with an increment of 2 Hz.
Input to the vibration table was 200 mVPP.
Each mV is represents a gram detected by the accelerometer. 51200 samples / s. RMS calculated at every increment based on 32786 samples.
The test LabVIEW flow I developed for the jig was used.

image

20 - 100 Hz: The low side drop-off is caused by the audio filter in the subwoofer that I used as vibration motor. There's a resonance at 55 Hz.
image
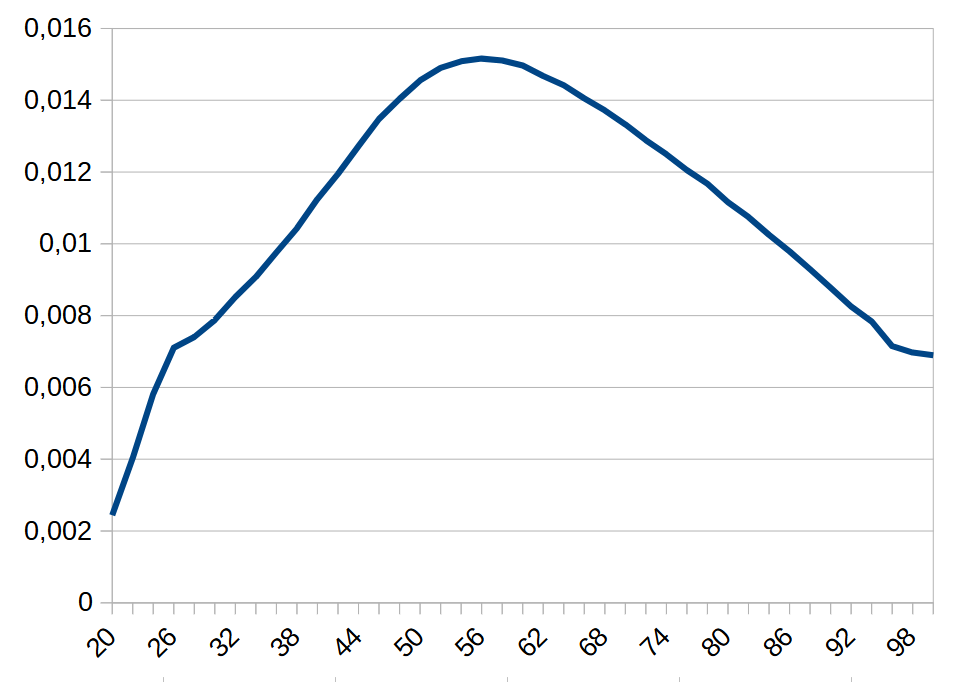
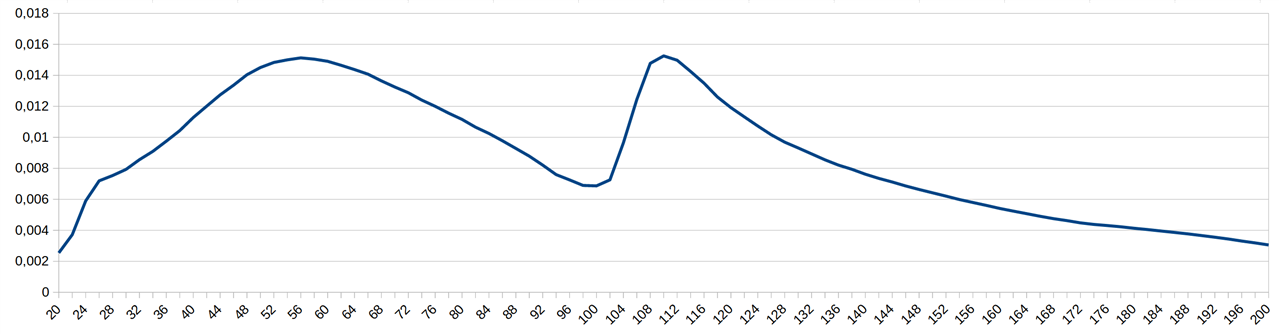
now extended from 20 Hz to 200 Hz: the same image shows before the 100 Hz. That's good - it shows that the behaviour is repeatable. There's a second resonance at +- 110 (harmonic?).
image

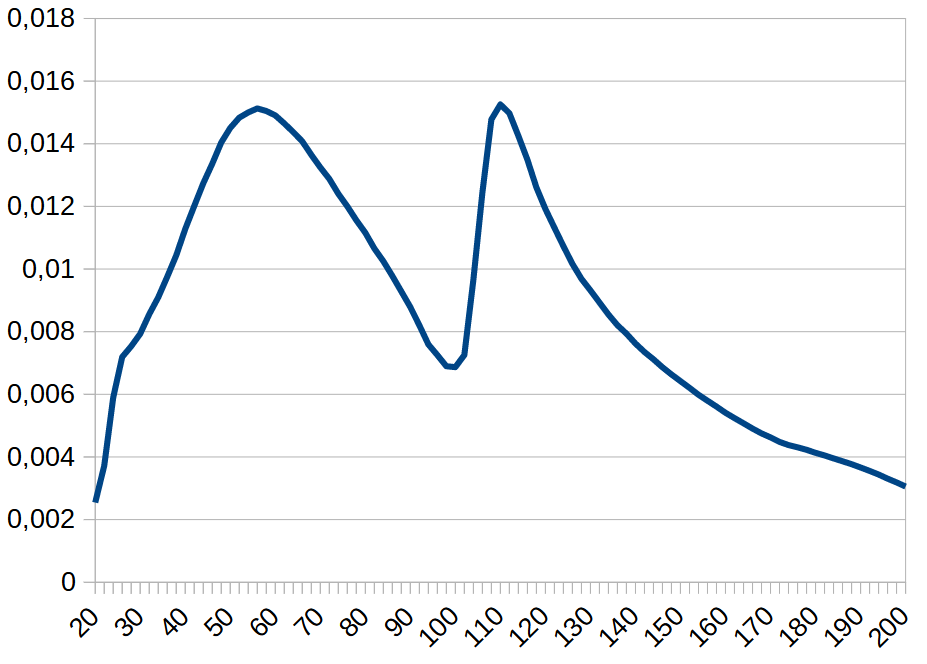
I wonder if I can compensate the peaks and valleys away using calculations. I don't necessary have to do that in the software.
I can run one sweep without the payload mounted as a reference and store that to a spreadsheet.
Then run a second sweep with the device-under-test mounted, save that to a spreadsheet. And use Excel / Calc to deal with the compensation?
I'll give it a try.

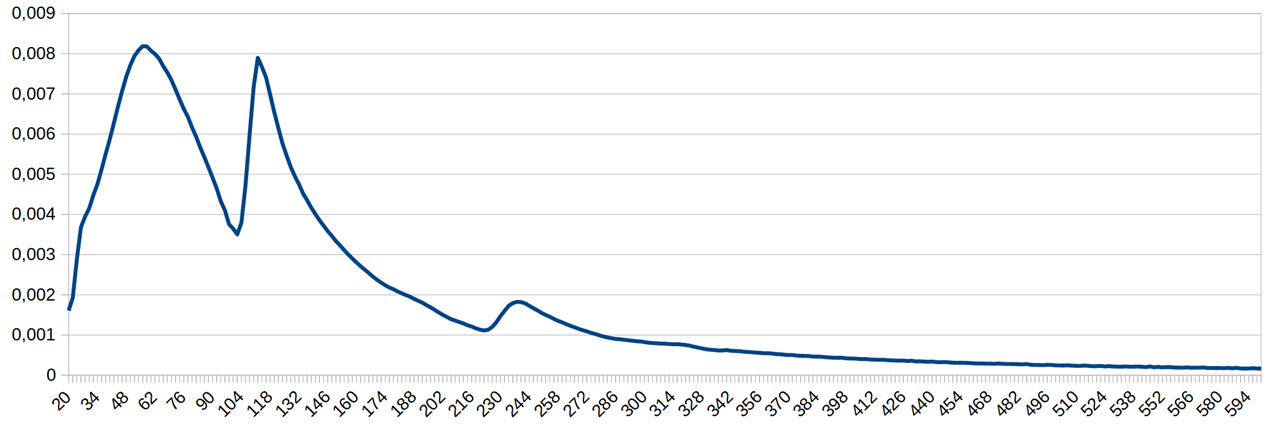
out of curiousity, I ran a wider sweep from 20 Hz to 600 Hz. This time the input signal was 100 mVPP.
image 

Link to all posts.

  • Sign in to reply
element14 Community

element14 is the first online community specifically for engineers. Connect with your peers and get expert answers to your questions.

  • Members
  • Learn
  • Technologies
  • Challenges & Projects
  • Products
  • Store
  • About Us
  • Feedback & Support
  • FAQs
  • Terms of Use
  • Privacy Policy
  • Legal and Copyright Notices
  • Sitemap
  • Cookies

An Avnet Company © 2025 Premier Farnell Limited. All Rights Reserved.

Premier Farnell Ltd, registered in England and Wales (no 00876412), registered office: Farnell House, Forge Lane, Leeds LS12 2NE.

ICP 备案号 10220084.

Follow element14

  • X
  • Facebook
  • linkedin
  • YouTube