element14 Community
element14 Community
    Register Log In
  • Site
  • Search
  • Log In Register
  • About Us
  • Community Hub
    Community Hub
    • What's New on element14
    • Feedback and Support
    • Benefits of Membership
    • Personal Blogs
    • Members Area
    • Achievement Levels
  • Learn
    Learn
    • Ask an Expert
    • eBooks
    • element14 presents
    • Learning Center
    • Tech Spotlight
    • STEM Academy
    • Webinars, Training and Events
    • Learning Groups
  • Technologies
    Technologies
    • 3D Printing
    • FPGA
    • Industrial Automation
    • Internet of Things
    • Power & Energy
    • Sensors
    • Technology Groups
  • Challenges & Projects
    Challenges & Projects
    • Design Challenges
    • element14 presents Projects
    • Project14
    • Arduino Projects
    • Raspberry Pi Projects
    • Project Groups
  • Products
    Products
    • Arduino
    • Avnet Boards Community
    • Dev Tools
    • Manufacturers
    • Multicomp Pro
    • Product Groups
    • Raspberry Pi
    • RoadTests & Reviews
  • Store
    Store
    • Visit Your Store
    • Choose another store...
      • Europe
      •  Austria (German)
      •  Belgium (Dutch, French)
      •  Bulgaria (Bulgarian)
      •  Czech Republic (Czech)
      •  Denmark (Danish)
      •  Estonia (Estonian)
      •  Finland (Finnish)
      •  France (French)
      •  Germany (German)
      •  Hungary (Hungarian)
      •  Ireland
      •  Israel
      •  Italy (Italian)
      •  Latvia (Latvian)
      •  
      •  Lithuania (Lithuanian)
      •  Netherlands (Dutch)
      •  Norway (Norwegian)
      •  Poland (Polish)
      •  Portugal (Portuguese)
      •  Romania (Romanian)
      •  Russia (Russian)
      •  Slovakia (Slovak)
      •  Slovenia (Slovenian)
      •  Spain (Spanish)
      •  Sweden (Swedish)
      •  Switzerland(German, French)
      •  Turkey (Turkish)
      •  United Kingdom
      • Asia Pacific
      •  Australia
      •  China
      •  Hong Kong
      •  India
      •  Korea (Korean)
      •  Malaysia
      •  New Zealand
      •  Philippines
      •  Singapore
      •  Taiwan
      •  Thailand (Thai)
      • Americas
      •  Brazil (Portuguese)
      •  Canada
      •  Mexico (Spanish)
      •  United States
      Can't find the country/region you're looking for? Visit our export site or find a local distributor.
  • Translate
  • Profile
  • Settings
Test & Tools
  • Technologies
  • More
Test & Tools
Blog Sound and Vibration Measurement: Frequency Band analysis of the test jig - can I make it linear?
  • Blog
  • Forum
  • Documents
  • Files
  • Members
  • Mentions
  • Sub-Groups
  • Tags
  • More
  • Cancel
  • New
Join Test & Tools to participate - click to join for free!
  • Share
  • More
  • Cancel
Group Actions
  • Group RSS
  • More
  • Cancel
Engagement
  • Author Author: Jan Cumps
  • Date Created: 1 May 2022 10:57 AM Date Created
  • Views 1513 views
  • Likes 7 likes
  • Comments 1 comment
  • RoadTest
  • raspberry
  • mcc172
  • labview
  • vibration
Related
Recommended

Sound and Vibration Measurement: Frequency Band analysis of the test jig - can I make it linear?

Jan Cumps
Jan Cumps
1 May 2022
Sound and Vibration Measurement: Frequency Band analysis of the test jig - can I make it linear?

For the Sound and Vibration Measurement Hat for Raspberry Pi road test, I'm reviewing Measurement Computing's IEPE Measurement DAQ HAT for Raspberry Pi.
In this post I try to introduce linearity in the test gig by compensating peaks and valleys.

You don't have permission to edit metadata of this video.
Edit media
x
image
Upload Preview
image

To get the correction factor, I'll run a sweep with the same settings as the final test, record the RMS then calculate how to correct.

In the previous post, it turned out that the vibration jig has two peaks in the active range, 56 and 112 Hz. I'm now going to try to compensate for that, by adapting the test jig input signal to that curve. The spreadsheet below is a run of 30 to 130 Hz, with a 1 Hz increment, input amplitude 0.5 VPP. Column C is the acceleration (in gRMS) per frequency stop.

image

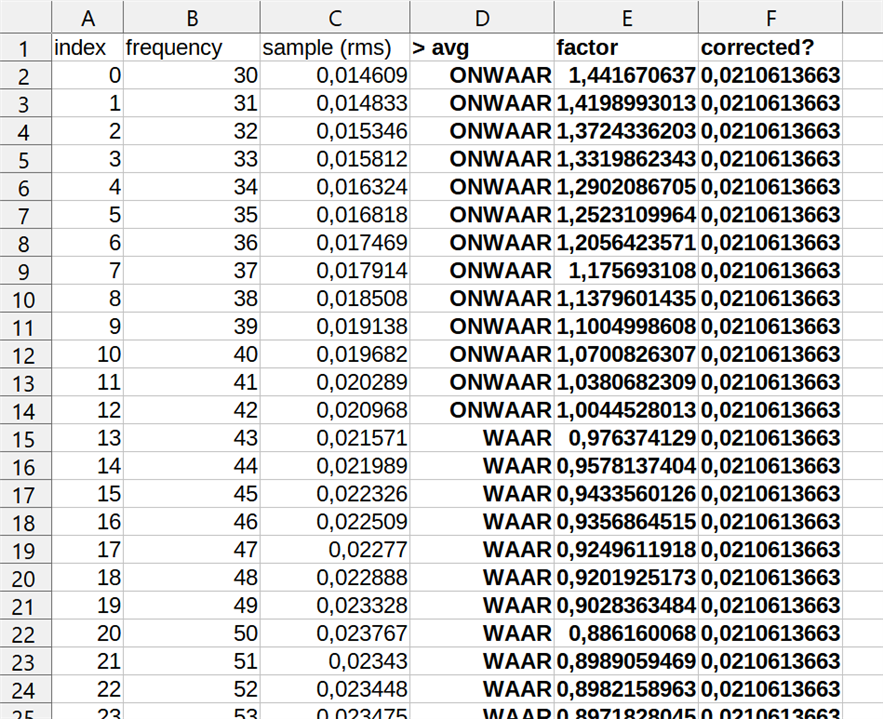
Column E is the correction factor per frequency. Calculated by dividing average by actual measurement. I'm now trying to create a flow that can read this info and adapt the input. Then check if this gives a flatter curve between 30 and 130 Hz. Average gRMS accross the range turns out to be 0.0210613663366337. Where the measured acceleration is above the average, the correction factor is < 0. When below average, it's > 0. In this initial exercise, I'm going to multiply the set VPP with the factor for each frequency. 
I'm writing this blog as I try this, so it's a real-time record of failure or success.

To Do: make the flow with correction mechanism, sweep and look at the output. Will it be linear?

Exercise done. The results are good. This the output of the sensor for 30 - 130 Hz, where I compensated the shaker's input at each frequency. I used the factors calculated above
image

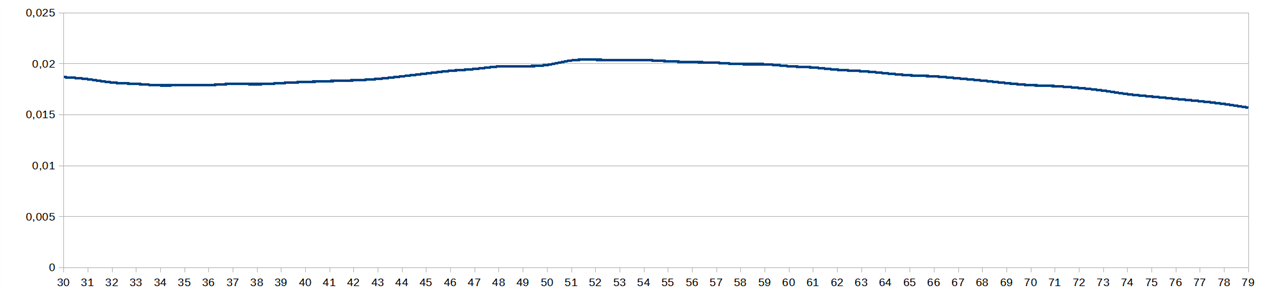
For reference, this is how the same measurement looks like without compensation:
image

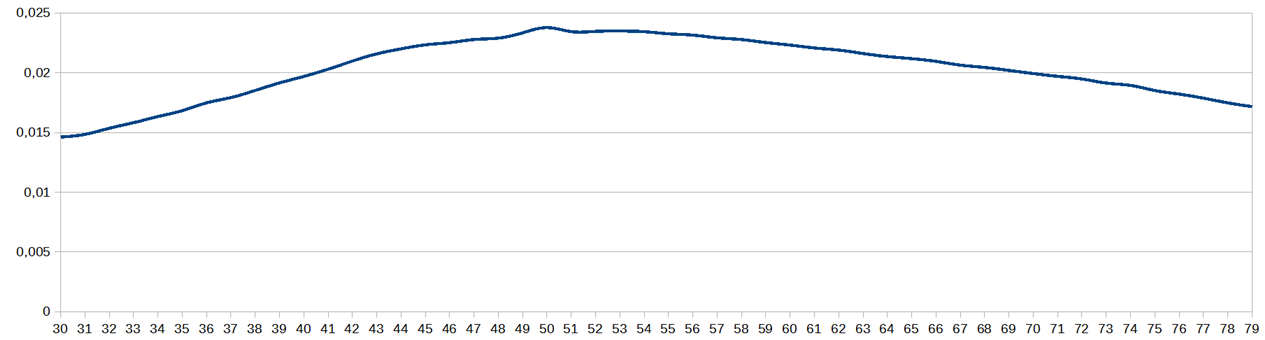
LabVIEW flow changes for compensation

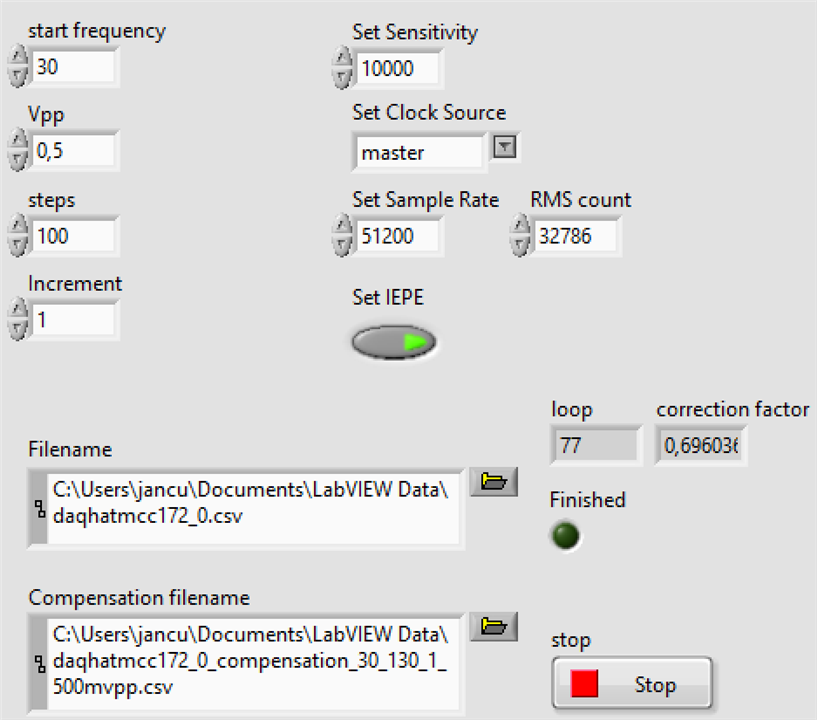
The front panel has a few controls more. A file selector for the spreadsheet with compensation values, and an indicator of the current correction factor that's applied to the jig's input signal:

image

Read Compensation Spreadsheet in Array

image
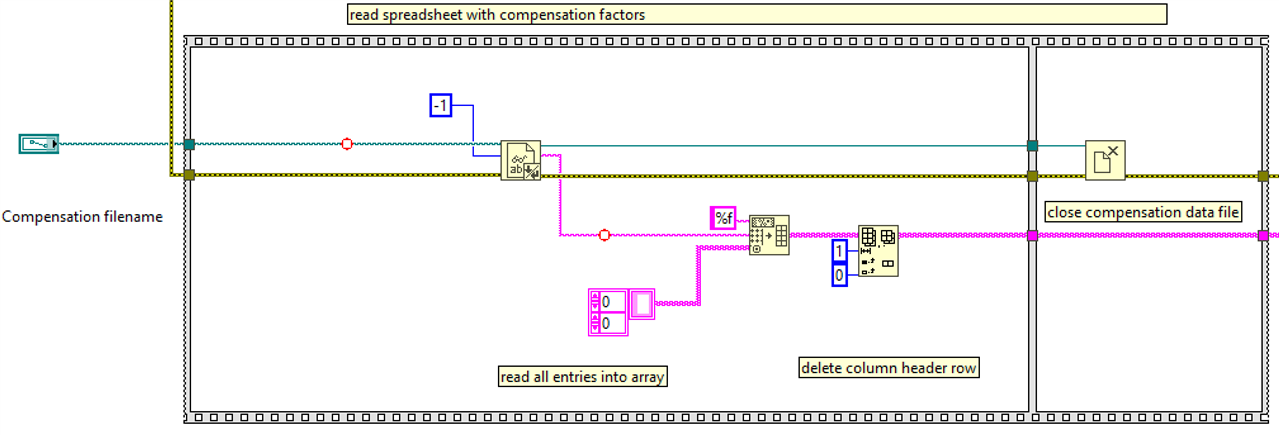
At the start of the flow, while instruments are initialised, the compensation spreadsheet is read into an array. The file is closed, because not needed anymore. The loop will retrieve the correct compensation factor from the array.

Apply Compensation

Inside the sweep loop, at each step, the compensation value is read from the array, and applied to the shaker's input signal amplitude.
image

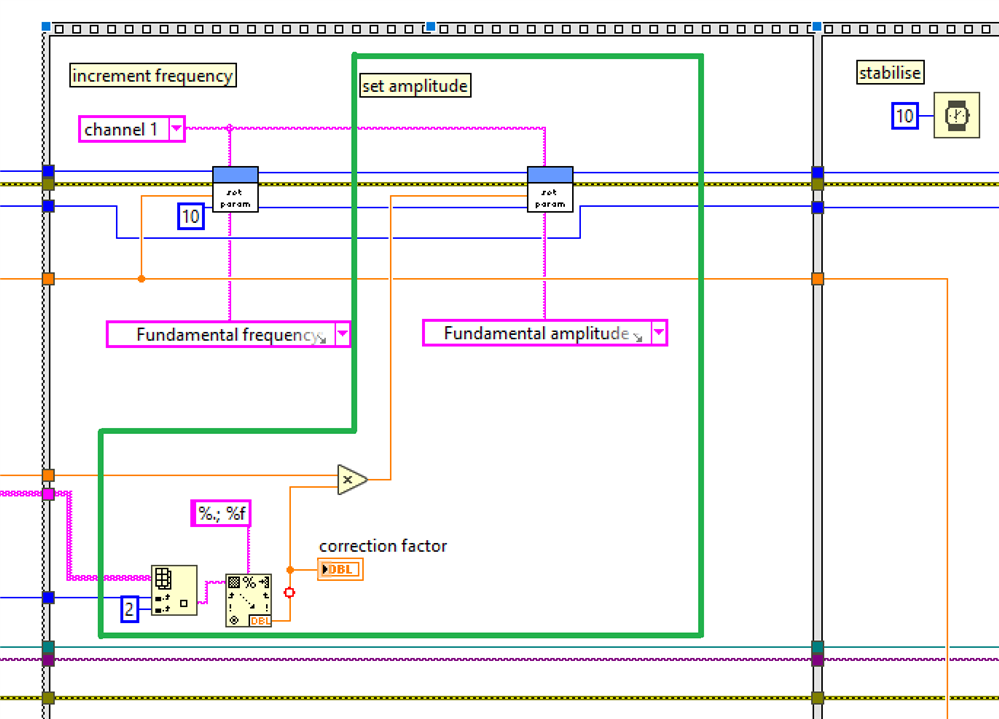
The flow is expecting that the right conversion factor appears in sync in the spreadsheet. If you between 30 and 40 Hz, in steps of 1 Hz, the spreadsheet should have records for 30, 31, 32 ... in sequence. A future function could be a lookup based on active frequency, but I'm not planning for that now.

An action shot of the variables of the flow at a given frequency in the sweep (37 Hz):
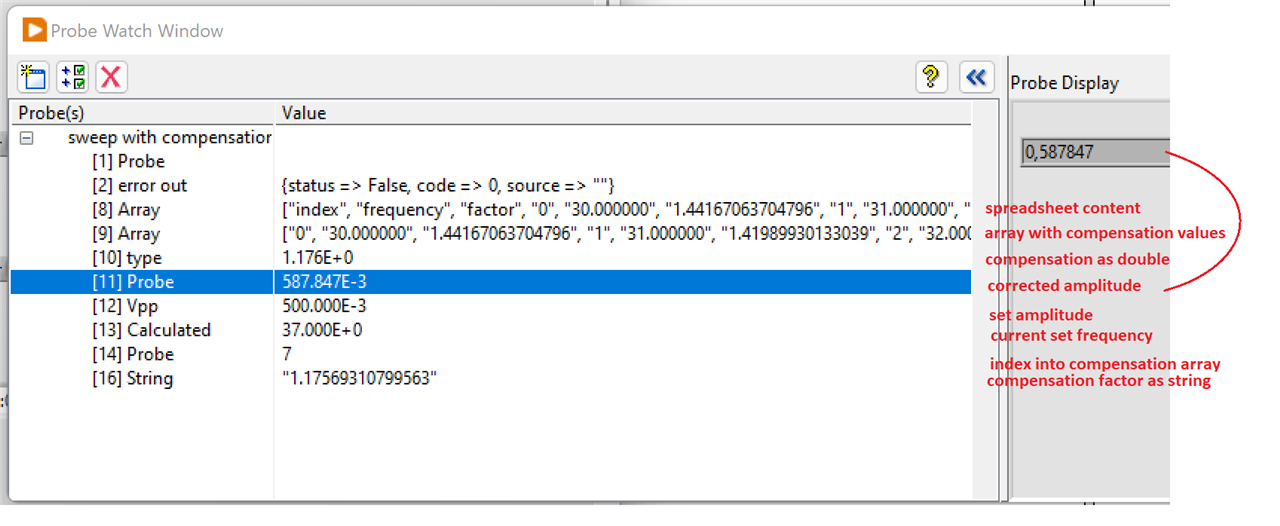
image

Link to all posts.

  • Sign in to reply
Parents
  • Jan Cumps
    Jan Cumps over 3 years ago

    Comparison of 30 - 130 Hz compensation

    image

    • Cancel
    • Vote Up 0 Vote Down
    • Sign in to reply
    • More
    • Cancel
Comment
  • Jan Cumps
    Jan Cumps over 3 years ago

    Comparison of 30 - 130 Hz compensation

    image

    • Cancel
    • Vote Up 0 Vote Down
    • Sign in to reply
    • More
    • Cancel
Children
No Data
element14 Community

element14 is the first online community specifically for engineers. Connect with your peers and get expert answers to your questions.

  • Members
  • Learn
  • Technologies
  • Challenges & Projects
  • Products
  • Store
  • About Us
  • Feedback & Support
  • FAQs
  • Terms of Use
  • Privacy Policy
  • Legal and Copyright Notices
  • Sitemap
  • Cookies

An Avnet Company © 2025 Premier Farnell Limited. All Rights Reserved.

Premier Farnell Ltd, registered in England and Wales (no 00876412), registered office: Farnell House, Forge Lane, Leeds LS12 2NE.

ICP 备案号 10220084.

Follow element14

  • X
  • Facebook
  • linkedin
  • YouTube