


Title: Vital Care
By: Md. Kamrul Hussain
Project Category: Design Challenge
Project Name: Design For A Cause 2021
Blog post: 06
Previous Blogs:
Blog No. | Title |
|---|---|
| 01 | Introduction |
| 02.a | SpO2 basics [PPG] |
| 02.b | SpO2 [MAX30102] |
| 03 | Temperature |
| 04 | ECG - AD8232 |
"Respiration Monitoring is a highly informative indicator of physiological state (Braun 1990) and the most sensitive vital sign marker of clinical deterioration (Schein et al 1990, Goldhill et al 1999, Ridley 2005, Cretikos et al 2008). Continuous monitoring of Respiration Rate [RR] provides valuable information regarding patient health status in hospital (Royal College of Physicians 2012), home and community settings (Bonato 2010).
Only a small number of wearable sensors are capable of continuously measuring respiratory rate compared with other key physiological parameters, such as heart rate, temperature and blood oxygen saturation (Hao and Foster 2008)." - https://iopscience.iop.org/article/10.1088/0967-3334/37/4/610
In this blog I’ll share my experiment on respiration monitor mostly to find out the respiration rate. I have previously worked on respiration monitoring using Impedance measurement. I shared the outcome in the first part of this blog. Then I tried to get respiration info from Photoplethymography and ECG signal. I compared all this three method. At the end I put my verdict on which will be the better solution.
Impedance Pneumography [IP] :
Impedance pneumography is a technique for measuring instantaneous lung aeration changes (breathing) as changes in the thoracic electrical impedance through skin electrodes.
Bioimpedance analysis has been applied in the measurement of body composition and as a measurement tool in healthcare. In recent years, the clinical use of bioimpedance acquisition has gained significant interest in pneumology due to its applicability in the monitoring of variables related to pulmonary function like tidal volume distribution and respiratory rate. IP is a commonly used technique for monitoring respiratory rate.
This assessment is based on the fact that during breathing, the chest generates an impedance. During inspiration, the decrease in pleural pressionas result of inspiratory muscle contraction generates a negative intralveolar pressure, bellow atmospheric pressure, that finally moves air to the lung, expanding the thorax and inducing a decrease in tissue conductivity. Furthermore, the conductivity increases due to thoracic expansion. These changes produced during inspiration imply an increase in the electrical impedance relative to the basal impedance, which can be related to the changes in volume.
courtesy - Simple Wireless Impedance Pneumography System for Unobtrusive Sensing of Respiration
Basic principle –
The basic principle of this technique is pretty simple. A limited current at certain frequency is passed through the body and the impedance is calculated by measuring the voltage output across the surface. There are several techniques of measuring impedance ->
- two electrode - bipolar
- three electrode - tripolar
- four electrode method - tetrapolar
Among them four electrode method is immune to contact impedance from the current injecting electrodes. Therefore, it gives better result and I am going to use it for my experiment.
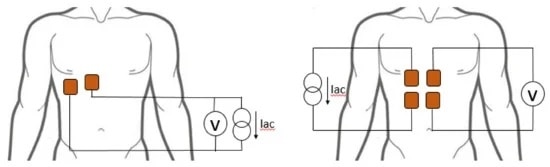
Figure: bipolar (left) and tetrapolar (right) configuration
An alternating current of around 10KHz – 50 KHz is injected into the chest using surface electrodes. The current causes a potential difference that is measured between the electrodes.
The equivalent resistance = voltage in the receiving electrode(s) / the current applied to the tissue.
courtesy - Simple Wireless Impedance Pneumography System for Unobtrusive Sensing of Respiration
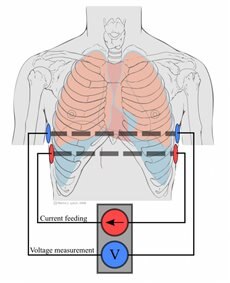
Depth and sensitivity -
For tetrapolar system, the sensitivity of the system depends on the distance between the electrodes.


The concentrated blue area represents the maximum sensitive zone.
The depth of that zone, Dsenmax = distance between electrodes / 3
The lung surface is approximately 10 to 20 mm beneath the skin in the region of the medial scapular or midclavicular line.
Considering the depth of the maximum sensitive zone should be about 20mm -
The minimum electrode distance should be 20 * 3 = 60mm.
Safety Consideration -
Applying current to body implies several parameter to consider –
- current intensity
- pulse duration / exposure time
- body impedance and
- current frequency
Regardless of exposure time –
Safe allowable current = 1mA peak
Frequency 1kHz to 100 KHz
Regarding the frequency of the alternating current, if the current frequency increases it could decrease the risks of ventricular fibrillation. However, the risk of burns increases. I have used 10KHz.
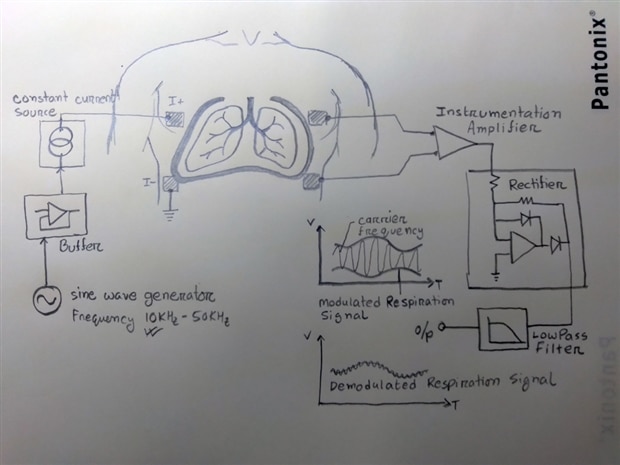
Block Diagram of the Process -
Circuit Diagram for Tetra-polar Measurement -
Wave generator - Wein Bridge oscillator [sine wave up to 10KHz] 1 - 2 Vp-p
Current source - Howland Constant Current Source at 1mA
Voltage measuring circuit - AD620 Instrumentation amplifier from Analog Device with high CMRR


Figure: LEFT - current source and Bio-amp circuit RIGHT - rectifier and smoothing filter circuit
Further post processing of the signal is necessary like filtering and rectification to feed the output voltage into a microcontroller and calculate the impedance. The rectification can be done in hardware, whereas filtering and conditioning of the signal can be implemented in MCU.
OUTPUT -
I have used a DAQ software developed by Biomedical Physics and Technology Department, University of Dhaka to observe the Respiration / Pneumography curve.
Other Approaches -
The output of Impedance Pneumograph seems to be fine, and the advantage of this approach is that we can get all the exhale-inhale points of the Pneumograph. But the analog front end circuit is complex for a wearable device and it needs tight-fitting band to place the electrodes around the thorax.. Furthermore my target is to get a simple Pneumograph with exhale - inhale peaks only for the respiration rate calculation. Therefore, I would like to consider other approach like respiration derived from Photoplethysmography and ECG signal. Physiological mechanisms cause both signals to be modulated by respiration. Three types of modulation can be observed, as shown in the figure below -
baseline wander (BW),
amplitude modulation (AM), and
frequency modulation (FM)
Respiration Rate - RR can be estimated from these signals without encumbering the subject with extra sensors.
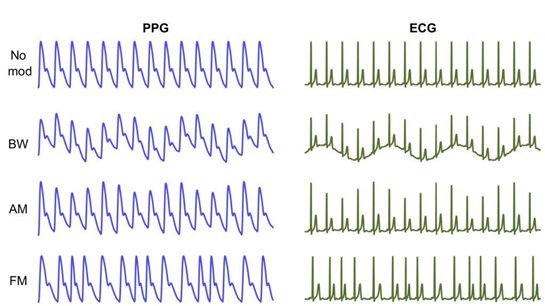
Idealised respiratory modulations of the PPG (left) and ECG (right). From top: no modulation, baseline wander (BW), amplitude modulation (AM), and frequency modulation (FM).
courtesy - https://iopscience.iop.org/article/10.1088/0967-3334/37/4/610
Respiration signal can be achieved by applying filter for baseline wander or feature-based extraction for AM and FM modulation -
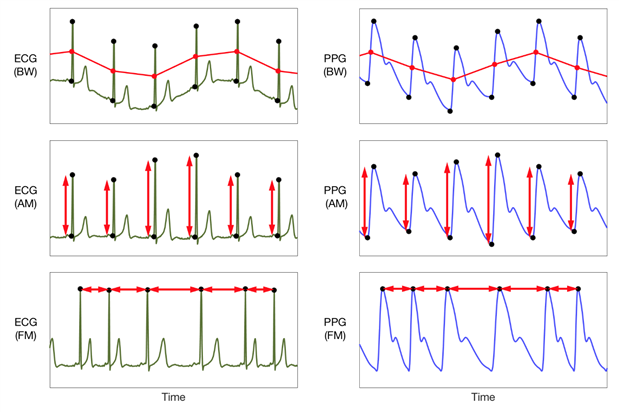
courtesy - https://iopscience.iop.org/article/10.1088/0967-3334/37/4/610
Respiration from PPG [Photoplethysmogram]
I have used MAX30102 to measure SPO2 using Arduino NANO 33 IOT board. The RED and IR PPG signal can be used to get respiratory signal. My blog regarding measuring SpO2 can be found here - SpO2 [MAX30102]


Respiratory-induced variations in the PPG:
RIAV - is the change in pulse strength.
RIIV - is the variation of perfusion baseline.
RIFV - is a synchronization of the heart beat with the RR.
In my design I would like to implement moving average filters to detect RIIV. This will give me a Filter-based respiratory signal.


Figure: the baseline wander can be observed in both IR [left] and Red [right] PPG signal acquired from MAX30102 module
I have applied two simple moving average filters on IR PPG to find out the respiratory signal. The Orange and Grey plots are the filter-based respiratory [RIIV] signals with filter coefficients of 0.1 and 0.01 respectively -


Figure: RIIV - filtered respiratory signal from IR PPG for normal breathing [LEFT] and forced / deep breathing [RIGHT]
Code Snippets -
#include <Ewma.h>
#include <EwmaT.h>
Ewma adcFilter2(0.1);
Ewma adcFilter1(0.05);


//#include <KickFiltersRT.h>

//-------------other codes------------
//-------------------------------------
//PPG to RESPIRATION code snippet:

     redBuffer[i] = particleSensor.getRed();
      irBuffer[i] = particleSensor.getIR();
      particleSensor.nextSample(); //We're finished with this sample so move to next sample


      //send samples and calculation result to terminal program through UART
      //Serial.print(F("RED= "));
      //Serial.print(redBuffer[i], DEC);
      //Serial.print('\t');

      Serial.print(F("IR= "));
      Serial.print(irBuffer[i], DEC);
      Serial.print('\t');


      float filtered1 = adcFilter1.filter(irBuffer[i]);
      float filtered2 = adcFilter2.filter(filtered1);


      Serial.print(F("filtered1= "));
      Serial.print(filtered1);
      Serial.print('\t');

      Serial.print(F("filtered2= "));
      Serial.println(filtered2);
Respiration from ECG
My third approach will be the EDR (ECG-Derived Respiration) technique which is based on the observation that the amplitude of the R-peak reflects the respiratory signal of exhale and inhale points. This happens due to the relatively constant mean impedance of ~500 Ω, which varies depending on the position of the electrodes and the subject’s skin characteristics.
I have used AD8232 single LEAD ECG module to get the ECG signal with an Arduino MKR WiFi 1010 board in this project. My blog regarding that can be found here - ECG - AD8232.
Now - when I performed the signal conditioning using notch, low pass and high pass filter, the output signal clearly showed the variation of R-peak amplitude due to respiration. This variation becomes more significantly visible when the derivatives and squaring function amplifies the QRS peak. The following figures show the filtered outputs which can derive the respiratory signal -


Comparison of PPG and ECG to derive Respiratory Signal -
The ECG plots are much stable than PPG. As the PPG signal is taken from the finger tip or the wrist, any sudden movement deflects the signal and hence the derived respiratory signal is also attenuated. Moreover, the ECG derived respiratory signal seems better on Arduino IOT cloud dashboard too. It sends data at 1 second period. I have a respiration rate of around 15 to 20 per minute. So, it takes about 3 to 4 seconds for one respiratory cycle. -

Figure - PPG derived respiration curve on Cloud dashboard
Figure - ECG derived respiration curve on Cloud dashboard
Conclusion -
It would be better if I could implement the impedance based respiration monitor in this project. It gives all the points during exhale and inhale. But due to the time constrain and complexity of the circuit to make it wearable, I have to move on with PPG or ECG derived respiratory signal. And my choice will be ECG, as it performs better for wearable device.
However, instead of the AD8232 module, similar chips with built-in respiratory signal acquisition system like ADS129xR from Texas Instruments or ADAS100 from Analog Devices Inc. can be used too. I'll keep that for future experiment.
Top Comments