 The goal of this blog is to detail the construction of the electronic components that will be contained within a Hammond Manufacturing enclosure. The intention of this is to evaluate the impact of the enclosure's environment on the electronics. As part of a Design Challenge titled Experimenting with Extreme Environments, sponsored by Hammond Manufacturing, I composed this extra credit blog. This blog is the 4th in a series of extra credit blogs that address crucial steps taken towards my final challenge blog Final Results -- IoT Device Protection in Harsh Environments
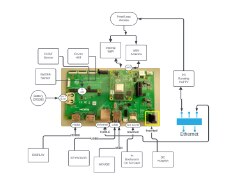
Electronics Diagram
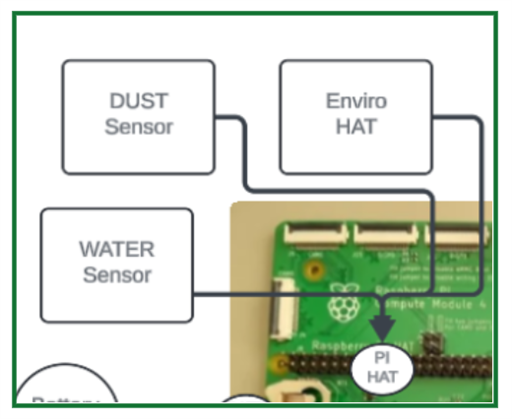
This diagram shows the Pi 4 Compute Module and the I/O Board. The Raspberry Pi Bookworm OS image is on an SD card, which goes into the SD card slot on the I/O Board. To collect environmental data, sensors (Eviron HAT, Water & Dust) are connected to the "PI Hat Header GPIO Pins." The Antennas (Internal & attached RF Antenna) on the CM4 allow headless access to the WiFi network from a PC running PuTTY. When testing the electronics in an enclosure, the Battery powers the I/O Board. In Desktop mode, DC power is used to power the I/O board. Additionally, the Display, Mouse, and Keyboard are connected to the I/O board, allowing the user to interact with the Bookworm (PI OS) GNOME desktop. An ethernet cable is used to connect to the same network as the PC, making it easier to update and install the system during development.
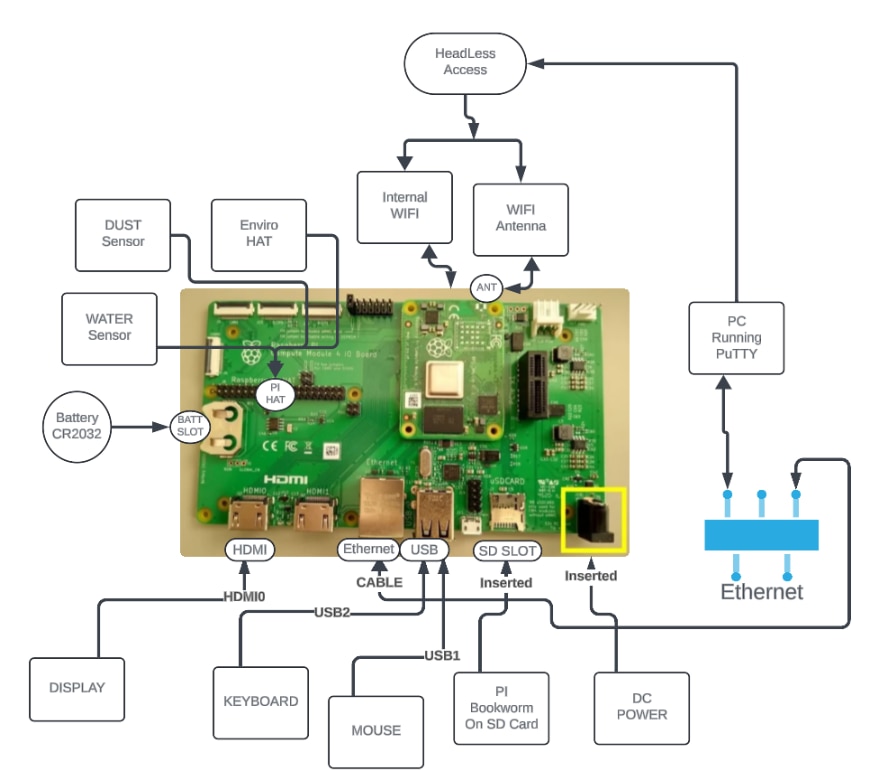
Mechanical diagram
My Other PI Projects
These are a few of my projects that use the PI and PI hats. It also contains a project that uses my Groove Modules for Dust and Moisture,
-
One Meter of Pi
This "1 Meter of Pi“ design challenge hosted by element14 was a fantastic opportunity to showcase the capabilities of the Raspberry Pi and its GPIO pins. I eagerly took on this challenge, utilizing two hats to establish connections to the 28 GPIO pins. This 10 Blog Series showcases how to connect to and control the 28 GPIO pins, providing a valuable resource for myself, fellow makers and electronics enthusiasts.
This link will take you to the TOC for My project INTRODUCTION BLOG -Edible Algae System - (Growing Spirulina in space)
Firstly, I employed the GPIO Zero library, which offers a user-friendly interface for working with the Raspberry Pi's GPIO pins. This library simplifies the process of setting up and controlling the pins, enabling me to focus on the creative aspects of the project.
Next, I used two hats to extend the functionality of the Raspberry Pi. The first hat was a GPIO expansion Hat (PIM486 Enviro HAT). The second hat was an Automation Hat. With the hardware setup in place, I embarked on the software development phase. I utilized Python as the programming language, leveraging its simplicity and versatility.
The only problem with using these Expansion hats is that once connected to the 28 Pin GPIO header, there are no pins exposed to connect Other sensors. A solution in an element14 blog “Aquaponics Box: #2 - Hacking the HATs” shows how to connect both Hats to the pins using jumper wires.. This blog is very helpful in wiring the Pins on the GPIO PI Header.
-
Just Encase
For this challenge Just Encase, I created a blog series called “Case Enclosure Reliability Monitor”. If anyone is interested in this series, Blog#1 - Introduction is a starting point for the series. It contains an introduction and a table of contents to the other blogs. In this blog post, I introduce the Design Challenge, which involves two useful sensors capable of detecting moisture and dust. Although the challenge utilized Arduino MCUs, that aspect is not relevant to the current discussion, but this blog post BLOG#5 Testing Part 2 , describes how I utilize the two sensors. The code is written for Arduino, however I give some references to the sensors: Grove - Dust Sensor(PPD42NS)and a Grove - Water Sensor
Headless and PI OS Desktop Access
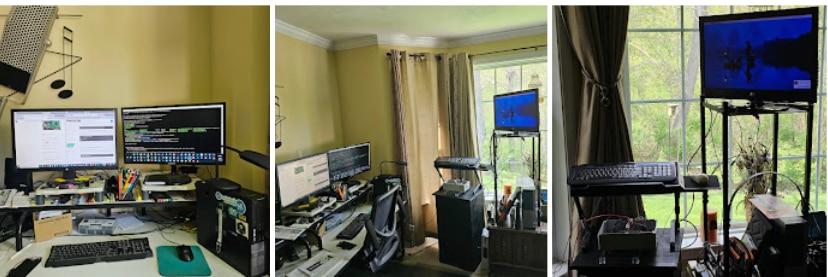
I have configured two access points to interact with the PI OS on the SD card on the Module: Desktop and Headless.
The MIDDLE photo above shows my setup, with the RIGHT photo showing my DESKTOP, and the LEFT phot showing my Headless setup using my PC
This is a closeup of the enclosure with the Electronics attached
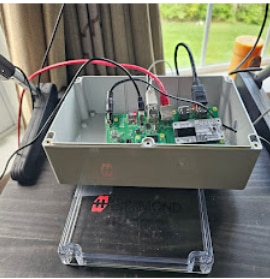
Desktop: By connecting a display, keyboard, and mouse, you can access the PI OS GNOME desktop. This access type serves the development of Python scripts, enabling programming, testing, and debugging. The GNOME desktop environment offers a more intuitive, integrated, and productive development experience compared to the command line, making it a popular choice for many software developers.
Headless: Via a terminal connection over Wi-Fi, you can access the Headless mode.
This access type will execute Python scripts during the reliability test mentioned in Blog#5. To log in to the PI over Wi-Fi, I use Putty on my PC.
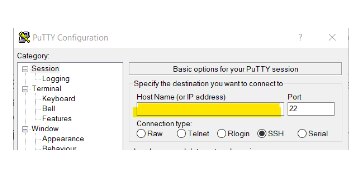 You will need the IP address of the CM4. you can attain this using the ifconfig command. After running this command from a terminal session on the CM4, the ip address is a ip4 address displayed in the results as “inet x.x.x.x”.
Use this ip address as the “Host Name” prompt in the PuTTY app running on a PC (Windows/Linux) and give your Login credentials.
Now that you have successfully logged into the Bookworm image on the CM4, you can input commands and execute the Python examples.
POWER
The electronic components contained within the enclosure require electrical power to operate. How can sufficient electrical power be obtained to energize and operate the Compute Module 4 kit with Wi-Fi access? Two options exist on the I/O board:: a CR2032 battery and a micro USB connector to a Solar Power bank. Another option could be a 9v battery with a barrel connector, that might be able to connect to the j19 power connector. These options could be utilized to power the electronic components in a self-contained manner, eliminating the need for cords. Hopefully, one of these two options will suffice.
The documented power requirement is a 12V power supply. The board features an external power connector (J19) that accepts a 2.1mm DC tip with a positive 12V input. This will provide adequate power for the Compute Module 4 and any additional peripherals connected to the board. When utilizing a 12V power supply, it can be directly connected to the 12V input connector (J19) on the IO Board. The board will only draw the necessary power, so a power supply with a higher amperage (e.g., 3.7A) will not cause any problems. The IO Board has an on-board 12V to 5V DC-DC converter, allowing you to connect a 5V power supply to the external power connector (J20) if you need to power additional 5V components. In summary, the recommended method for powering the Compute Module 4 IO Board is to use a 12V 3.7A power supply connected to the external power connector (J19) on the board. If necessary, a 5V power supply can be connected to the J20 connector.
CR2032 3v Lithium Battery Connector
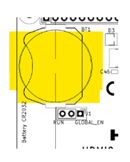 To use the battery without using the DC power adaptor, will allow the CM4 to run the in enclosure without DC power. It will be able to operate over WiFi using the Headless scenario described above. Unfortunately, this did not power up the I/O board. I was unable to get this to work.
9v Battery with a barrel connector
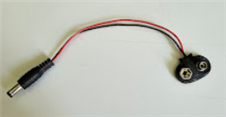 Using the 12v Input External Power Connector (J19). Plugging this connector into it to supply 9v power. Is this possible?
Unfortunately, this did not power up the I/O board. I was unable to get this to work.
Micro USB connector
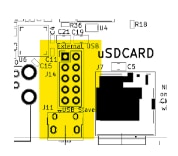
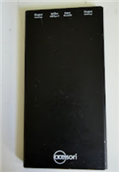 This is a USB Slave. Is it possible to connect a Micro USB cable to a charger to supply power to the Kit? I noticed that this connection is made to the PC, the mouse, no longer works on the board?
I have used this power bank for other projects using an Arduino and it works quit well.
This did not work for me.
5V power supply to the external power connector (J20)
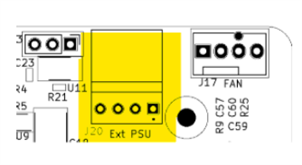 This is an external Power Supply Unit (PSU) connector.
Is it feasible to use this connector to power the system?
What type of cord is necessary for this connection?
12v Input External Power Connector (J19)
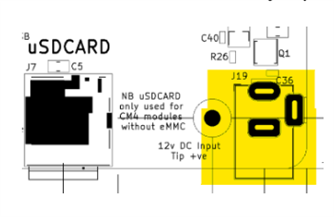 This seems like the only option for powering the system.
This power connector accepts a 2.1mm DC tip with a positive 12V input. It needs to be plugged into an electrical outlet. This means that the enclosure will require the cord with a barrel connector to be passed through the enclosure. It also makes the system enclosure less watertight and less remote since it needs to be placed to an electrical outlet.
Raspberry Pi HAT connector
The Raspberry Pi Compute Module 4 IO Board has a standard Raspberry Pi 40 way HAT connector.
Expansion Header
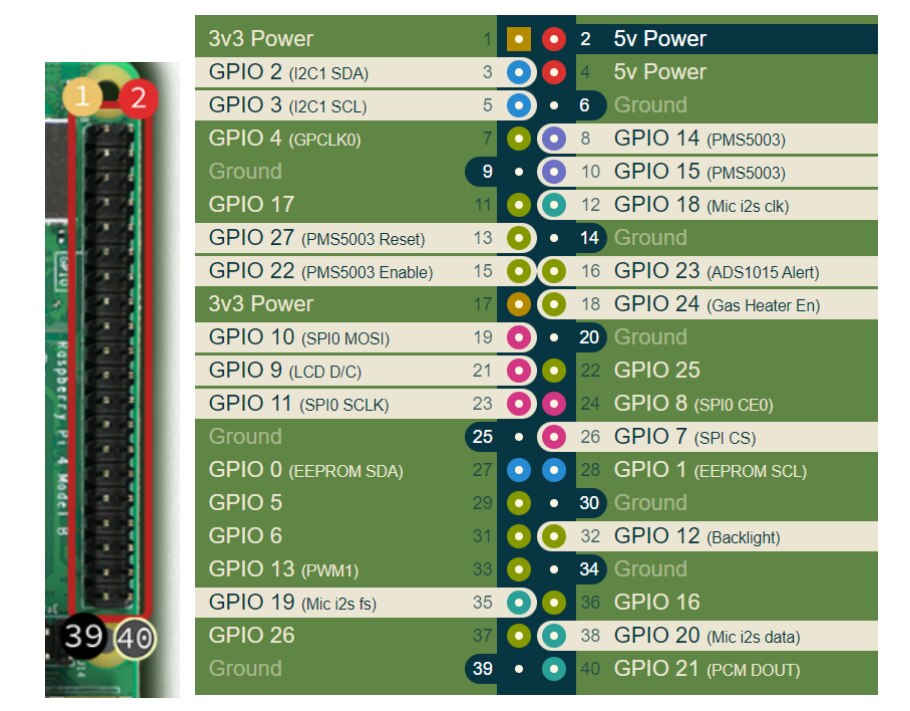
The Raspberry Pi Compute Module 4 IO development board contains a single 40-pin expansion header labeled as 'J8' 'Raspberry Pi HAT' providing access to 28 unique GPIO pins. .The header pin relation is shown in the picture of the J8 Header below.
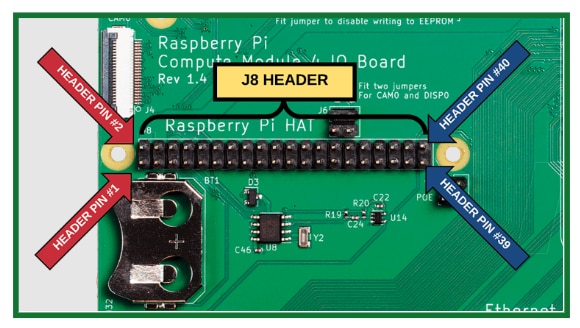
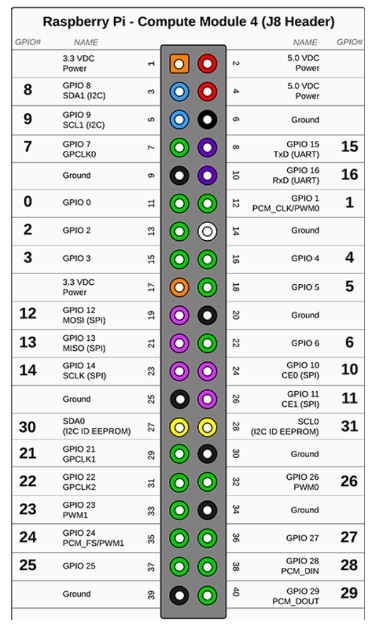
GPIO Pinout (40-pin J8 Header)
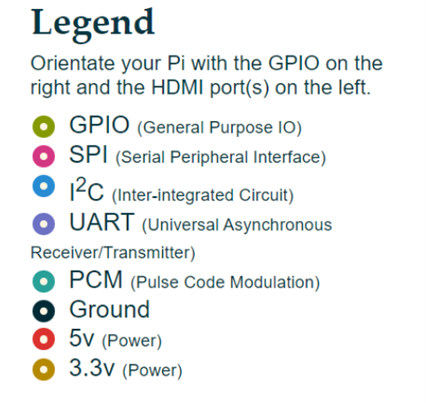
The diagram below illustrates the GPIO pinout using the Pi4J/WiringPi GPIO numbering scheme.
Sensors attached to the Raspberry Pi HAT HEADER Pins
PIM486 Enviro HAT for Raspberry Pi
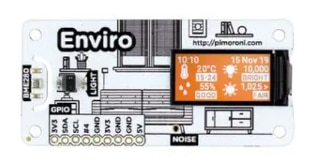
Enviro + Air Quality features
- BME280 temperature, pressure, humidity sensor (datasheet)
- LTR-559 light and proximity sensor (datasheet)
- MICS6814 analog gas sensor (datasheet)
- ADS1015 analog to digital converter (ADC) (datasheet) *
- MEMS microphone (datasheet)
- 0.96" color LCD (160x80)
- Connector for particulate matter (PM) sensor (available separately)
- Pimoroni breakout-compatible pin header
- pHAT-format board
- Fully-assembled
- Compatible with all 40-pin header Raspberry Pi models
- Pinout
- Python library
- Dimensions: 65x30x8.5mm
- Schematics - Enviro / Enviro + Air Quality
Enviro Resources
- PIM486 Enviro HAT for Raspberry Pi This was research I did for the challenge 1 Meter of PI where I used it to monitor the environment
- Getting Started with Enviro+ This tutorial walks you through how to install the software, how to run the code examples, and how to use the Python library.
- Enviro for Raspberry Pi – Enviro
- Enviro Python Library on GitHub
Connecting the Enviro+ to the Pi 4 CM I/O Board HAT Connector
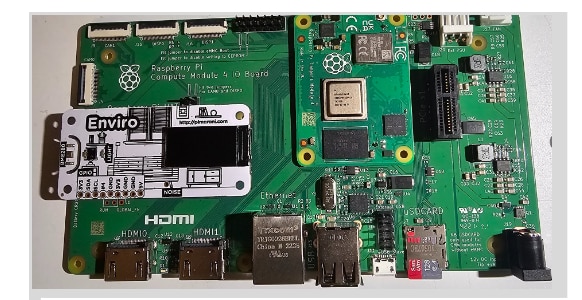
The pinouts seem to be the same as the HAT headers depicted above. The relation of the pin numbering is important and I had a hard time finding a diagram of how to insert the Enviro to the HAT header?
Here is how the Enviro+ is attached to the PI HAT. It shows the PIN alignment on the Enviro+ you will need to flip the female pins on the Enviro so pin 1 is 2 and 2 is 1.
Getting started
I used the Getting Started with Enviro+ to install the software, how to run the code examples, and how to use the Python library. Following are my notes as I walked through the tutorial.
- Installing the Enviro+ Python library
- First it's a great idea to start with a fresh install of Raspberry Pi OS or, if not, then make sure that you run sudo apt update and sudo apt upgrade in the terminal to get everything up-to-date.
- Open a terminal and then type the following:
git clone https://github.com/pimoroni/enviroplus-python
cd enviroplus-python
./install.sh
- Some info from the log Screen
Creating a new virtual Python environment in /home/skruglewicz/.virtualenvs/pimoroni, please wait...Checking for /home/skruglewicz/Pimoroni/auto_venv.shCreating /home/skruglewicz/Pimoroni/auto_venv.shGenerating documentation.Documentation saved to /home/skruglewicz/Pimoroni/enviroplus/docsDone!
NEXT
Once that's all done, type sudo reboot to reboot your Pi and apply the changes to the Pi's interfaces.
Running the examples
You can run the examples from a terminal.
To run the examples, first switch to your virtual environment using the command:
source ~/.virtualenvs/pimoroni/bin/activate
The examples are available in the examples folder within the enviroplus-python folder. To view the available examples in the terminal, type the following commands:cd enviroplus-pythoncd examplesls
When running the examples, press at any time to stop the example.
I ran the following examples:
BME280 WEATHER SENSOR EXAMPLE: python weather.py
USE THIS FOR THE TEST
You'll see the temperature, pressure, and relative humidity values being printed every second or so. Try touching the BME280 sensor and see how the temperature changes, and try breathing close to it to see how the humidity from your breath affects it. Every second or so, the temperature, pressure, and relative humidity values will be displayed. Placing your finger on the BME280 sensor should cause the temperature to change. To observe how your breath affects the humidity, try breathing close to the sensor.
LTR-559 LIGHT AND PROXIMITY EXAMPLE : python light.py
USE THIS FOR THE TEST
- This example displays the current ambient light level in Lux and a value (from zero to a couple of thousand) for the proximity, with larger numbers being closer proximity and vice versa.
0.96" LCD EXAMPLE : python lcd.py
- a simple example that shows you how to write text on a coloured background to the little LCD on Enviro+. The all-in-one example below has a much more complex use of the display to show text and a graph of values.
- PROBLEM the LED screen on the Enviro+ is blank?
ALL-IN-ONE EXAMPLE: python all-in-one.py
- This all-in-one example displays all of the data from the sensors on Enviro+ (with the exception of the microphone) and lets you toggle through each of the variables using the light and proximity sensor.
- Each variable on Enviro+ is displayed on its own screen, with the live reading at the top, and a graph below with values as a line graph and a coloured heatmap-type background with red-ish colours being higher values and blue-ish colors lower. The graph auto-scales to fit the lowest and highest values currently being displayed.
- PROBLEM the LED screen on the Enviro+ is blank?
PROBLEM the LED screen on the Enviro+ is blank?
For the 2 LED EXAMPLES!! Why?
No resolution:
Installed fonts and did all the suggestions
Try to wire the hat with PI wiring?
In terms of wiring, the only modification I made was utilizing GPIO 13 for the Enviro display's backlight, which differs from the standard setup
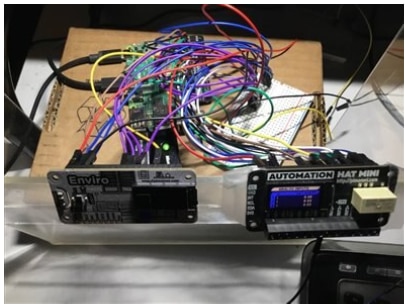
TODO More Research to get the LED DISPLAY TO WORK. IT is unusable for the test. I will use the weather.py and light.py. scripts for my test
Grove - Dust Sensor(PPD42NS)SKU 101020012 (optional)
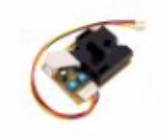 This Dust Sensor gives a good indication of the air quality in an environment by measuring the dust concentration. The Particulate Matter level (PM level) in the air is measured by counting the Low Pulse Occupancy time (LPO time) in a given time unit. LPO time is proportional to PM concentration. This sensor can provide reliable data for air purifier systems; it is responsive to PM of diameter 1μm.
Grove - Water Sensor SKU 101020018 (optional)
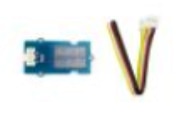 Grove - Water Sensor detects the presence of water using exposed PCB traces. The sensor is made up of interlaced traces of Ground and Sensor signals. The sensor traces are weakly pulled up using 1 MΩ resistor. The resistor will pull the sensor trace value high until a drop of water shorts the sensor trace to the ground trace.
Software
This section contains the software that I used to test the enclosure and Run the electronics placed inside. I used the Getting Started with Enviro+ examples, specifically the weather and light example in the running the examples section
Libraries
The Enviro+ Python library facilitates interaction with the Enviro+ sensor board. It's a collection of tools, each implemented in a distinct Python library. The installer script, install.sh, streamlines the process by automating the installation of all essential libraries.
A critical component of the Enviro+ library is the BME280 weather sensor, showcased in the weather.py example. To utilize this sensor, import the requisite modules from the smbus2 and bme280 libraries. Subsequently, create an instance of the BME280 class to access the functions necessary for reading sensor data.
Usage:
IMPORT
from smbus2 import SMBus
from bme280 import BME280
SETUP
bus = SMBus(1) # creates a I2C bus
bme280 = BME280(i2c_dev=bus) # creates an instance of the BME280 class
FUNCTIONS
bme280.get_temperature() #get temperature
bme280.get_pressure() #get pressure
bme280.get_humidity() #get humidity
Another vital component is the LTR-559 light and proximity sensor, demonstrated in the light.py example. This library, ltr559, is simple, with only two functions for sensor data retrieval. Import the necessary libraries and instantiate the LTR559 class to interact with the sensor.
Usage:
IMPORT
from ltr559 import LTR559
SETUP
ltr = LTR559() # creates an instance of the ltr559
FUNCTION
ltr.get_lux() # get the light intensity
ltr.get_proximity()
The light example also uses the time library and uses a while loop to constantly read values from the sensor.
Usage:
IMPORT
import time
CODE
while True:
get_lux()
time.sleep(1) # use sleep function to pause for 1 second
In conclusion, the Enviro+ Python library simplifies the interfacing process with the Enviro+ sensor board. It consists of a collection of tools, each implemented as an independent Python library. The installation script automates the setup of all necessary libraries. The library supports the BME280 weather sensor and the LTR-559 light and proximity sensor, as exemplified in the weather.py and light.py examples, respectively. For the BME280, the requisite modules are imported from the smbus2 and bme280 libraries, followed by the instantiation of the BME280 class. Key functions include get_temperature(), get_pressure(), and ge\_humidity(). For the LTR-559, the ltr559 library is imported, and the LTR559 class is instantiated. Essential functions are get_lux() and get_proximity(). The light example utilizes a loop to obtain sensor values continuously.
Dashboard Design
At present, the dashboard consists of a basic connection established from a PC running PuTTY. The Python scripts executed on the Raspberry Pi write data to the standard output. A headless connection over Wi-Fi is set up using PuTTY on a PC. In the future, a cloud-based dashboard could be developed to retrieve and visualize the telemetry data. This would necessitate modifications to the scripts to enable the transmission of data to the cloud. This current dashboard has limitations including limited functionality, a lack of user-friendliness, and no visualization or remote accessibility. A future plan is to develop a cloud-based dashboard to address these limitations. This cloud-based dashboard would be more user-friendly, provide visualization capabilities, and be accessible remotely. Requirements for implementing this cloud-based dashboard involve modifying Python scripts, selecting and configuring a cloud platform, and developing and deploying the dashboard. The benefits of a cloud-based dashboard include improved user-friendliness, visualization capabilities, remote accessibility, and the potential for integration with other systems and services.
Conclusions
This blog post details the construction of the electronics that will be housed in an enclosure to test the effects of the environment in an enclosure on the electronics. The Raspberry Pi Bookworm OS image is stored on an SD card and inserted into the I/O Board. Sensors are connected to the "PI Hat Header GPIO Pins" to gather environmental data.
Initially, I planned on utilizing the battery on the Raspberry Pi Compute Module 4 I/O Board to power the Compute Module 4 (CM4) inside the enclosure. This would have allowed me to create a self-contained unit. However, I discovered that the CM4 could only be powered via the DC power cord. As a result, I had to supply DC power through the pre-drilled hole in the enclosure, which was not ideal since it would hinder my ability to test the enclosure's waterproof reliability. I invested considerable time researching the power requirements of the electronic components and exploring various powering options. Ultimately, I decided to use DC power from an outlet for the time being.
Additionally, the blog provides information about the Raspberry Pi HAT connector, Expansion Header, GPIO Pinout, and sensors attached to the RaspberryPi HAT HEADER Pins. I was able to attach the Enviro HAT for Raspberry Pi, but I was unable to get the LED display to work. I mentioned 2 other possible Grove sensors (Dust and Water), but did not try to attach and program them using the GPIO Pinouts.
Resources
NEXT
Blog#5 Testing the Environment within the Waterproof Enclosure
The purpose of this blog is to assess the compliance status of IP68-rated enclosures over time by conducting a series of tests.
.

Top Comments