


Recap:
I'm building a smart solar monitoring system that uses three panels with a clean reference to eliminate weather effects and directly measure dust-induced losses in real time. One panel stays pristine as a baseline, and comparing the two under identical sky conditions gives a performance ratio that reveals soiling immediately. The goal is to use environmental sensors and edge AI to predict exactly when cleaning is needed, before efficiency drops enough to impact revenue. This beats fixed-schedule cleaning or waiting for output to degrade.Also this is complementary to my Master's thesis of a minute Shape memory Alloy based solar panel cleaning robot
Previous posts:
- SolarSense - Part 1 - Introduction, The POC Built and The Plan
- SolarSense - Part 2 - Can Arduino CAN?
- SolarSense - Part 3 - PCB Schematics Walkthrough
- SolarSense - Part 4 - CAN Protocol Deep Dive and Implementation
Hello Lab View, Haven't seen you since my Undergrad
The last time I used Lab View was during my Undergraduate academics in Control Lab, I never was a fan of high level graphical style programming plus all of my work never required Lab View, so I was happy until this challenge came up. On the bright side, I am happy to say that there is Community version available. I don't remember seeing the community when I used it. Without any research of what is the difference between Community vs Professional was, I went to the community version. Obviously to activate the Community version, I had to create an account. It was No mess, No Fuss Installation.
In this post, the aim will be to create a dashboard to show values published by the Arduino Q via TCP packets. These will include, the Solar panel outputs, The Environmental parameters such as UV, AQI, Humidity and then the system parameters such as battery, Error flags etc.
Getting A Gauge up and Running
The Python Code
I made a quick code to keep sending values 4 times a second. Apologies for no comments.
import math
import socket
import threading
import time

HOST = "0.0.0.0"
PORT = 9000
UPDATE_INTERVAL = 0.25


def read_value(t: float) -> float:
    return round(50 + 45 * math.sin(t / 3.0), 2)


def handle_client(conn: socket.socket, addr) -> None:
    print(f"[+] client connected: {addr}")
    start = time.monotonic()
    try:
        while True:
            value = read_value(time.monotonic() - start)
            conn.sendall(f"{value}\r\n".encode("ascii"))
            time.sleep(UPDATE_INTERVAL)
    except (ConnectionResetError, BrokenPipeError, OSError):
        pass
    finally:
        conn.close()
        print(f"[-] client disconnected: {addr}")


def main() -> None:
    with socket.socket(socket.AF_INET, socket.SOCK_STREAM) as server:
        server.setsockopt(socket.SOL_SOCKET, socket.SO_REUSEADDR, 1)
        server.bind((HOST, PORT))
        server.listen()
        print(f"Gauge TCP server listening on {HOST}:{PORT}  (Ctrl+C to stop)")
        try:
            while True:
                conn, addr = server.accept()
                threading.Thread(
                    target=handle_client, args=(conn, addr), daemon=True
                ).start()
        except KeyboardInterrupt:
            print("\nShutting down.")


if __name__ == "__main__":
    main()
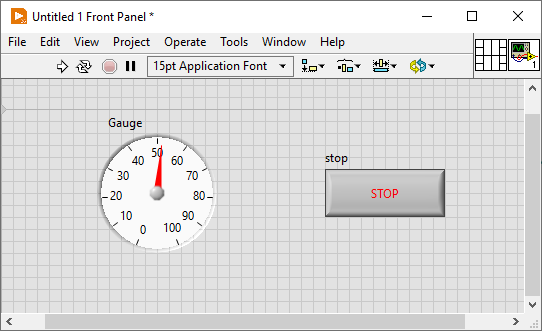
The Front Panel of Lab View
A Plain Gauge with range 0-100 and a Stop button
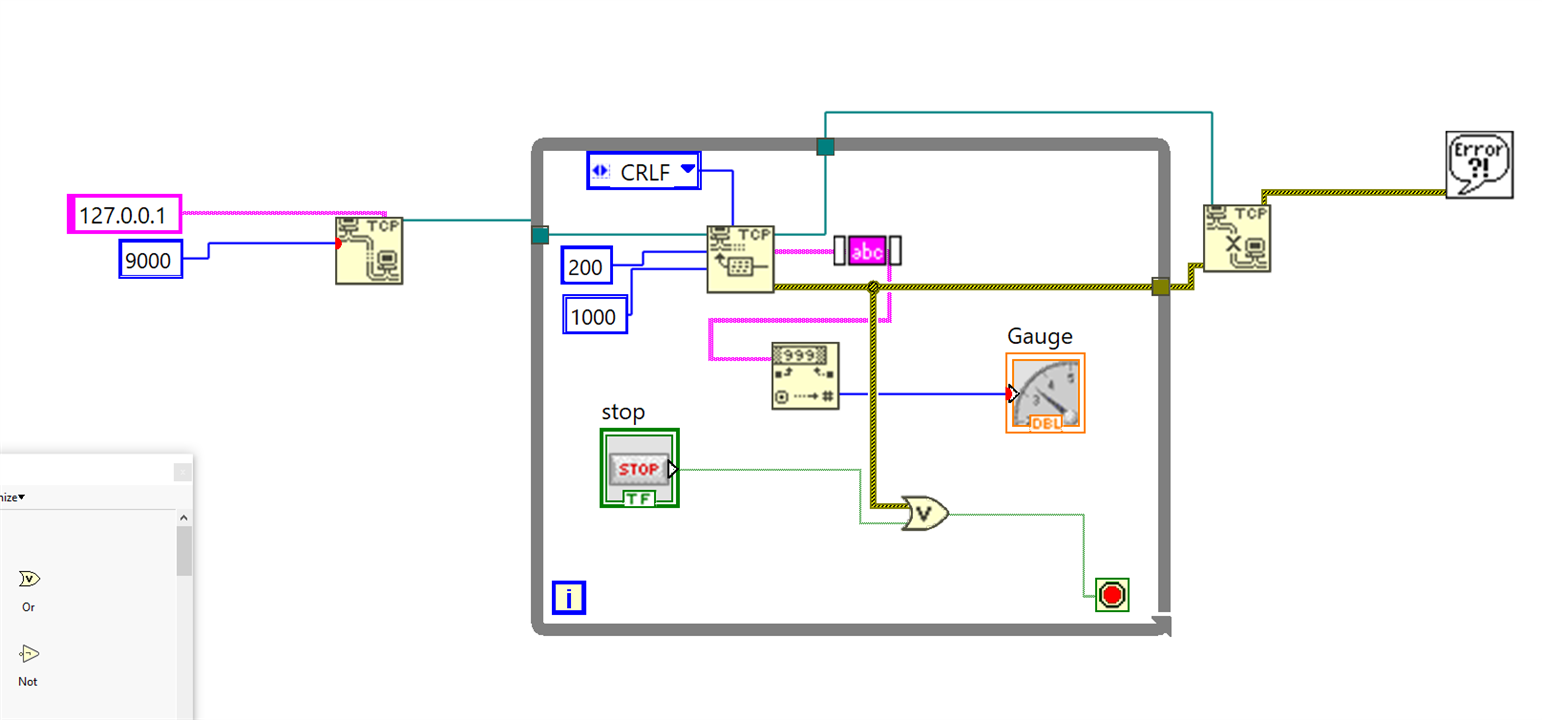
Block Diagram
When Creating a VI, it opens two window, one is the UI Editor and the other is the Block Diagram Editor. The Block diagram is where is the logic is executed. I Referred to the YouTube video https://www.youtube.com/watch?v=LMtdLqmRnVU to make the TCP Communication logic. One thing to note is that for all Inputs and Outputs to work in a loop, it has to be in the loop, else only the value of input at the start of first iteration of the Loop will be used. Any changes or presses to the Buttons will not be considered.
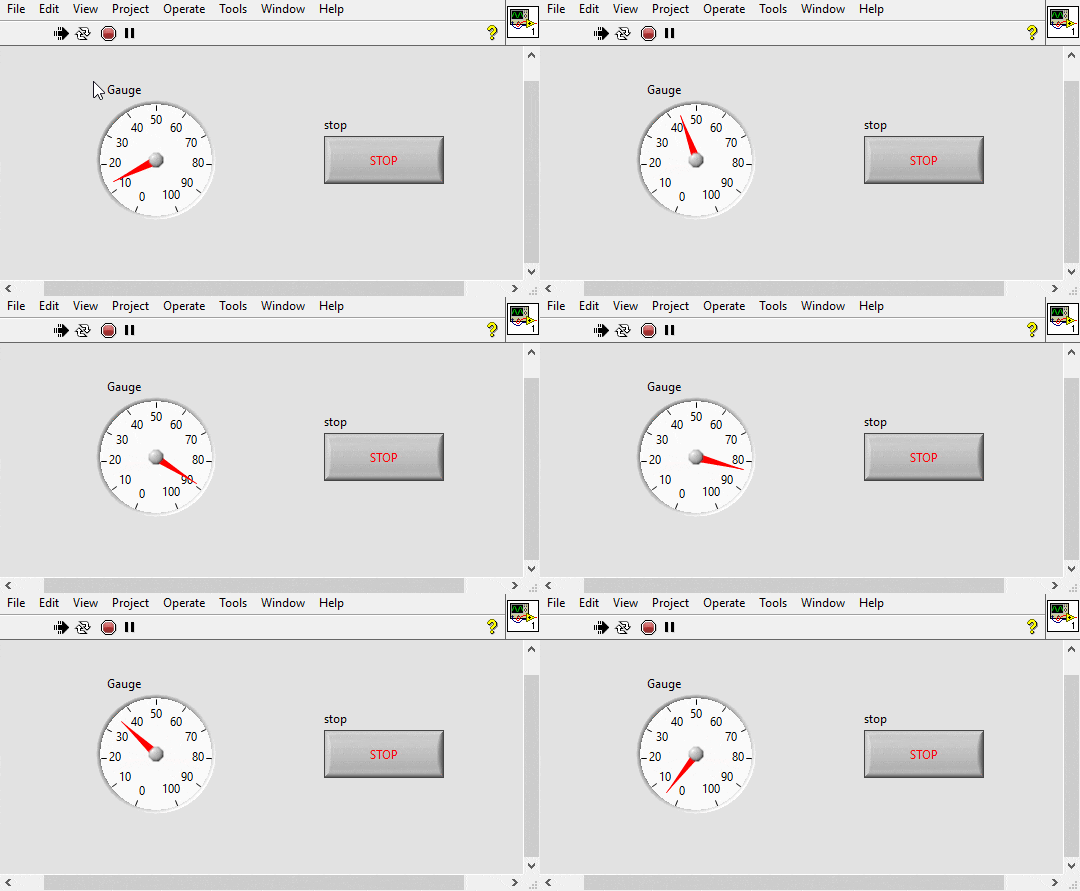
The Result
10mins into Lab View, I have a live dashboard.
Building the Actual Panel
To get a full picture of the situation I need to have the following data
| Variable | Type | Unit | Range |
|---|---|---|---|
| panel_efficiency[0] | DBL | % | 0–100 |
| panel_efficiency[1] | DBL | % | 0–100 |
| panel_efficiency[2] | DBL | % | 0–100 |
| soiling_ratio | DBL | % | 5.0–29.0 |
| battery | DBL | % | 0–100 |
| tank_level | DBL | % | 0–100 |
| humidity | DBL | % | 10–70 |
| temperature | DBL | °C | 13–37 |
| uv | DBL | Index | 2.0–8.0 |
| aqi | INT | µg/m³ | 20–80 |
| status_ok | INT | — | 0 or 1 |
| error | INT | — | 0 or 1 |
These data will be sent as a JSON over TCP. For testing, i will be randomizing the values such that they oscillate between minimum and maximum.
{
  "panel_efficiency": [25.5, 24.8, 22.3],
  "soiling_ratio": 15.2,
  "humidity": 65.0,
  "temperature": 28.5,
  "uv": 6.2,
  "aqi": 55,
  "battery": 78.4,
  "status_ok": 1,
  "error": 0,
  "tank_level": 78.4
}
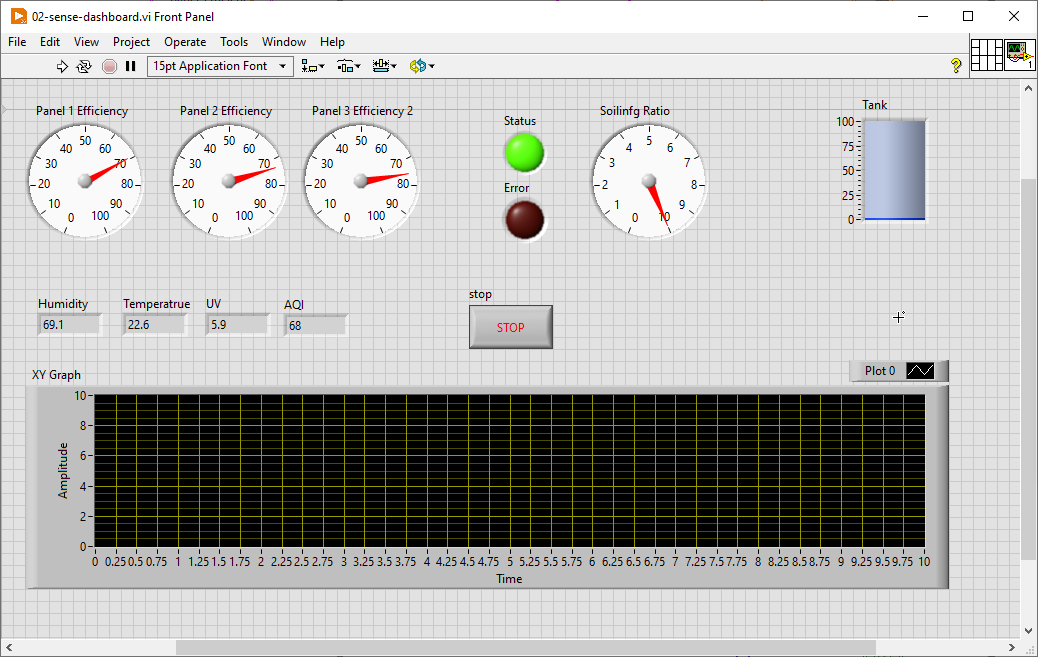
The Front Panel
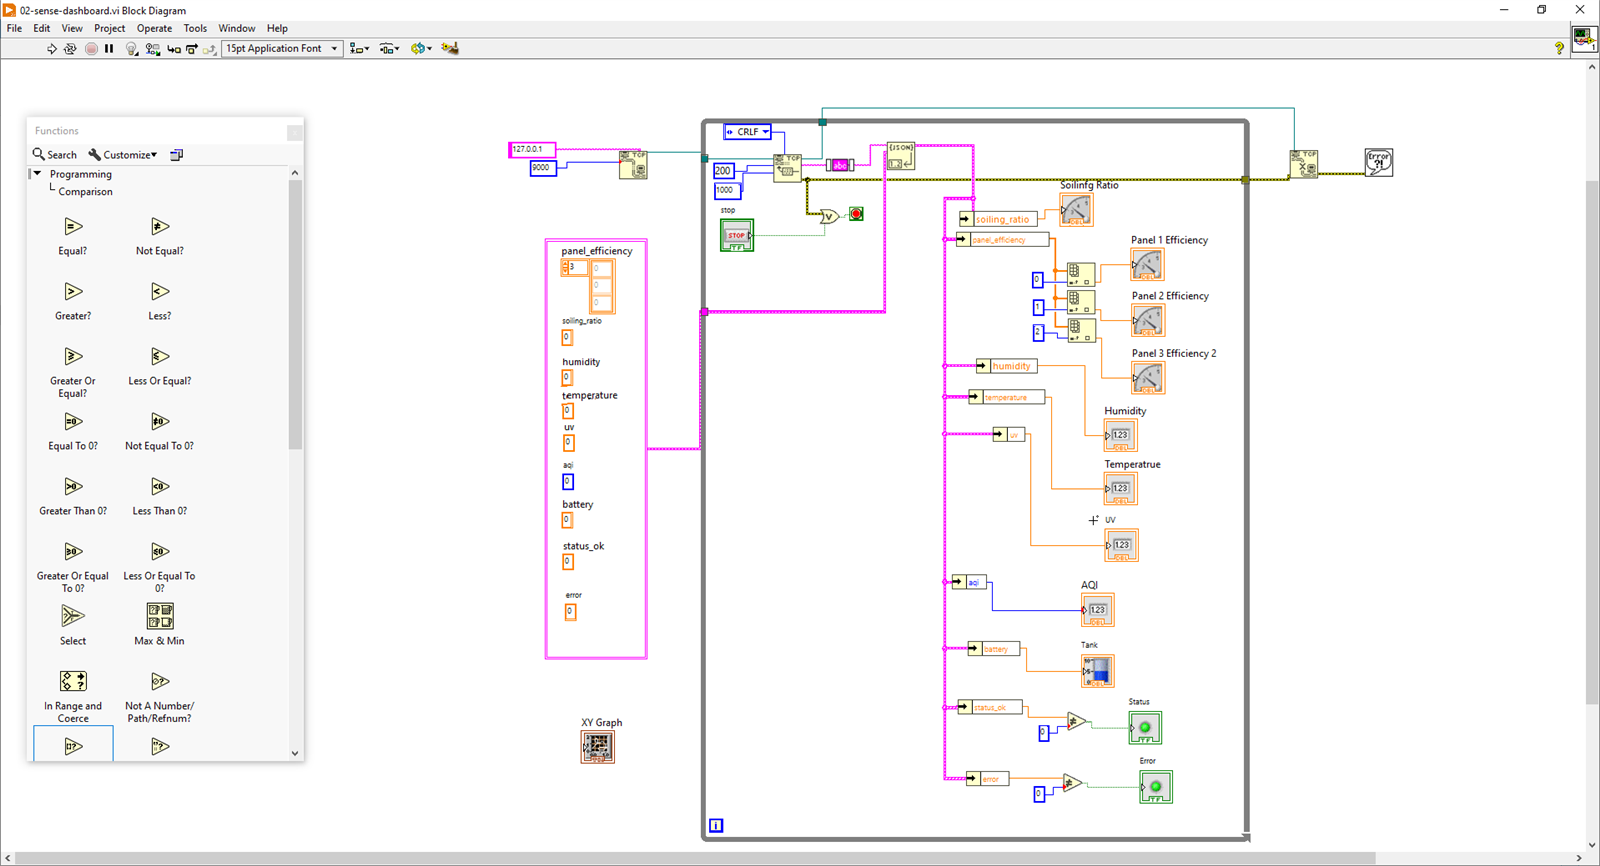
The Block Diagram
www.youtube.com/watch
This is where I started running into trouble. I initially thought the Unflatten from JSON block would simply split the JSON into key–value pairs, but it wasn’t that straightforward. I had to declare the structure of the expected JSON format using a cluster definition—the long vertical box to the left of the while loop. I was able to get this working by referring to a YouTube video https://www.youtube.com/watch?v=kx1E5QnnLy0. However, I ran into another issue when declaring a Boolean. For some reason, I couldn’t find the Boolean type. To save time, I modified the Python code to send the status flags as 0/1 integers instead of Booleans.
I assumed I could use an integer-to-Boolean conversion block while reading the JSON from the server, but I couldn’t find such a block either. As a workaround, I ended up using the “If Not Equal” comparison block instead. I also noticed that the UI started being slow. Not sure why.
The Final Working
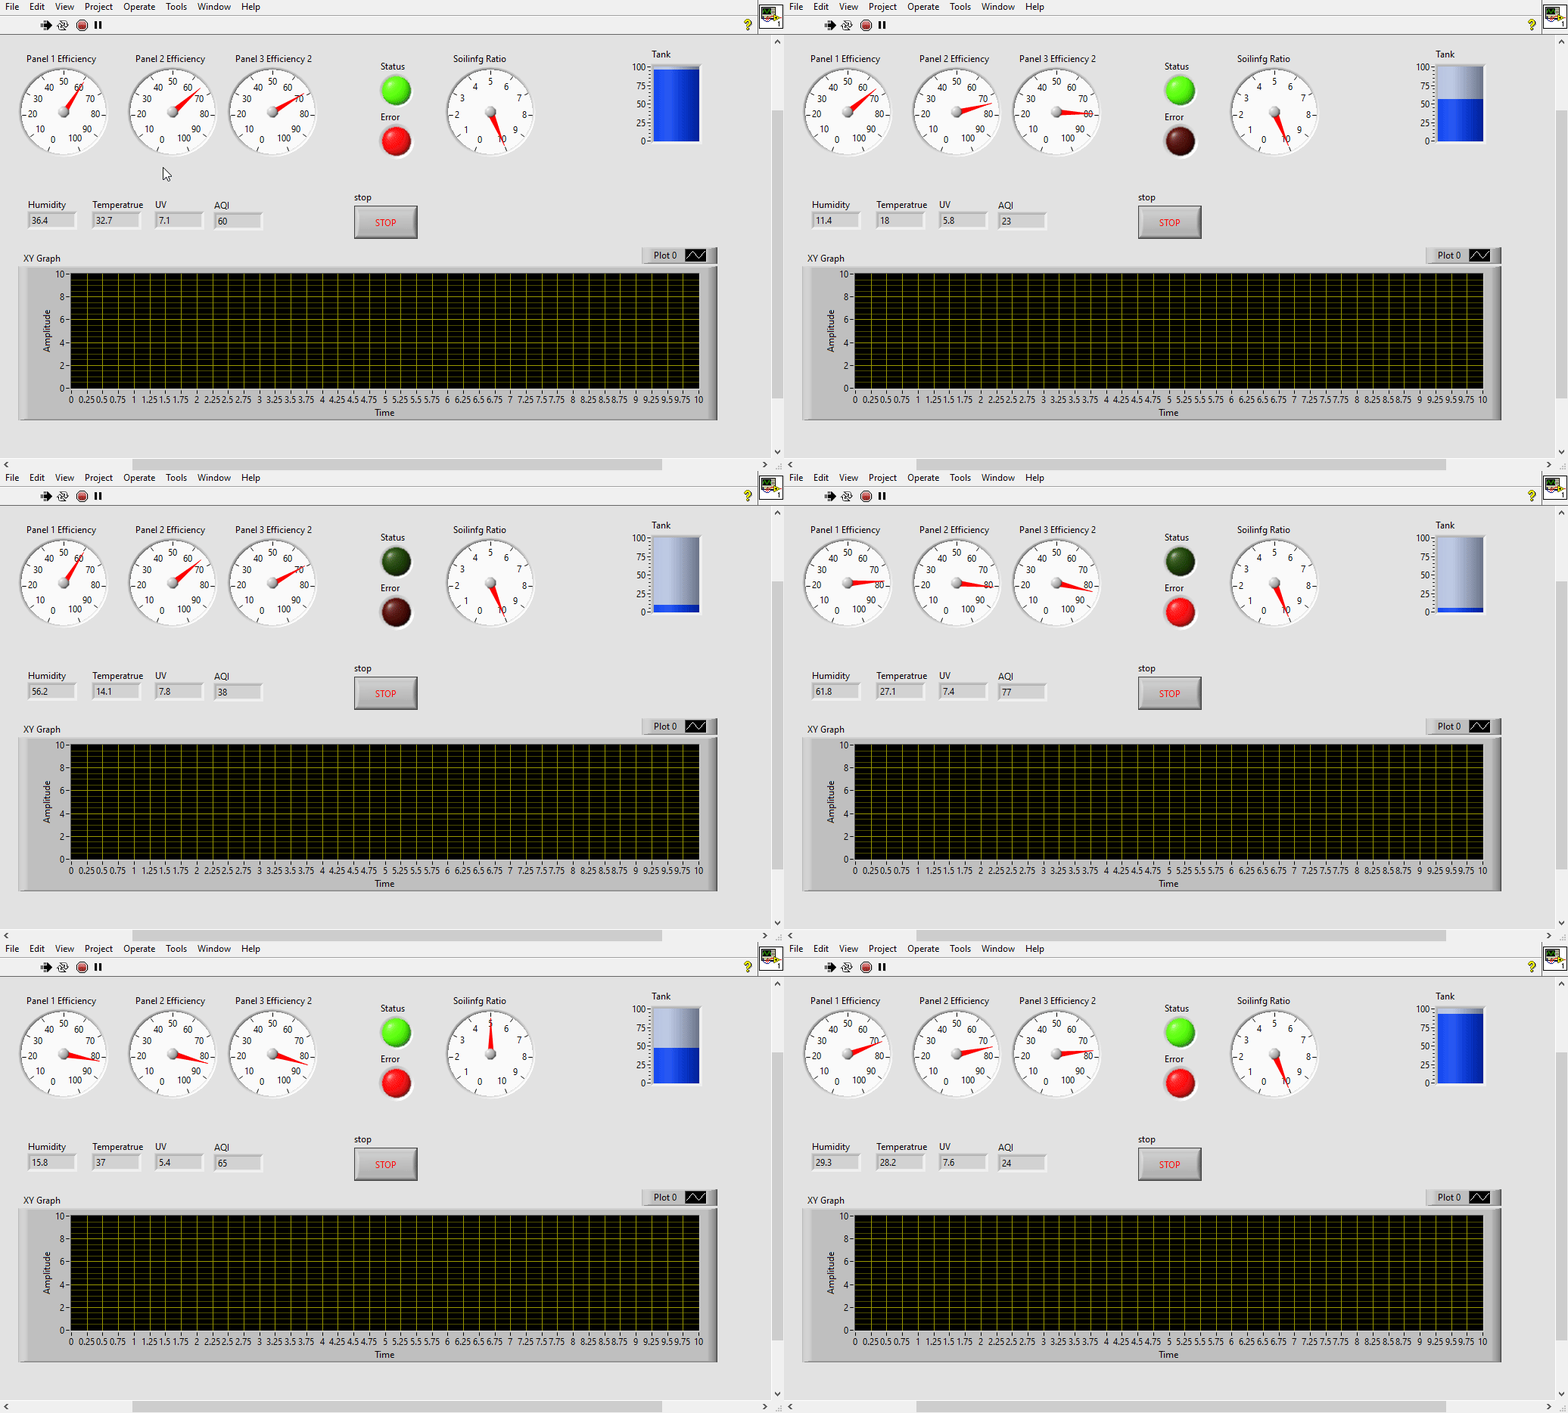
I have not been able to get the XY Graph to work yet, But to me, It's a stretch goal which i added impromptu Hopefully I should get it working by the deadline.
Final Notes.
I had some time reminiscing my college days using Lab View, fighting with my classmates to claim the limited number of floating license of Lab VIew, Coordinating with my friends so that They will claim the license the second I surrender mine back into the common pool, Getting the dashboard to work was probably the easiest part, but I still had fun. The PCB for the data collection has completed fabrication and is on the way, it should be with me in a day or two, I am still using the old POC to keep the data collection alive till then.


