Table of Contents
Part 1: System Concept and Architecture
Part 2 : Sponsored Kit Overview
Part 3 : Alternatives for Heart Rate, SpO₂, and Temperature Sensing
Part 4 : MAX30208EVSYS Evaluation System – Technical Overview & Operation
Part 5 : Reverse-Engineering the MAX30208EVSYS Communication Protocol
Part 6 : Communicating with the MAX30208EVSYS in LabVIEW
Part 7 : Building a Cross-Platform Qt6 Desktop Application for the MAX30208EVSYS Temperature Sensor
Part 8 : STM32 Pulse Oximeter & Heart Rate Monitor (MAXREFDES117 + USB CDC)
Part 9 : MAXREFDES117 – JSON Data Acquisition via USB-CDC in LabVIEW
Part 10 : Building a Real-Time Sensor Data Visualizer for MAXREFDES117 / USB CDC
Part 11 : Research Workstation System Architecture
Part 12 : Combined Pulse Oximeter & Temperature Monitoring System in LabVIEW
Part 13 : Dual-Port Biomedical Telemetry Dashboard - Integrating STM32 (MAXREFDES117) and MAX30208EVSYS in C++ and Qt
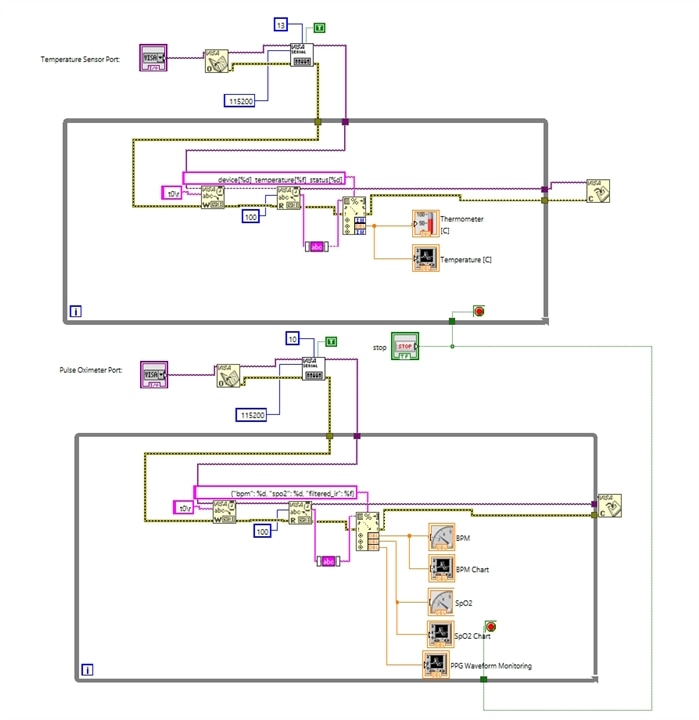
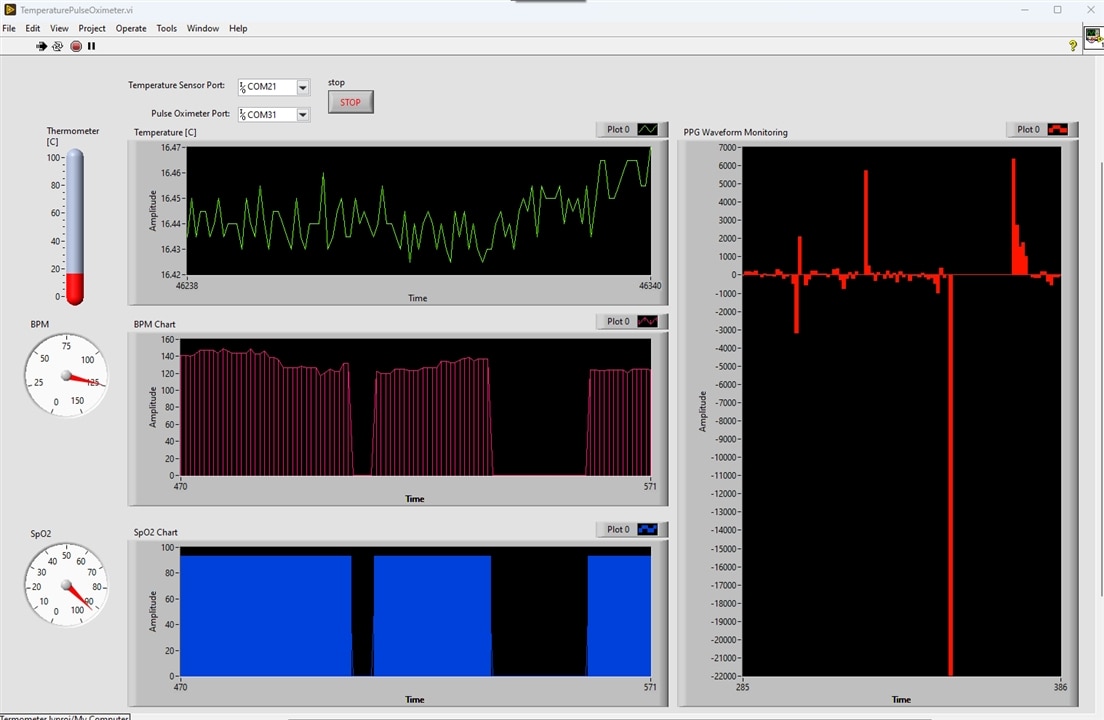
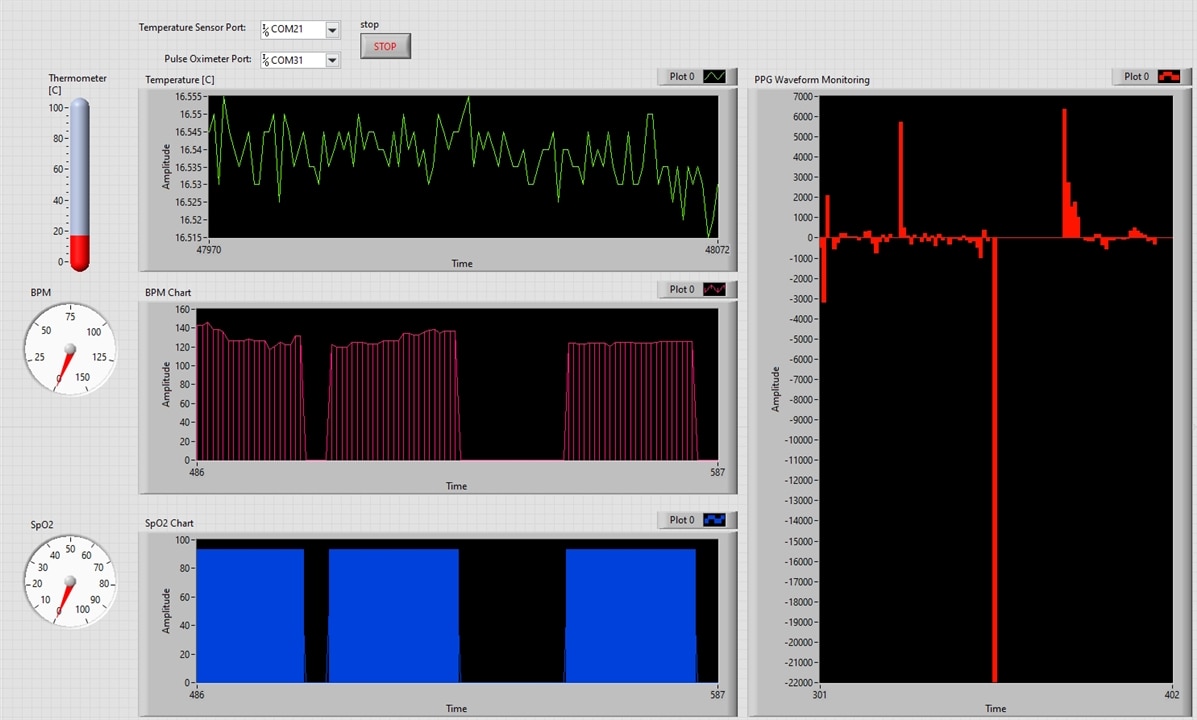
The culmination of this project is a unified LabVIEW application that simultaneously acquires, processes, and visualizes multi-sensor biomedical data. By merging the serial communication streams from both the STM-based pulse oximeter (USB-CDC JSON telemetry) and the MAX30208EVSYS temperature sensor, the system provides a comprehensive patient monitoring dashboard.
1. Multi-Device Architecture & Parallel Acquisition
-
Independent COM Ports: The application manages dual serial connections using NI-VISA sessions running concurrently or sequentially within a structured architecture (such as a Producer-Consumer pattern or parallel
While Loops). -
Stream Synchronization: Combines the temperature sensor's polling command (
t0\r) with the continuous JSON data stream ({"bpm": ..., "spo2": ..., "filtered_ir": ...}) sent by the STM microcontroller.
2. Data Parsing & Robustness
-
Unified String Cleaning: Both input streams utilize Trim Whitespace to strip hidden carriage return and line feed characters (
\r\n), preventing parsing faults. -
Error Prevention: Firmware optimizations ensure that idle or error states (such as missing sensor contact) output standardized numeric frames instead of text strings, eliminating Error 85 (Scan Failed) occurrences.
3. Combined Front Panel & Analytics Dashboard
-
Dual Visualization:
-
Displays real-time photoplethysmogram (PPG) waveforms (
filtered_ir) alongside continuous body temperature trends on synchronized Waveform Charts. -
Features dedicated vital signs indicators, including digital gauges for Heart Rate (BPM), SpO2 percentage scaled from 0 to 100, and precise temperature readouts.
-
-
Statistical Processing: Utilizes internal Formula Nodes and shift registers to calculate real-time statistical averages, minimums, and maximums for thermal data.
4. Front Panel
5. Block Diagram