element14 Community
element14 Community
    Register Log In
  • Site
  • Search
  • Log In Register
  • Members
    Members
    • Benefits of Membership
    • Achievement Levels
    • Members Area
    • Personal Blogs
    • Feedback and Support
    • What's New on element14
  • Learn
    Learn
    • Learning Center
    • eBooks
    • STEM Academy
    • Webinars, Training and Events
    • Learning Groups
  • Technologies
    Technologies
    • 3D Printing
    • FPGA
    • Industrial Automation
    • Internet of Things
    • Power & Energy
    • Sensors
    • Technology Groups
  • Challenges & Projects
    Challenges & Projects
    • Design Challenges
    • element14 presents
    • Project14
    • Arduino Projects
    • Raspberry Pi Projects
    • Project Groups
  • Products
    Products
    • Arduino
    • Dev Tools
    • Manufacturers
    • Raspberry Pi
    • RoadTests & Reviews
    • Avnet Boards Community
    • Product Groups
  • Store
    Store
    • Visit Your Store
    • Choose Another Store
      • Europe
      •  Austria (German)
      •  Belgium (Dutch, French)
      •  Bulgaria (Bulgarian)
      •  Czech Republic (Czech)
      •  Denmark (Danish)
      •  Estonia (Estonian)
      •  Finland (Finnish)
      •  France (French)
      •  Germany (German)
      •  Hungary (Hungarian)
      •  Ireland
      •  Israel
      •  Italy (Italian)
      •  Latvia (Latvian)
      •  
      •  Lithuania (Lithuanian)
      •  Netherlands (Dutch)
      •  Norway (Norwegian)
      •  Poland (Polish)
      •  Portugal (Portuguese)
      •  Romania (Romanian)
      •  Russia (Russian)
      •  Slovakia (Slovak)
      •  Slovenia (Slovenian)
      •  Spain (Spanish)
      •  Sweden (Swedish)
      •  Switzerland(German, French)
      •  Turkey (Turkish)
      •  United Kingdom
      • Asia Pacific
      •  Australia
      •  China
      •  Hong Kong
      •  India
      •  Korea (Korean)
      •  Malaysia
      •  New Zealand
      •  Philippines
      •  Singapore
      •  Taiwan
      •  Thailand (Thai)
      • Americas
      •  Brazil (Portuguese)
      •  Canada
      •  Mexico (Spanish)
      •  United States
      Can't find the country/region you're looking for? Visit our export site or find a local distributor.
  • Translate
  • Profile
Power & Energy
  • Technologies
  • More
Power & Energy
Blog Solar Energy Harvesting with Epishine Flexible Solar Cell - Pt 3: Charge and Discharge
  • Blog
  • Forum
  • Documents
  • Polls
  • Events
  • Mentions
  • Sub-Groups
  • Tags
  • More
  • Cancel
  • New
Blog Post Actions
  • Subscribe by email
  • More
  • Cancel
  • Share
  • Subscribe by email
  • More
  • Cancel
Group Actions
  • Group RSS
  • More
  • Cancel
Engagement
  • Author Author: Jan Cumps
  • Date Created: 2 Aug 2020 12:38 PM Date Created
  • Views 318 views
  • Likes 6 likes
  • Comments 1 comment
  • epishine
  • energy_harvesting
Related
Recommended

Solar Energy Harvesting with Epishine Flexible Solar Cell - Pt 3: Charge and Discharge

Jan Cumps
Jan Cumps
2 Aug 2020

I received a preview of a light harvesting kit from Epishine and element14. Check my intro here.

In this post, an analysis of the electronic properties. Charging, discharging, powering a load.


image

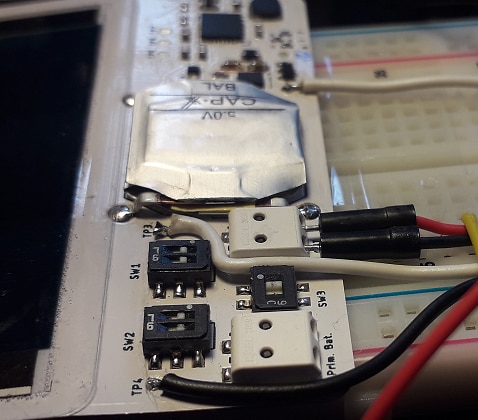
image source: my board, with probe wires soldered to the test points


The Test Conditions


I've set the output to 1.8 V. That's one of the voltages specified in Epishine's draft spec.

Light conditions: my lab during daytime, on a bright summer noon. No direct sunlight or artificial light.

When a load was attached, it was a 590 Ohm resistor. Drawing 3 mA.

No battery.

VCAP recorded with a Kithley DMM6500.

A DMM checking VOUT. This is not recorded, I just used it to see when voltage switched off or on.

A raw CSV file with all measures is attached. I've also added a spreadsheet in ODS format with the graph used in this post.


I deliberately used a non-lab setting. My setup is a reasonable ambient light situation.

For a lab-based analysis, see the graph from the designers below:


image

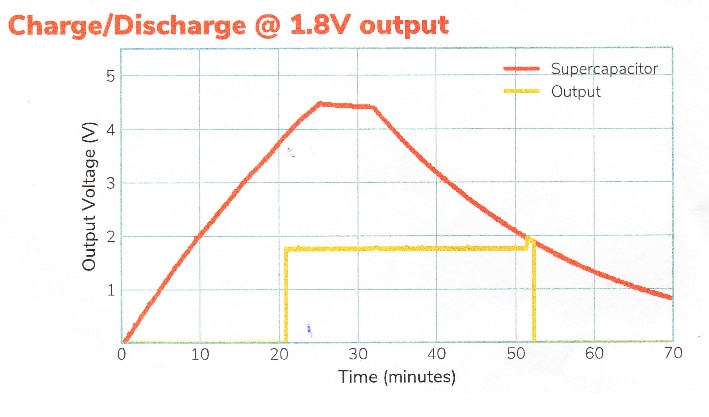
image source: scan of Epishine's draft spec


As you'll see later, my test results are in line with the lab-based results. Maybe, in a later test, I'll redo their test from an empty cap until VCAP reaches 3.9 V.

If it is of interest to anyone, because these are long and non-exciting test exercises.


Test Results


The test in this blog took 2 hours and 15 minutes. It's automated, I did not have to check and write down measurements.

I only did one intervention: adding a 590 Ohm load after the super cap reached a steady charge.

The total amount of samples: 37770 measurements of VCAP, with timestamp.

these scenarios are captured:

  • charge without load
  • 3 discharges with load
  • 2 charges with load, under slightly different lighting conditions.


image

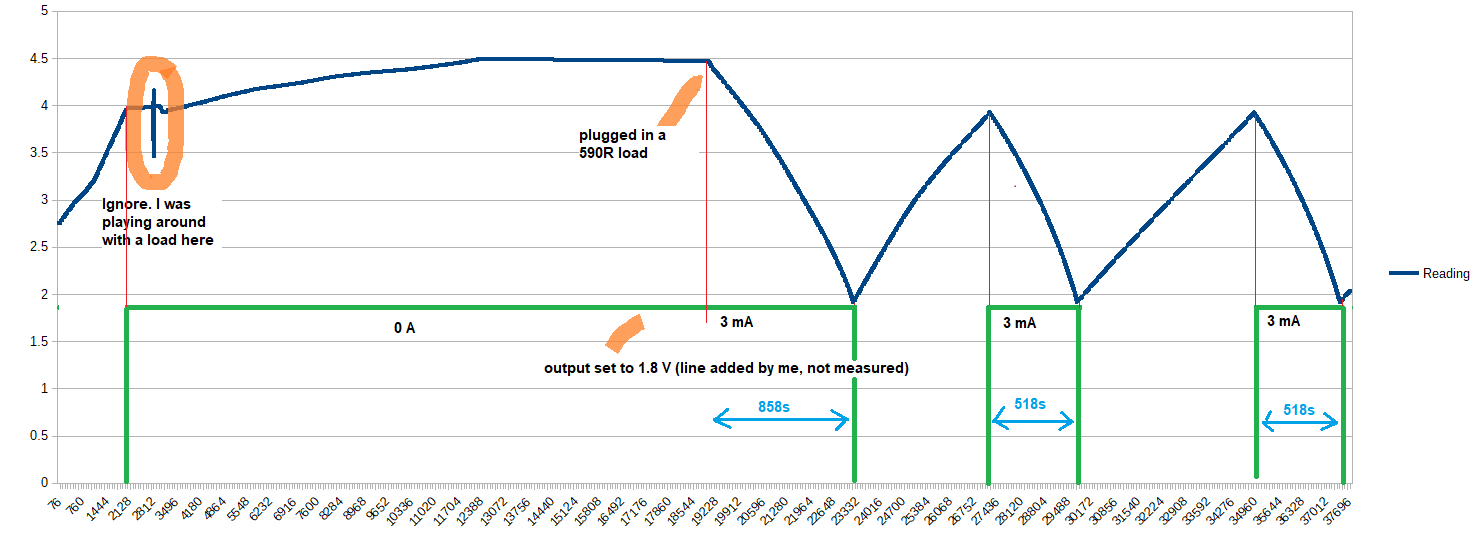
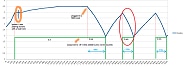
image source: my samples, in blue. All the other artifacts are manually annotated. They aren't measurements but are representative for what happened.


The first ramp up in the dark blue line is when I have no load attached.

The solar cell charges the capactor up to 4.5 V. That's the maximum in this design.

You see a knee at 3.9 V, where the ramp flattens more than the typical exponential capacitor charge curve. That's when the output gets enabled.

Even though there's no load, the LDO and boost converters at the output steal some power.


Conform to the specifications, the 1.8 V output switches on when the supercap reaches the 3.9 V.

Because the output is not loaded, the solar cell can continue to charge the capacitor.


At the point where the capacitor reaches the 4.5 V maximum, I inserted a 590 Ohm resistor. This draws 3 mA from the output.

You can immediately see that charge is taken from the supercap.

The design will keep on providing 1.8 V at 3 mA until VCAP reaches that 1.8 V.

It was able to do that - with the supercap first allowed to get its maximum charge - for 858 seconds, 14 minutes


Here is the zoom in of the first discharge ramp, where VCAP starts from 4.5 V, Vout = 1.8 V, Iout = 3 mA

image

image

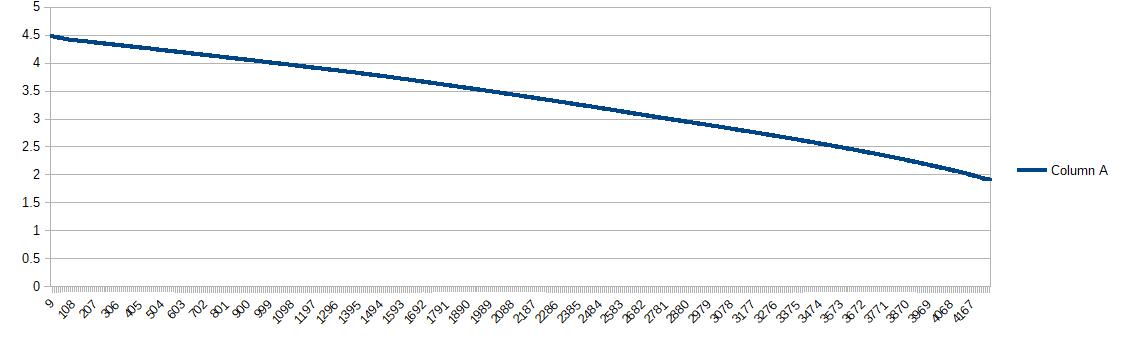
data range in sample spreadsheet: $supercap1.$A$19001:$A$23245

Start time: 3839.588863681 s

End time: 4697.276276045 s

duration: 857.687412364 s

This is 1.287 mWh.


Then the next discharge phase is one where we the load is attached and the design immediately start to take power when VCAP reached it's minimum: 3.9 V

image

image

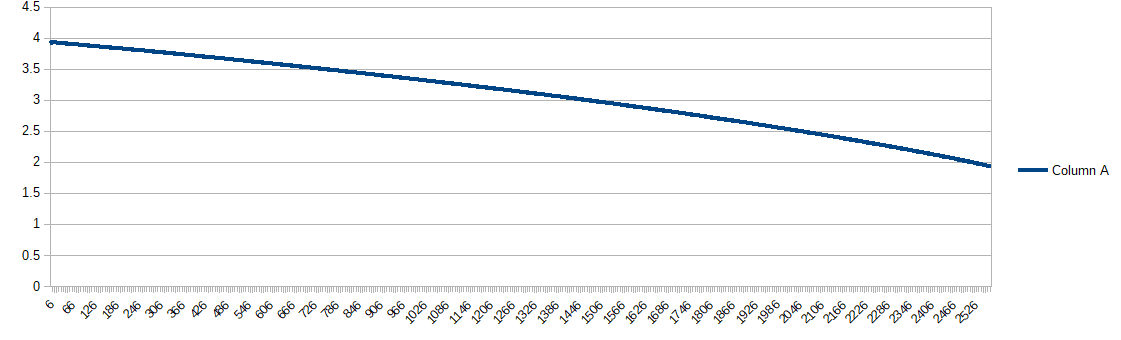
data range in sample spreadsheet: $supercap1.$A$27185:$A$29750

Start time: 5493.527778257 s

End time: 6011.899451787 s

duration: 518.371673529999

That's 0.777 mWh.


Related blog
Pt 1: intro
Pt 2: Circuit Analysis
Pt 3: Charge and Discharge
Pt 4: Battery Backup
Pt 5: test points
Attachments:
epishine_20200802.zip
  • Sign in to reply
  • DAB
    DAB over 2 years ago

    You are clearly not going to harvest a lot of energy with these devices, though if you used them as wall paper?


    DAB

    • Cancel
    • Vote Up 0 Vote Down
    • Sign in to reply
    • More
    • Cancel
element14 Community

element14 is the first online community specifically for engineers. Connect with your peers and get expert answers to your questions.

  • Members
  • Learn
  • Technologies
  • Challenges & Projects
  • Products
  • Store
  • About Us
  • Feedback & Support
  • FAQs
  • Terms of Use
  • Privacy Policy
  • Legal and Copyright Notices
  • Sitemap
  • Cookies

An Avnet Company © 2023 Premier Farnell Limited. All Rights Reserved.

Premier Farnell Ltd, registered in England and Wales (no 00876412), registered office: Farnell House, Forge Lane, Leeds LS12 2NE.

ICP 备案号 10220084.

Follow element14

  • Facebook
  • Twitter
  • linkedin
  • YouTube