element14 Community
element14 Community
    Register Log In
  • Site
  • Search
  • Log In Register
  • About Us
  • Community Hub
    Community Hub
    • What's New on element14
    • Feedback and Support
    • Benefits of Membership
    • Personal Blogs
    • Members Area
    • Achievement Levels
  • Learn
    Learn
    • Ask an Expert
    • eBooks
    • element14 presents
    • Learning Center
    • Tech Spotlight
    • STEM Academy
    • Webinars, Training and Events
    • Learning Groups
  • Technologies
    Technologies
    • 3D Printing
    • FPGA
    • Industrial Automation
    • Internet of Things
    • Power & Energy
    • Sensors
    • Technology Groups
  • Challenges & Projects
    Challenges & Projects
    • Design Challenges
    • element14 presents Projects
    • Project14
    • Arduino Projects
    • Raspberry Pi Projects
    • Project Groups
  • Products
    Products
    • Arduino
    • Avnet Boards Community
    • Dev Tools
    • Manufacturers
    • Multicomp Pro
    • Product Groups
    • Raspberry Pi
    • RoadTests & Reviews
  • Store
    Store
    • Visit Your Store
    • Choose another store...
      • Europe
      •  Austria (German)
      •  Belgium (Dutch, French)
      •  Bulgaria (Bulgarian)
      •  Czech Republic (Czech)
      •  Denmark (Danish)
      •  Estonia (Estonian)
      •  Finland (Finnish)
      •  France (French)
      •  Germany (German)
      •  Hungary (Hungarian)
      •  Ireland
      •  Israel
      •  Italy (Italian)
      •  Latvia (Latvian)
      •  
      •  Lithuania (Lithuanian)
      •  Netherlands (Dutch)
      •  Norway (Norwegian)
      •  Poland (Polish)
      •  Portugal (Portuguese)
      •  Romania (Romanian)
      •  Russia (Russian)
      •  Slovakia (Slovak)
      •  Slovenia (Slovenian)
      •  Spain (Spanish)
      •  Sweden (Swedish)
      •  Switzerland(German, French)
      •  Turkey (Turkish)
      •  United Kingdom
      • Asia Pacific
      •  Australia
      •  China
      •  Hong Kong
      •  India
      •  Korea (Korean)
      •  Malaysia
      •  New Zealand
      •  Philippines
      •  Singapore
      •  Taiwan
      •  Thailand (Thai)
      • Americas
      •  Brazil (Portuguese)
      •  Canada
      •  Mexico (Spanish)
      •  United States
      Can't find the country/region you're looking for? Visit our export site or find a local distributor.
  • Translate
  • Profile
  • Settings
Test & Tools
  • Technologies
  • More
Test & Tools
Documents Programmable Electronic Load - Analyse the Summing Node Zero Point
  • Blog
  • Forum
  • Documents
  • Files
  • Members
  • Mentions
  • Sub-Groups
  • Tags
  • More
  • Cancel
  • New
Join Test & Tools to participate - click to join for free!
Actions
  • Share
  • More
  • Cancel
Engagement
  • Author Author: Jan Cumps
  • Date Created: 1 Dec 2017 4:08 PM Date Created
  • Last Updated Last Updated: 15 May 2020 3:38 PM
  • Views 8767 views
  • Likes 8 likes
  • Comments 107 comments
Related
Recommended

Programmable Electronic Load - Analyse the Summing Node Zero Point

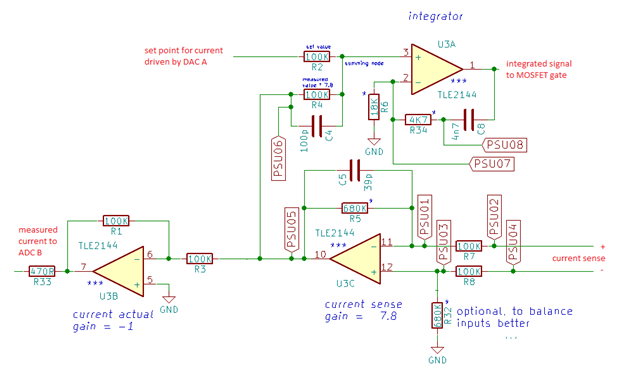
This blog documents investigates the feedback node of the electronic load that Robert Peter Oakes, jc2048 and Jan Cumps are designing.

It's an important spot in the load's design. It measures the set point and the feedback from the output.

When the output is driven to 0, it should be on a potential as close as possible to 0 V.

On the first prototype it's -0.2 V. Not so much off, but the negative value  influences our ADC measurements.

This document checks how we can get this node to 0 V.

image


Because this document is evolving, some comments below may be out of sync with the content. That's because the content is adapted based on the conversation.

The measurements taken here are based on the original design, without R32 in place and U3B + tied to ground.

The current sense side of R7 is connected to ground, and a variable negative voltage from 0 V down is applied to the current sense side of R8 to simulate current being sensed.


The circuit isn't complex. The set point is driven by a DAC. It's set to 0 for this test.

The second input to this node is OpAmp 3C. It has both inputs tied to ground so should theoretically have 0 V at the output.

On my board I measure a potential of -0.212V at the left side of R33.

I hope to get this closer to 0 V to ease the ADC a bit - its performance degrades with negative voltage at its inputs.

Like the other blogs for the electronic load, this is a working document that will be updated with findings from anyone who wants to chime in.


Behaviour at 0V


buzy image

  • metrology
  • differentiator
  • boosterpack
  • opamp
  • msp432
  • launchpad
  • analog
  • laboratory
  • instrument
  • Share
  • History
  • More
  • Cancel
  • Sign in to reply

Top Comments

  • jc2048
    jc2048 over 7 years ago in reply to Robert Peter Oakes +4
    As you say, changing the op-amp is one possibility. There are bipolar op-amps with much lower bias currents, but an alternative nowadays is a precision CMOS op-amp (you'd have to check whether other characteristics…
  • Robert Peter Oakes
    Robert Peter Oakes over 7 years ago +3
    To hopefully simplify things a little We have this, Upper op amp is simply to provide an inversion of the measured value back tot he ADC, hence the gain of -1 Lower right op amp measures the volts across…
  • jc2048
    jc2048 over 7 years ago in reply to Jan Cumps +3
    Love the advertisement for "John's excellent probes". It's like one those things from the old days of American TV where the presenter would suddenly turn, look very earnestly at the camera, and start reading…
Parents
  • Jan Cumps
    Jan Cumps over 6 years ago

    Latest measurements, with a 5V DC input:


    The DAC outputs 0.980 mV offset. From value 0 to 100, it does not move an inch.

    This is measured with the DAC not loaded, the output pin is floating (Behaviour in-circuit is the same).


    The DAC is fairly linear from 100 on. Abruptly it forms a sharp knee when the linear ramp rises above the offset (DAC measurements on the right part of the image below).

    To confuse you image the first point in the graph is the current when the DAC is set to 110, last when set to 100.

    For the voltage on the right, it's the other way around. This is the list with DAC set from 100 to 110.

    This is to keep you alert.

    image


    The load pulls 0.519 mA (you don't see that precision in the graph on the left, but I consulted the data behind it) when the DAC output is 0.980 MV

    From then on it rises fairly linear.


    When I short the DAC output, the current drops to 0.0016 µA, virtually the same as when I disable the load (0.0010 µA).

    It may turn out that the offset of the offset of the DAC is the cause for that low range knee after all....

    • Cancel
    • Vote Up +1 Vote Down
    • Sign in to reply
    • More
    • Cancel
  • jc2048
    jc2048 over 6 years ago in reply to Jan Cumps

    That's an impressive meter, being able to graph like that.


    I realised a week or two ago that my old Fluke 8808A (only 5-and-a-half digits) has a RS232 connector on the back. When I looked in the manual, the 'Installation Test' involved typing '*IDN?', so it's SCPI. One project in the coming months will be to find a convenient way to get it connected to a PC. Rather than try and find a USB-to-RS232 converter, I wondered about building a box with reed relays controlled by a small SBC and doing some kind of input multiplexor, as well as the SBC talking via RS232 to the meter.


    Is it possible to set your meter to run the test many times and then draw error bars at each vertex so that you can see visually the variation?

    • Cancel
    • Vote Up 0 Vote Down
    • Sign in to reply
    • More
    • Cancel
Comment
  • jc2048
    jc2048 over 6 years ago in reply to Jan Cumps

    That's an impressive meter, being able to graph like that.


    I realised a week or two ago that my old Fluke 8808A (only 5-and-a-half digits) has a RS232 connector on the back. When I looked in the manual, the 'Installation Test' involved typing '*IDN?', so it's SCPI. One project in the coming months will be to find a convenient way to get it connected to a PC. Rather than try and find a USB-to-RS232 converter, I wondered about building a box with reed relays controlled by a small SBC and doing some kind of input multiplexor, as well as the SBC talking via RS232 to the meter.


    Is it possible to set your meter to run the test many times and then draw error bars at each vertex so that you can see visually the variation?

    • Cancel
    • Vote Up 0 Vote Down
    • Sign in to reply
    • More
    • Cancel
Children
  • Jan Cumps
    Jan Cumps over 6 years ago in reply to jc2048

    jc2048  wrote:


    ...


    Is it possible to set your meter to run the test many times and then draw error bars at each vertex so that you can see visually the variation?

    I haven't tried that and don't think so with the standard functionality. A graph is always moving in time, so no multiple repeats on the same graph.

    It has binning and histogram functionality - very likely it would be able to at least show a bell curve.

    I'm quite confident that I could do what you are explaining with labview and spreadsheets. I have a flow that can run a set of looping conditions for as long as the heart desires, and dump to a CSV file.


    Once Keithley releases the APPS api, I may try to see if I can fully take over the screen and perform graphs and variation displays as you suggest here.

    As long as the total amount of measurements fits in what a buffer can hold, I don't see why this would not be possible (except for my brain failing).

    • Cancel
    • Vote Up +1 Vote Down
    • Sign in to reply
    • More
    • Cancel
  • Jan Cumps
    Jan Cumps over 6 years ago in reply to jc2048

    jc2048  wrote:


    That's an impressive meter, being able to graph like that.


    I realised a week or two ago that my old Fluke 8808A (only 5-and-a-half digits) has a RS232 connector on the back. When I looked in the manual, the 'Installation Test' involved typing '*IDN?', so it's SCPI. One project in the coming months will be to find a convenient way to get it connected to a PC. Rather than try and find a USB-to-RS232 converter, I wondered about building a box with reed relays controlled by a small SBC and doing some kind of input multiplexor, as well as the SBC talking via RS232 to the meter.


    Is it possible to set your meter to run the test many times and then draw error bars at each vertex so that you can see visually the variation?

    If you enroll in the Analog Discovery 2 + LabView Home Bundle, and you are selected image - you could use its LabVIEW serial driver.

    If you'd would consider putting an RS323-over-USB connector in (you can make one of a MSP432 LP and 'convert to 3.3V' circuitry without programming - if you only need the TX and RX) , you can make the meter-PC connection look like a COM port.

    If your PC has a serial port, that 'd be even better. Rumour says that most motherboards in PCs still have a serial port connector hidden somewhere.

    • Cancel
    • Vote Up 0 Vote Down
    • Sign in to reply
    • More
    • Cancel
element14 Community

element14 is the first online community specifically for engineers. Connect with your peers and get expert answers to your questions.

  • Members
  • Learn
  • Technologies
  • Challenges & Projects
  • Products
  • Store
  • About Us
  • Feedback & Support
  • FAQs
  • Terms of Use
  • Privacy Policy
  • Legal and Copyright Notices
  • Sitemap
  • Cookies

An Avnet Company © 2025 Premier Farnell Limited. All Rights Reserved.

Premier Farnell Ltd, registered in England and Wales (no 00876412), registered office: Farnell House, Forge Lane, Leeds LS12 2NE.

ICP 备案号 10220084.

Follow element14

  • X
  • Facebook
  • linkedin
  • YouTube