Table of Contents
Introduction
Many different use cases involve exposure to environmental conditions much worse than usually found in home/office settings - be it moisture, dust or temperature variations. One example is agriculture - when storage of some food types require low temperatures and high humidity levels. Having witnessed one such storage (cold, damp underground chamber) I have started to think how to protect electronics I wanted to install there. It seems that unprotected home-use equipment would have limited lifespan - for example, LED light bulb started blinking after several months from installation (despite very sporadic usage). Photo below presents another example - seemingly well-sealed solar-powered mole repellent where condensation inside of the enclosure is clearly visible and corrosion seems unavoidable

To better understand problems related to maintaining hardware in high-humidity conditions I have entered this design challenge with the idea of creating test bench consisting of dedicated sensors put into enclosures with different protection levels, then expose them to the hostile environmental conditions and gather information about changes of parameters inside. At the end, gathered data would be analyzed and some conclusions drawn.
Humidity and its influence on electronic circuits
Everybody probably had encountered environmental requirements of some electronic appliances like these:
Relative humidity: 5% to 80% RH noncondensing
What it means and is it important for outdoor installations?
RH stands for "relative humidity" and indicates what percent of maximum level of water vapor the air currently contains. This parameter is dependent on temperature and pressure - the higher the temperature, the more water vapor can be contained. When relative humidity reaches 100%, condensation usually occurs (this temperature is called dew point) and liquid water appears - so every temperature drop has a potential of causing condensation when enough moisture is present.
And having liquid water near electronic circuit can lead to many problems - corrosion specialists mention not only intermittent failures caused by leakage currents resulting from water film formation, but also galvanic corrosion when current flows through liquid electrolyte between conductors of different potential (especially when this electrolyte includes chemicals like dissolved soldering flux remains).
Another value that can be used to measure humidity is absolute humidity that is defined as a mass of water vapor per volume of air. There are (more or less precise - usually with empirical constants that are being updated from time to time by new generations of researchers) equations that can be used to calculate relative humidity, dew point and absolute humidity.
But why we should worry about humidity outside when we put our circuit in the enclosure that is supposed to protect it?
Humidity can enter the enclosure by many ways - from the most obvious like holes or openings (when both liquid water or water vapor can enter), through failing gaskets, humidity trapped inside in construction materials or even the air, to the water vapor migration through the walls of the enclosure.
The last process is not often considered but it seems that water vapor can migrate through most of the materials (but with varying pace) - and migration rate is specified by parameters like Moisture Vapor Transmission Rate (MVTR).
The challenge
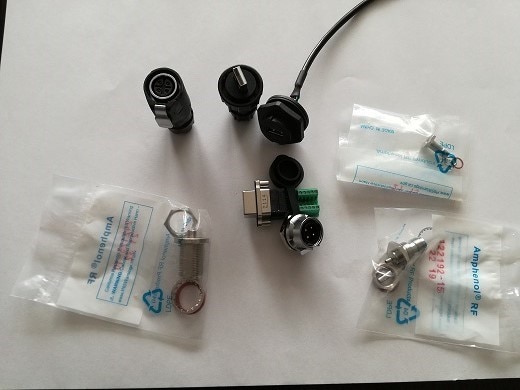
Experimenting with Waterproof Connectors Design Challenge allows participants to experiment with Amphenol (Amphenol RF and Amphenol CS) waterproof connectors housed in Hammond Manufacturing watertight enclosure. Element14 provides all the participants with a rich set of components, including:
| 1554VA2GYCL Watertight Plastic Enclosure |
| DFR0418 LattePanda V1 Single Board Computer |
| MRU-AF41-2020 USB Type A Sealed Connector |
| MRU-AM21-4000 USB Type A Sealed Connector |
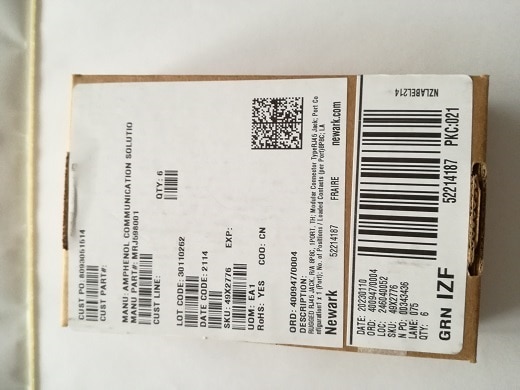
| MRJ598001 Rugged RJ45 Jack |
| MRDBN04M17000 Circular Connector |
| MRD-BG04-L13-000 Circular Connector, IP67, MRD Series, Panel Mount Receptacle |
| 242125-10. RF Adapter |
| AD-SMAJMCXJ-1 RF / Coaxial Adapter |
| 122192-15 RF / Coaxial Connector |
| 095-902-545-250 RF / Coaxial Cable Assembly |
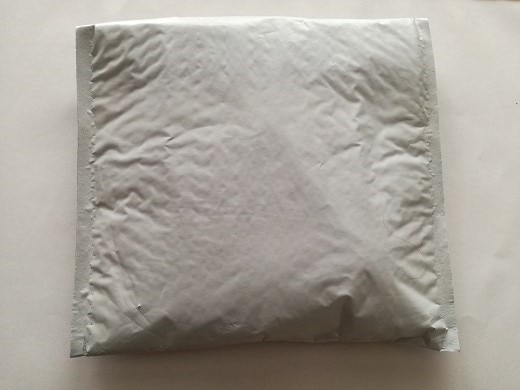
They are sent free of charge, well packaged to prevent accidental damage during transport - photo gallery below
| {gallery}Challenger kit |
|---|
|
Shipping package |
|
Connector set - packaged |
|
Connector set - unpacked |
|
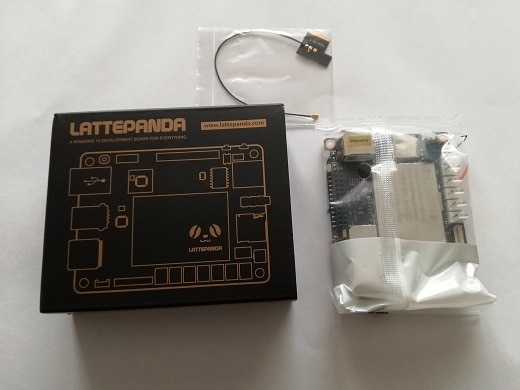
Antenna pigtail |
|
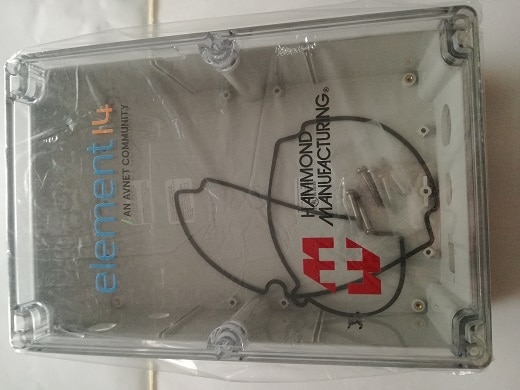
Enclosure - packaged |
|
Enclosure |
|
LattePanda SBC |
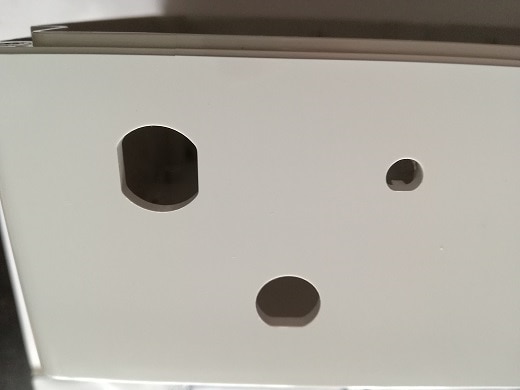
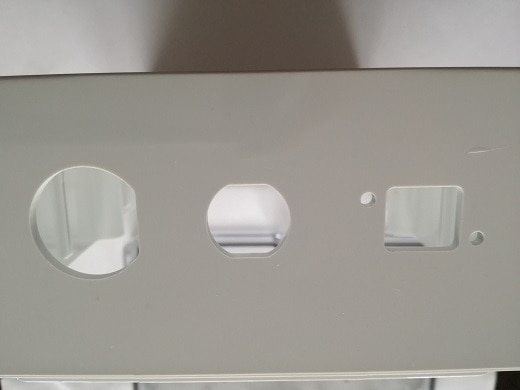
Hammond enclosure is factory customized for connector installation (with hole shapes difficult to replicate in typical DIY workshop) and by displaying manufacturer's and Element14 logos.
| {gallery}Enclosure modification |
|---|
|
Enclosure prepared for connector installation |
|
Enclosure prepared for connector installation |
Experiment setup
Overview
Experimenting with Waterproof Connectors design challenge provided us with component kits containing:
- Hammond 1554VA2GYCL enclosure (UV stabilized polycarbonate - IP68 rated, designed for outdoor use)
- USB type A receptacle and plug (IP67/68 rated)
- RJ45 socket (IP67 rated)
- cable receptacle and plug with four contacts (IP67 rated)
- several antenna connectors and adapters
- LattePanda V1 single board computer
My goal is to check if installing rich set of provided connectors negatively influences enclosure parameters - in theory every additional connector is a possible weak point where humidity can enter into the enclosure.
Test setup was thought as comparison of three enclosures: one provided to the participants, one with obvious construction flaw and one completely sealed, without any openings.
Enclosures
The project involves three test enclosures:
- one completely sealed, rated at IP65 ("good" reference),
- one rated at IP65 but without cover seal installed ("bad" reference),
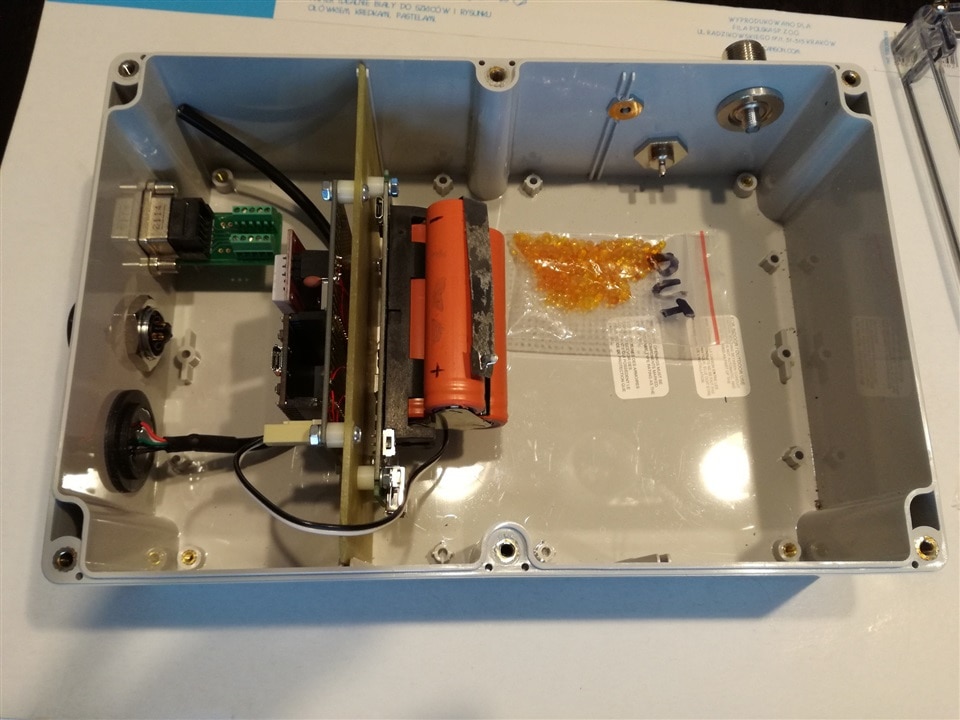
- one provided with my challenger's set - IP68 rated, with Amphenol connectors installed (device under test),
As can be seen, although reference enclosures are not specified to be submerged, they should protect at least from "water jets from any angle".
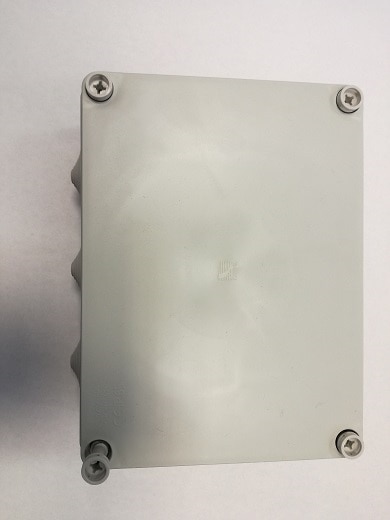
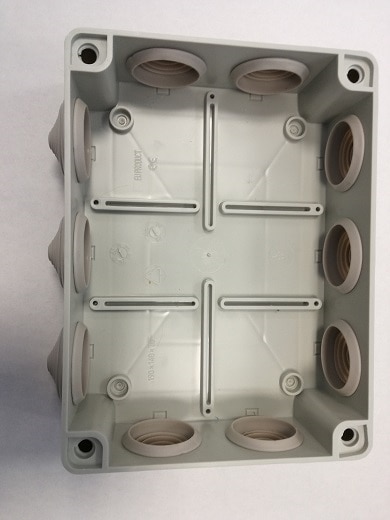
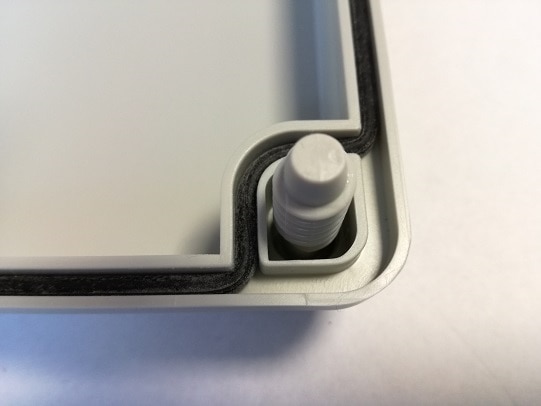
But first some information about former "good" reference - originally IP65 rated installation box that was planned as a reference. Unfortunately, after initial measurements it turned out that it's formidable rubber caps covering cable entry points are somewhat loose and in one position (about 1mm recessed) they are susceptible to leaking, so this enclosure had to be replaced with different model. There is a gallery of this installation below - at first look all seems good: openings are covered by rubber covers, there is a gasket between cover and lower case, but covers can be moved +/-1mm and in one position they are leaking...
| {gallery}Former "good" reference |
|---|
|
Outside view |
|
Inside view |
|
Gasket detail |
|
Cable opening protector |
Two final reference enclosures are both Kradex Z74 "hermetic enclosures" - made from Polypropylene and ABS and with proof of testing against IP65.
https://www.kradex.com.pl/products/905/Z74.pdf
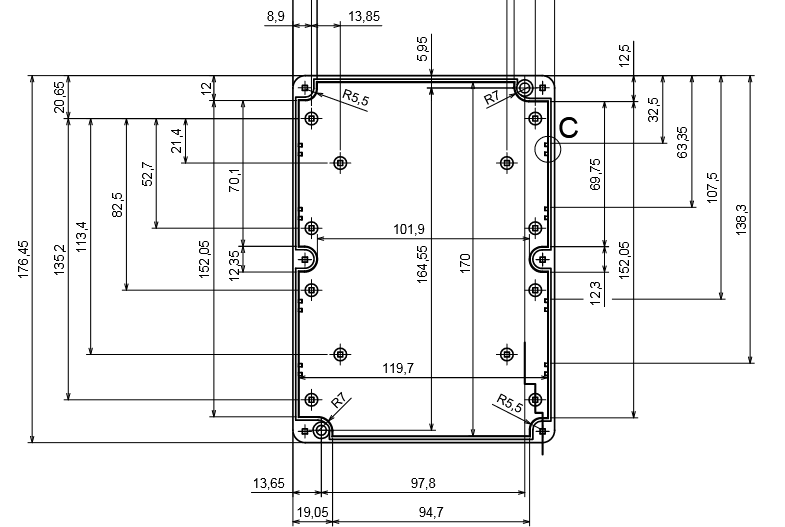
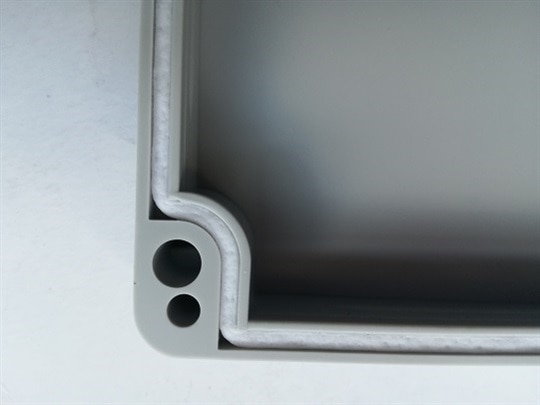
As can be seen - they are similar (but smaller) to Hammond 1554VA enclosure provided in the challenger's kit. Below there are photos of some construction details - they are similar to our test enclosure (one difference is seal material - here it is some sort of soft silicon foam, Hammond provides us with much harder silicon gasket).
| {gallery}Z74 details |
|---|
|
Gasket |
|
Soft silicon foam gasket |
|
description missing |
And our star - Hammond 1554VA enclosure (a.k.a. DUT). Rated at IP68, with 6 self-captivating screws, threaded metal bushings, silicone gasket, made from UV resistant polycarbonate and designed for outdoor use. So - the best parameters in the family: models made from ABS are IP66 rated and enclosures of this size but with only 4 screws are only NEMA 4/4X (as discussed on the forum).
Table below summarizes dimensions of the enclosures
| Enslocure | Length [mm] | Width [mm] | Height [mm] | Surface area [m2] | Volume [m3] |
| Z74 | 176 | 126 | 50 | 0.074552 | 0.0011088 |
|
Hammond 1554VA2GYCL |
236 | 156 | 91.5 | 0.145368 | 0.003368664 |
From this information we can clearly see that our test enclosure has surface area about two times bigger than a reference and volume about three times bigger - that fact will be important in experiment results evaluation.
Connectors.
Amphenol RF and Amphenol CS provided us with extensive set of connectors to use in our projects.
As the connectors are from different families, we need to summarize their parameters to correctly plan our tests. Below there is information about six of them I have decided to install.
Amphenol RF states: "Amphenol RF always identifies the IP rating in the unmated condition unless otherwise stated", I haven't found such a default declaration for Amphenol CS products, so I have gathered this information from datasheets of the products.
| Connector | Datasheet | IP rating | Notes |
| N-Type Jack to SMA Jack Adapter 50 Ohm Straight Bulkhead IP68 | https://www.amphenolrf.com/242125-10.html | IP68 | in unmated condition |
| SMA Jack to MCX Jack Adapter 50 Ohm Straight IP67 | https://www.amphenolrf.com/ad-smajmcxj-1.html | IP67 | in unmated condition |
| TNC Straight Crimp Jack RG-174 RG-188 RG-316 Times LMR-100A Bulkhead Rear Mount 50 Ohm IP67 | https://www.amphenolrf.com/122192-15.html | IP67 | in unmated condition |
| MRJR series RJ45 connector | https://www.amphenol-cs.com/media/wysiwyg/files/documentation/datasheet/inputoutput/io_harsh_mrjr.pdf | ENVIRONMENTAL PERFORMANCE PER IEC 60529 CODE IP67 FOR SEAL BETWEEN MATING AREA AND PCB SIDE OF CONNECTOR. GASKET PROVIDES SEAL TO INSIDE FACE OF PANEL. | |
| MRD series circular connector | https://www.amphenol-cs.com/product-series/rugged-mrd-circular-locking.html | IP67 | in mated condition (but has rubber cover builtin) |
| MRU series USB connector | https://www.amphenol-cs.com/product-series/rugged-mru-usb-2-0.html | IP67 | no information about mated condition requirement (as it was clearly stated for MRD connector) |
Based on this information, our Hammond enclosure with all the above connectors installed should be at least IP67 (with MRD connector covered by builtin cover). So - let's see...
Immersion test
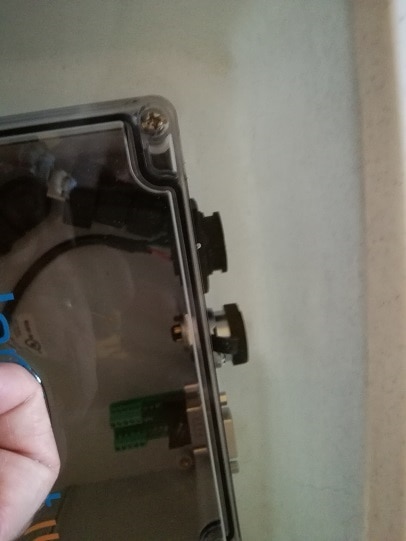
Connector installation was not as straightforward as I hoped, but the main obstacle was PCB guide in the place of one of installation holes (previously reported by two of the other challengers) that had to be partially removed to make flat surface below connector gasket
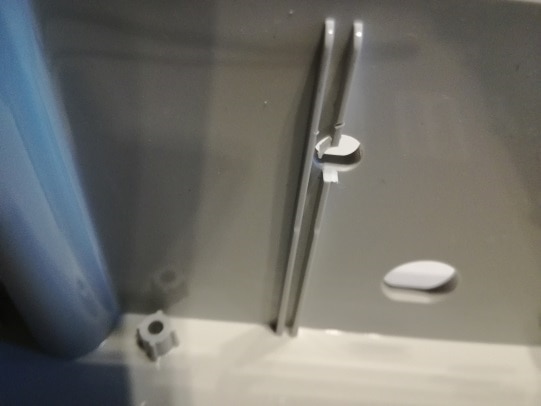
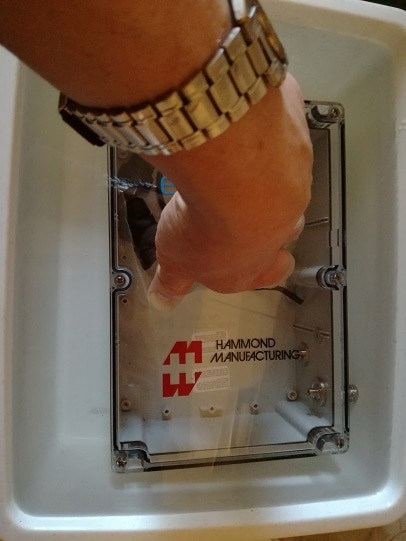
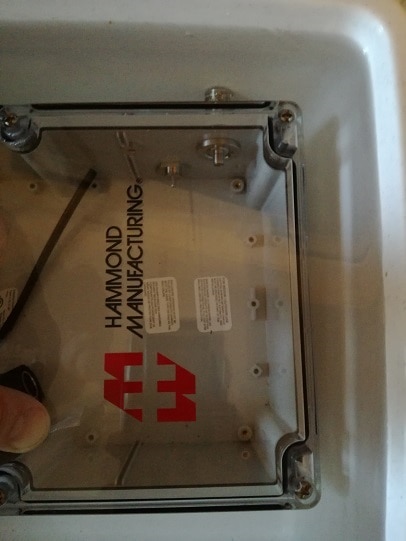
But after installation immersion test was successful - no bubbles, no water leakage visible. Photos below show enclosure after about 1-2 minutes of immersion (inside of the enclosure was dry after the test):
| {gallery}Submersion test |
|---|
|
Submersion test |
|
Submersion test |
|
Submersion test |
Now we have proven that short submersion is possible without any additional connector covers and that by installing connectors we have not compromised waterproof parameters of the enclosure.
Silica gel
To reduce the influence of humidity already present in the enclosure to the test results, I have bought some humidity absorbing silica gel. I have decided to use version that is changing color when used-up. As a side note - color change seems to be reversible when the gel dries up.
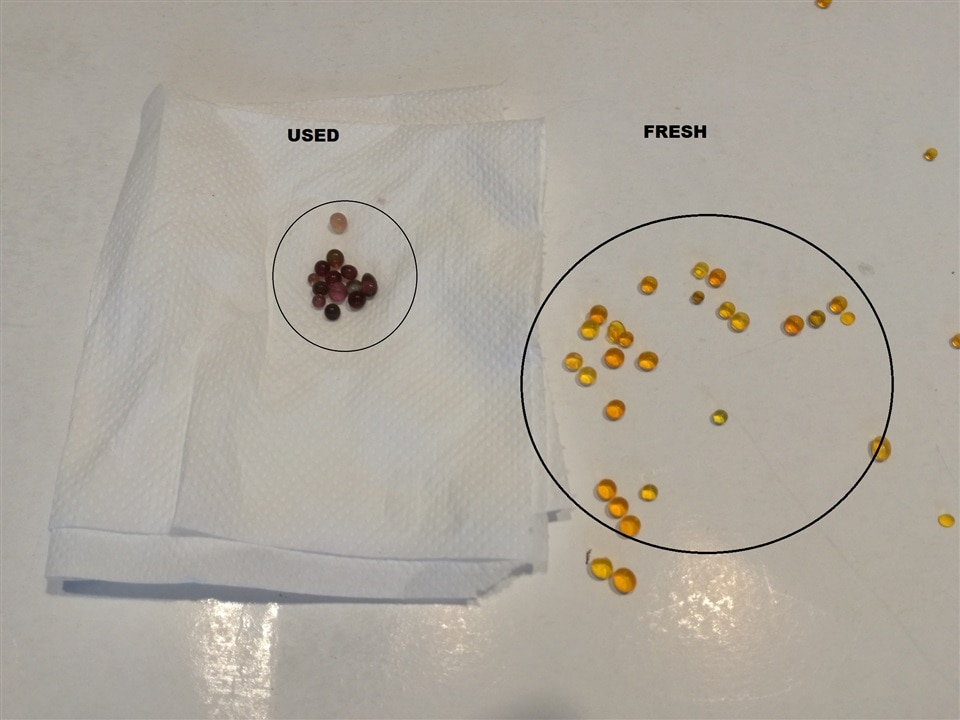
But what use will be of color-changing silica gel when it will be put in a opaque package? So, improvised transparent package was made:
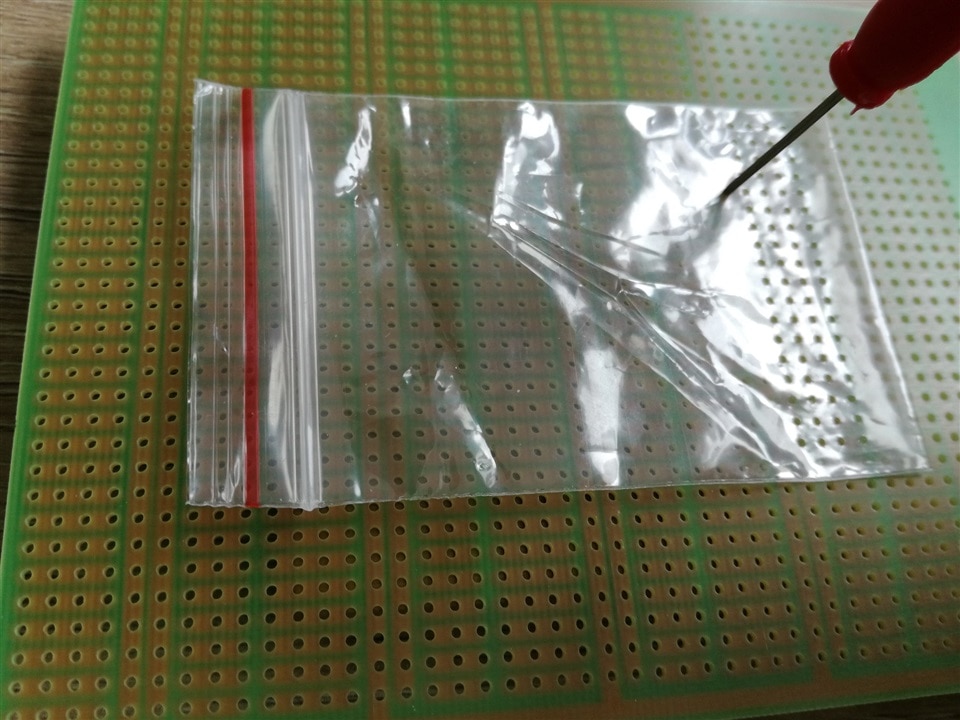
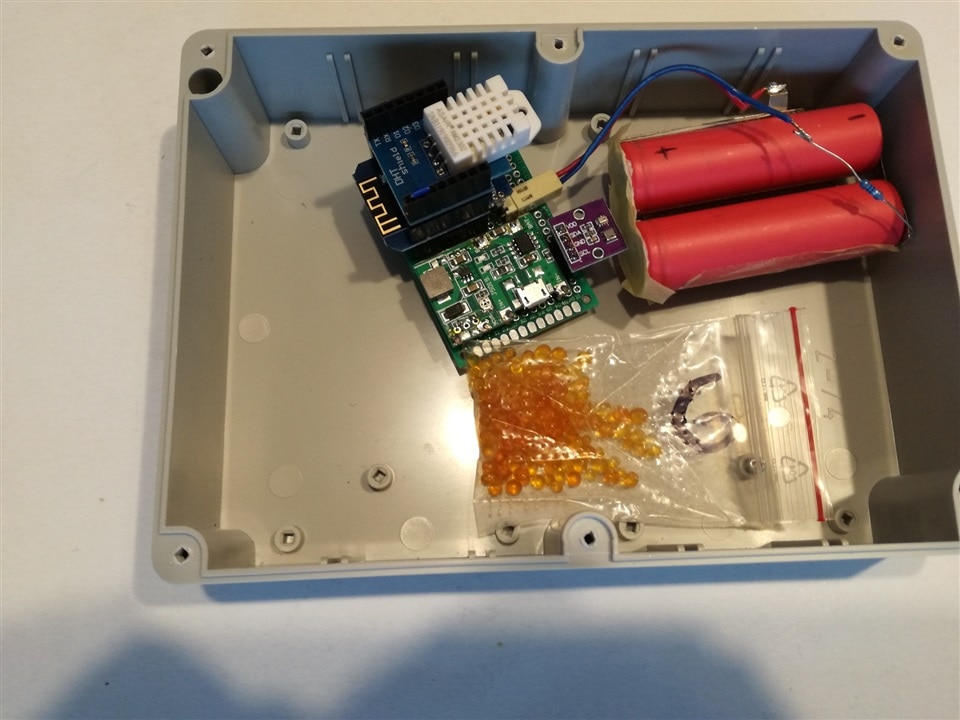
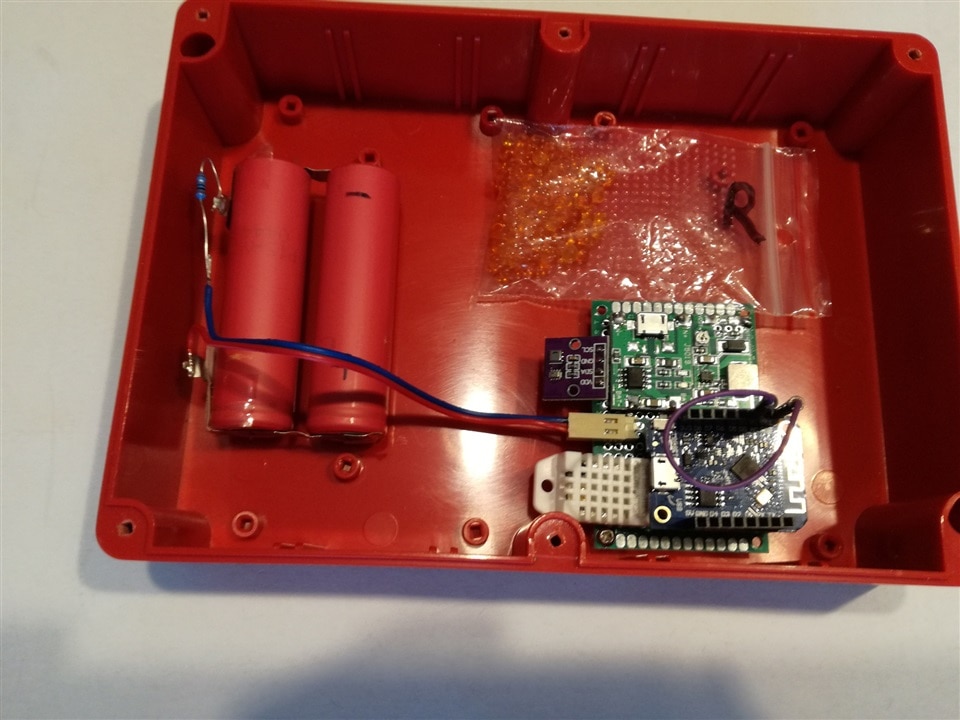
Then absorbers for all three enclosures were created (with about the same amount of the gel - which puts our test enclosure in disadvantage by the way, because of it's three times bigger volume).
At the end three enclosures were prepared
| {gallery}Enclosures |
|---|
|
D.U.T |
|
"Good" reference |
|
"Bad" reference |
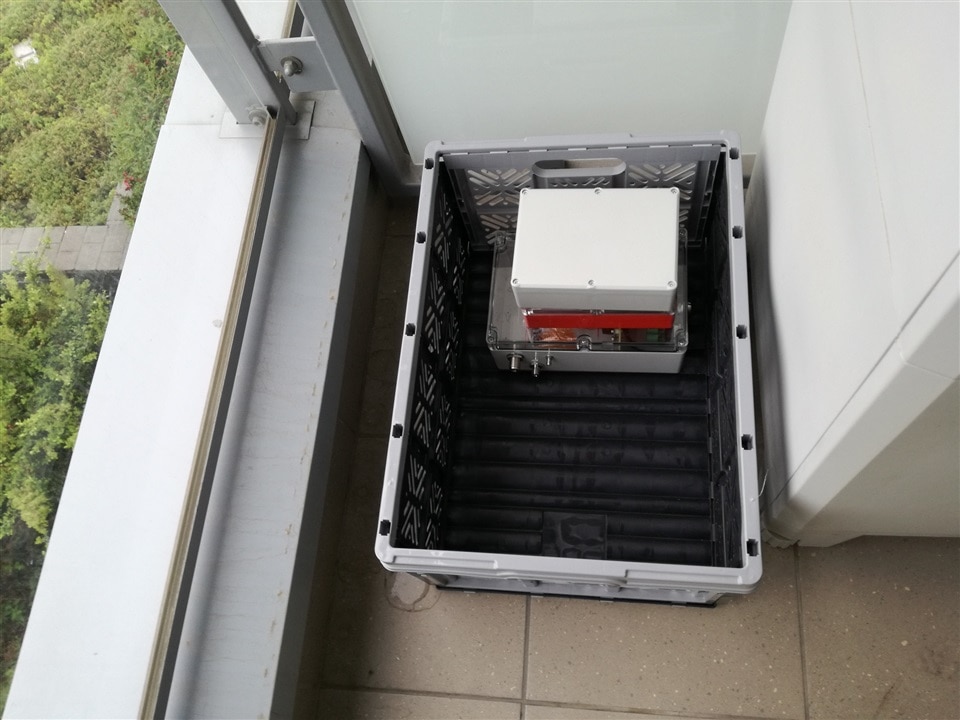
And put to the test (on the balcony, protected from direct rain and sunlight shining into the sensors - AM2302 datasheet states that direct sunlight can affect measurement results).
Sensor construction
Sensor design is based on the following requirements:
- communicate using WiFi (to utilize existing communications infrastructure),
- battery powered (for additional flexibility - I don't want to be forced to make additional holes in my enclosures),
- low cost (so they can be easily replaced if destroyed during experiment),
- optional ADC input (for battery voltage monitoring),
I have decided to build them using ESP8266 SoC modules - they are inexpensive, have Wi-Fi built-in - but there is a problem with battery operation.
As described in ESP8266 datasheet (tables 3-4 and 5-2), power consumption depends on usage and can be quite high.
| Power mode | Description | Power consumption |
| Active (RF working) | WiFi TX packet | 120-170mA |
| Active (RF working) | WiFi RX packet | 50-56mA |
| Modem sleep | CPU is working | 15mA |
| Light sleep | 0.9mA | |
| Deep sleep | Only RTC is working | 20uA |
| Shut down | 0.5uA |
It means that some power saving measures are necessary - fortunately, sensor doesn't need to be working all the time, periodic wake-up will be sufficient.
Initial tests
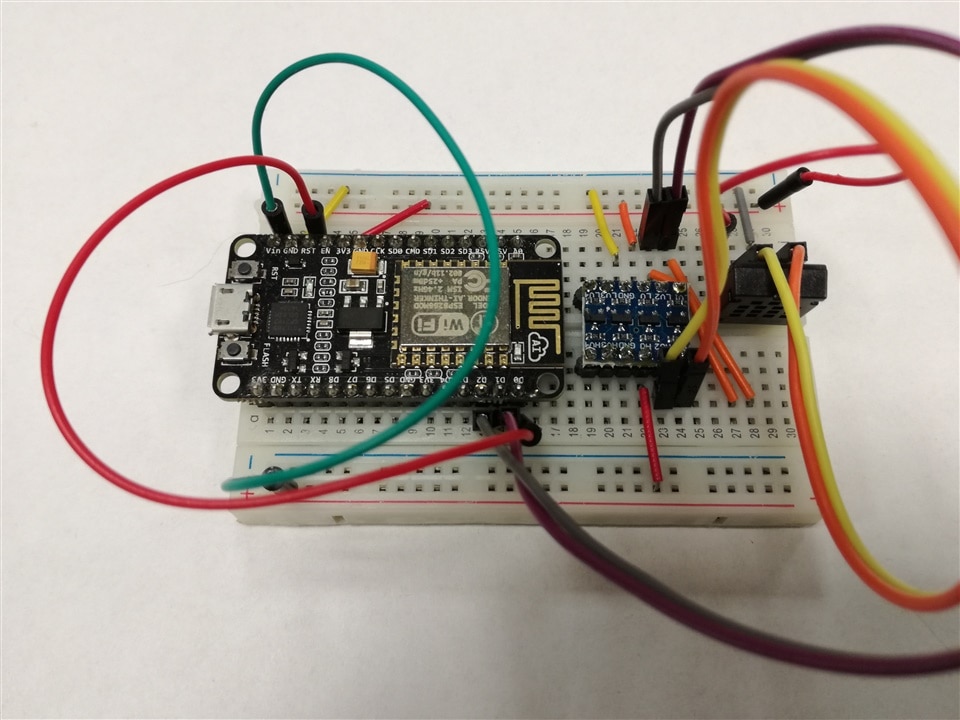
First, proof-of-concept sensor was NodeMCU board based and looked like this:
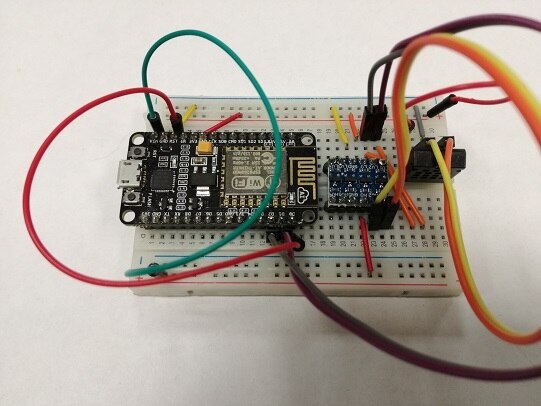
It worked, but the power consumption was unacceptable. As expected duty cycle of the sensor is like one reading every ten minutes, some power measurement method for systems with uneven energy consumption was needed. As I didn't own a proper power profiler during the test (it has changed in the meantime - Element14 has granted me one as a prize in Project14 "RFID or NFC" competition), I had to build my own (primitive but sufficient in my opinion).

It turns out that chipset power consumption is one thing, but typical board includes additional components that can also be power-hungry. Those components are usually: USB-to-UART bridge and power regulator (plus internal structure of the ESP module - that usually includes at least external flash memory). Some boards even have always-on LEDs as power indicators...
For example - commonly installed 3.3V linear power regulator (based on TI LM1117 datasheet) consumes about 5mA when idle and needs additional several mA of load to maintain regulation. Making things worse, LM1117 has about 1.2V dropout voltage, which makes use of standard Li-Ion battery problematic.
ESP8266 has working voltage range is 2.5-3.6V but if installed in a module with additional memory it's operating range is usually narrowed to 3.0-3.6V.
Standard Li-Ion battery with nominal voltage of 3.6V has voltage range from about 2.5V (recommended discharge end voltage) to 4.2V (charge end voltage).
So - using one Li-Ion battery, 3.3V LM1117 will be in undervoltage condition all the time, so another LDO type is needed.
But - returning to our NodeMCU construction - the problem was far worse that power-hungry LDO. Initial tests of switching to deep sleep mode during inactivity revealed that peak consumption is about 240mA, but idle consumption nears 100mA. Additionally, ADC input was not working (returning near-zero constant readings) - this can be easy to explain: ADC in ESP8266 is used mainly for WiFi calibration and it's frequent usage during WiFi operation is oficially discouraged, so it may be disconnected in this particular clone. Not good, let's find something better.
Second prototype
Board selection
Initially, ESP01 module seemed to be an ideal candidate - very cheap, easily connected (no need of breakout board), no unnecessary components. Paired with LDO like HT7333 (250mA, 90mV dropout voltage, 7uA quiescent current) could be really power-efficient. But - as it has only 8 external pins:
- no ADC pin is available, so no battery monitoring,
- as deep sleep auto wake mode uses GPIO0 to reset CPU after sleep period elapses, only one GPIO pin is available - so no I2C, only one-wire sensors possible,
After some additional searching, Wemos D1 mini (clone) turned up as promising candidate. It is still equipped with USB-to-UART bridge, but has power-efficient LDO (ME6211) and enough GPIO for my project.
First one looked like this:
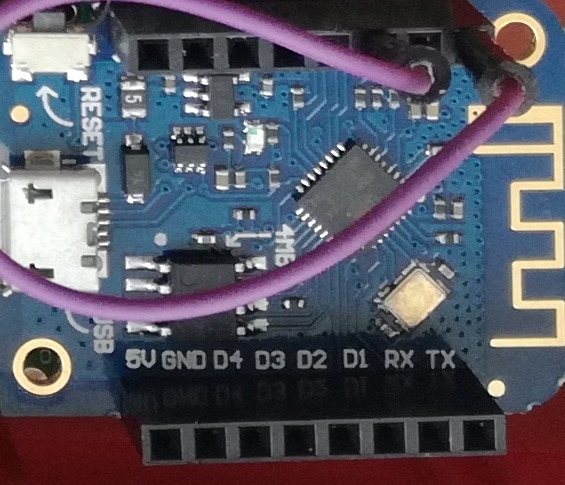
and worked great - during sleep period it consumed less than 1mA.
So second one was bought (the same part from the same seller - reputable online shop, but using their account on local Ebay-like portal) - and this one was of different make:
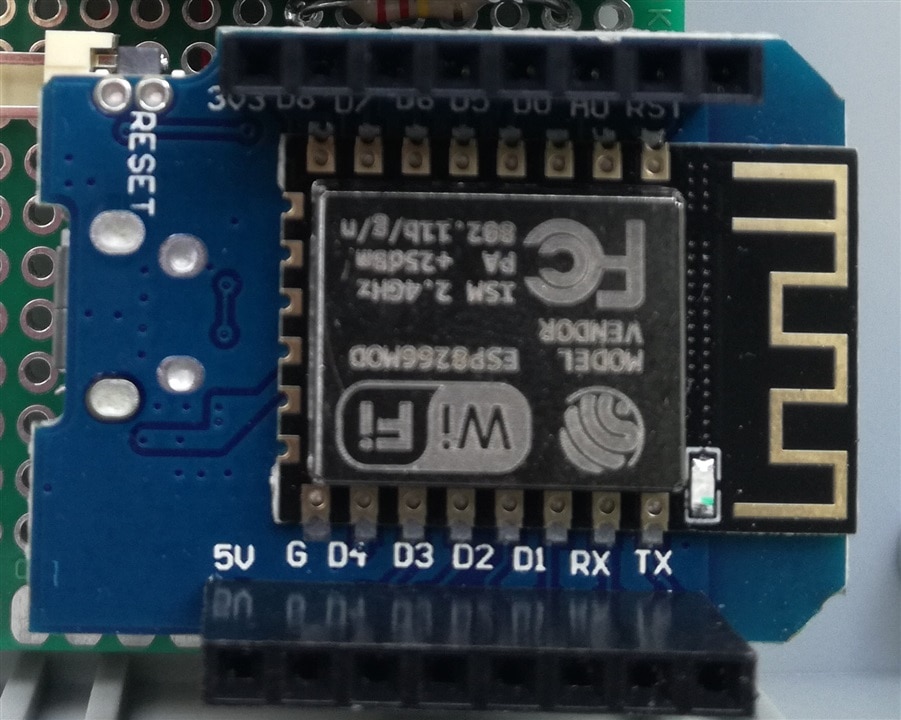
As can be seen, this board uses ESP module instead of bare chips and is more power-hungry - consuming about 20mA when sleeping.
Power supply
Next part - power supply. Initial tests using some powerbank module (with 5V USB input and output) have failed - as this module had some sort of power-saving feature, disabling output (lowering voltage near battery output level to be exact) when current draw was too low, ESP wasn't able to wake from sleep on partially depleted battery.
As a side note - problem with powering-off powerbanks seems to be well known and was addressed in - for example - Staying alive with the 555 project.
Taking into consideration that ME6211 has dropout voltage of about 100mV, it theoretically could be powered directly from Li-Ion cell (working as unregulated power supply below 3.4V), but searching for battery charger module ended with unusual find - J5019 module - that combines TP4056 battery charger with step-up converter (unfortunately without undervoltage protection). Setting output voltage to ~ 5V makes equivalent of powerbank, but without that problematic power-saving mode.
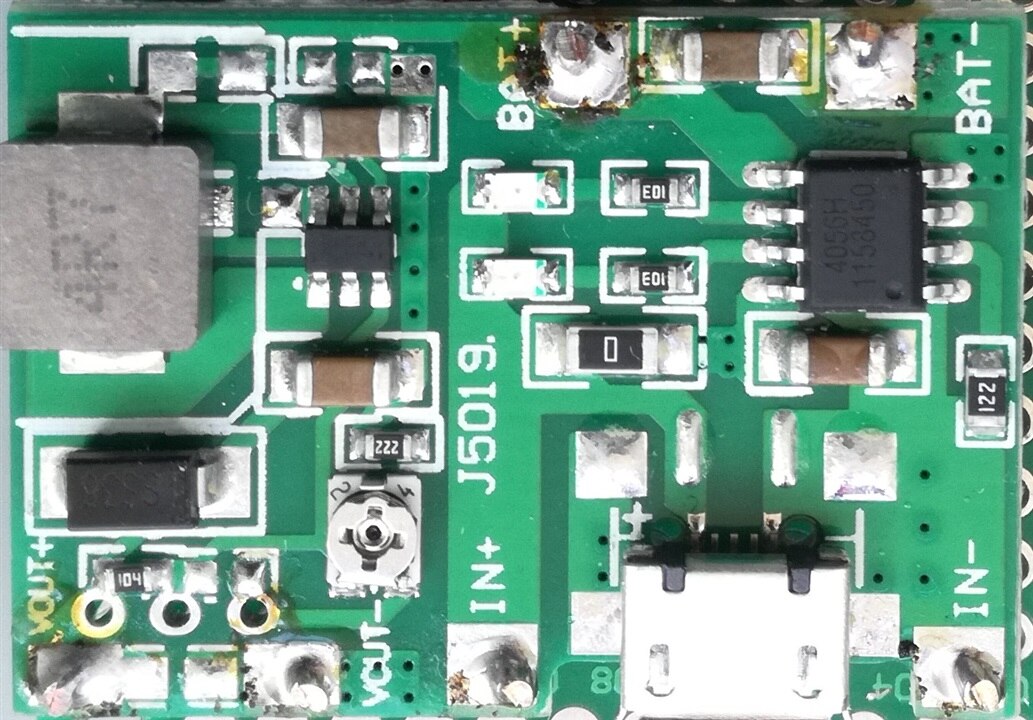
Sensor selection
And the last part - sensors. I have decided to use popular DHT22-like sensors (AM2302 with one-wire interface and AM2320 with I2C interface). They can be powered from 3.3V so could be directly interfaced with ESP module.
That have led to sensor module schematics as a below:

It has voltage divider to measure battery voltage (designed for direct ESP8266 connection - with allowed voltage range of 0-1V. Wemos module has additional divider built-in, allowing for 0-3.3V input voltage range - which is somewhat limiting the precision of measurements in my case) and one sensor connected.
Data gathering
Below are some initial measurements (sensors running next to each other in the office room):
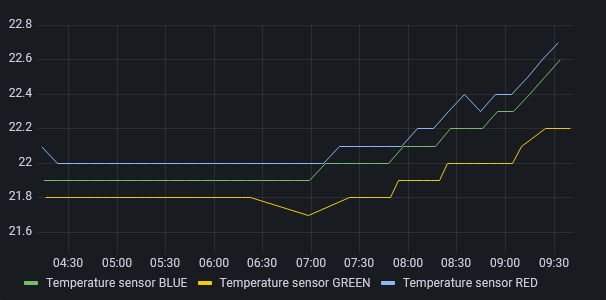
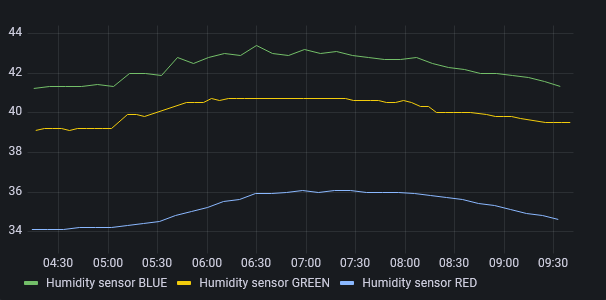
As can be seen, although temperature measurements are similar, humidity difference between sensors is significant. In the graph above, series BLUE and GREEN are from AM2302 sensors and RED one is from AM2320 - which not only reports data significantly lower than two others but seem to have much slower response (graph looks smoother than two others, filtering out rapid changes detected by other two).
As AM23xx sensors - despite having supply voltage range of 3.3-5.5V - are recommended to be operated at 5V, another test was performed. NodeMCU sensor board was modified to allow for supplying AM2320 sensor from 5V (bidirectional level translator was connected on I2C lines).
And measurement data was gathered (between two vertical markers; peaks near reconfiguration time are artifacts, caused by handling of the board, thus increasing its temperature and humidity).
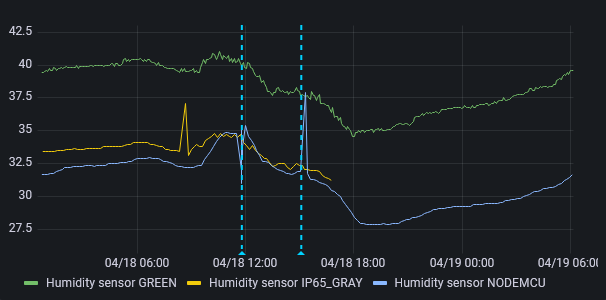
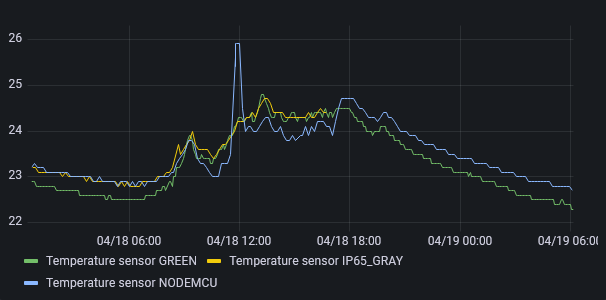
No significant difference was seen - so it seems that observed disparity is not caused by insufficient supply voltage but rather difference between sensors (maybe some of them were of substandard quality or measurement algorithms were different between models).
Using this data, AM2320 module was removed from the test and AM2302 sensors were considered usable for monitoring - offset between different sensors looked constant and reaction to environmental changes similar. As we plan to focus mainly on trends in data, some offset between series seems acceptable at this point.
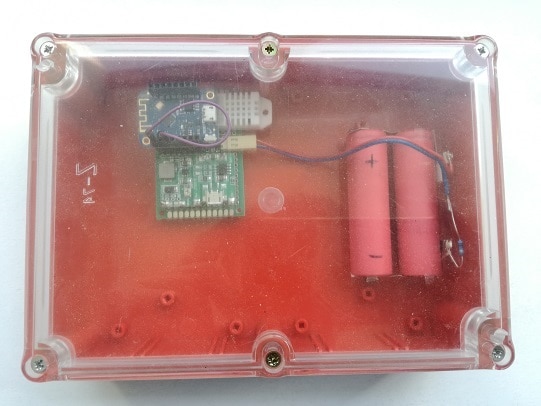
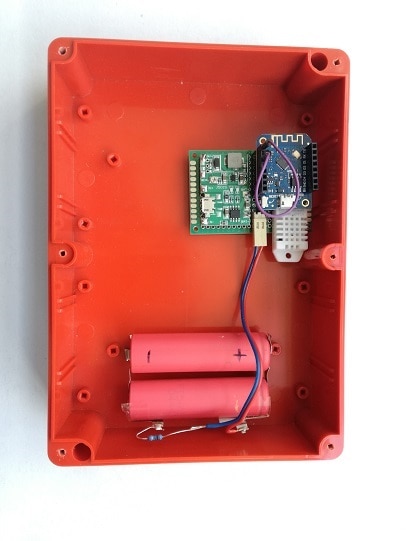
Sensor with battery pack installed in one of enclosures prepared for our test looks like on the photo below - as it is battery powered, no additional holes are necessary. One can clearly see jumper cable enabling deep sleep RTC wake-up that is connecting D0 and RST pins - it has to be removed during module programming, so no permanent connection was made.
Sensor update
As it seems that temperature and humidity are not only factors worth considering in this project, I have decided to add some additional sensors.
Having some doubts about precision of installed AM2302 modules, I have added BME280 I had in my possession at first. Unfortunately, I cannot check it's originality - original chips have Bosch logo and clones are said to not have it, but it is so small I cannot recognize it using magnifying glass I have - maybe simple microscope would be needed.
As I have decided to limit a scope of my experiment somehow - it was ever-expanding to this date, I also decided to use ESP32-devkit module I had. Fortunately, it measured at 5mA of current consumption during sleep (unlike my NodeMCU board I have mentioned in the "sensors" part of my blog) so I have decided to use it, despite its peak consumption of 500mA.
Schematics of this sensor board is as below:
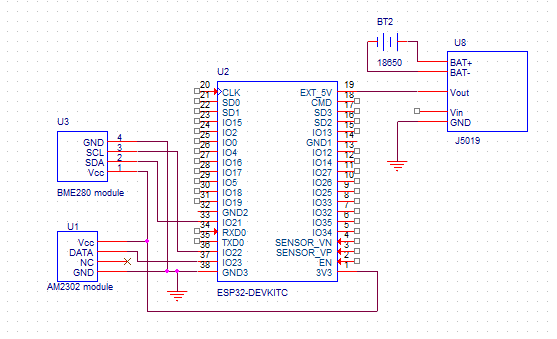
In the next step I decided to add BME280 modules to the existing two boards - but considering their recent significant price jump I have selected something cheaper - combined module of BMP280 and AHT20, resulting in final ESP8266 board schematics like this:
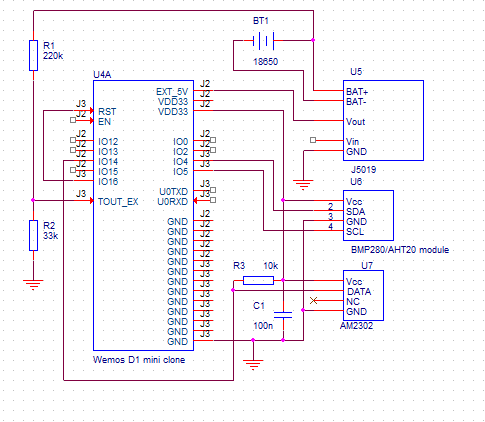
One side note - there are forum posts on the Internet that those modules from time to time ship with non-working BMP280 chip. I had such a situation, on one of two modules I bought BMP280 chip returned chip_id of 0x0 instead of correct value (AHT20 was working). Fortunately, the seller promptly sent replacement board when notified about this problem.
Sensor firmware source is included in file below
Firmware uses ESP8266/ESP32 extensions to Arduino and is configured in two ways: most of configuration data goes to config.h (WiFi connection parameters, monitoring station address, sensor identifier), and installed sensor set is defined by #define expressions - by commenting or uncommenting sensor flags one can customize the code to use different sensor types
//#define AM2320_SENSOR 1
#define DHT_SENSOR 1

#define BMP280 1
//#define BME280 1
#define AHTX0 1
Monitoring station
Physical assembly
I have decided to use provided LattePanda SBC as a central monitoring station that will gather data from the sensors and provide interface for data visualization.
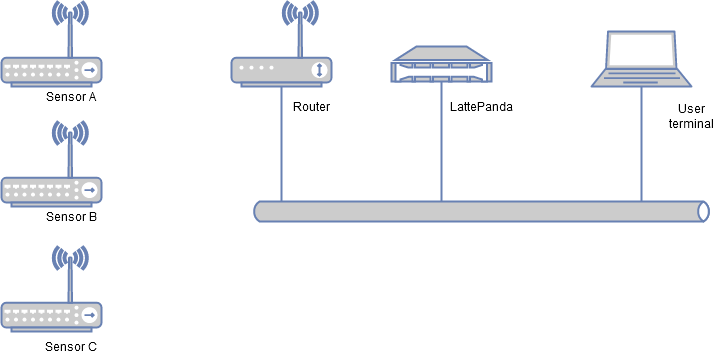
LattePanda V.1 is a x86 based single board computer with four core 1.9GHz Intel Atom CPU, 2GB of RAM, 32GB SSD and Windows 10 license (in the version included in the challenge kit).
It includes 100Mb/s Ethernet port, Bluetooth and WiFi connectivity, USB 3.0 and 2.0 interfaces and Arduino Leonardo compatible module integrated (which is rather unusual and allows for replacing Raspberry PI - Arduino combos sometimes found in various projects).
As this SBC was not planned to be installed in Hammond enclosure, dedicated one was used
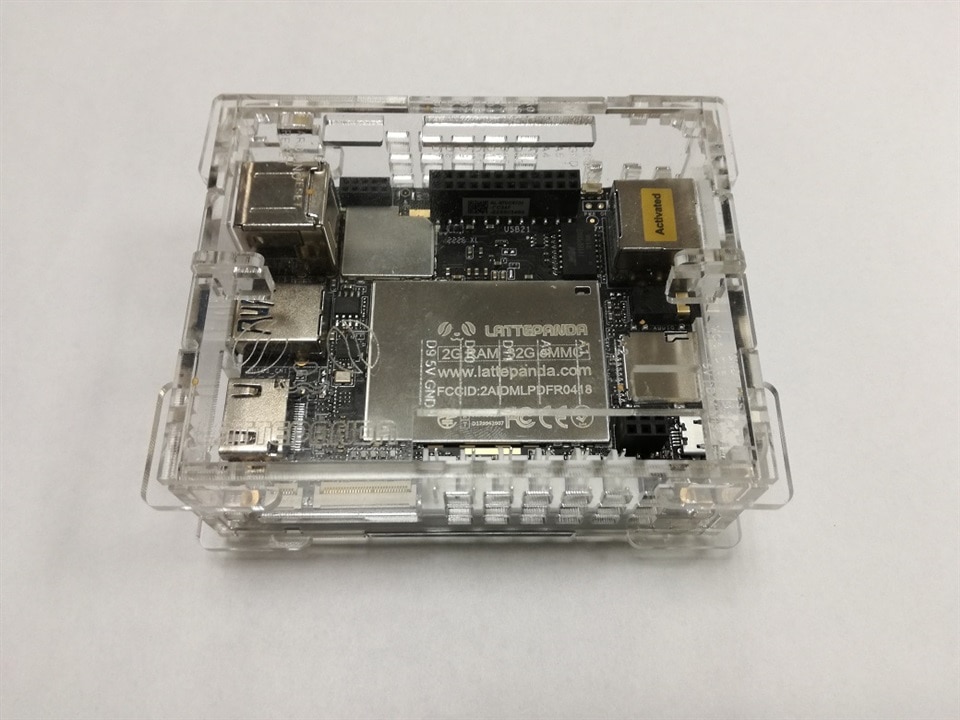
Lattepanda V.1 acrylic enclosure
Inside the packaging one can find two acrylic, paper covered boards that are containing all the elements and one page assembly manual.
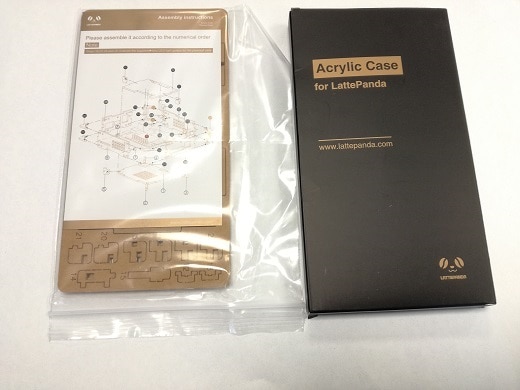
Assembly process is a little tricky - acrylic elements need to be gently removed as they are somewhat brittle and during the assembly enclosure behaves as some sort of 3D puzzle, but at the end it turns out to be sturdy and even can be opened again if some care is taken to not damage corner braces.
Final effect can be seen on the photo below (well - semi-final - without internal Wi-Fi antenna. That's why the case needed to be opened again)
OS reinstallation and customization
I have decided to install Ubuntu Linux, time-series database InfluxDB and Grafana for data presentation, so OS re-installation was needed.
After connecting power supply, monitor, keyboard and mouse, familiar MS Windows desktop appeared

LattePanda documentation states that both MS Windows and GNU/Linux are officially supported, so installation process was planned using standard procedure described in the documentation:
https://docs.lattepanda.com/content/1st_edition/os/#linux-ubuntu-1604-lts
After downloading recommended Clonezilla image of Ubuntu 16.04 LTS (Long Time Support) (and MS Windows image for CR700 H/W version just in case - it is paid for in this HW revision after all) and preparing boot USB drive using Etcher software minor inconsistency was encountered . Manual states that simply inserting USB drive and rebooting initiates installation, but in my case Panda booted into Windows every time.
That meant that boot disk order was different than expected. As in any PC computer, pressing dedicated key (ESC in case of LattePanda) during reset enters BIOS/UEFI, then using Boot tab boot order was modified
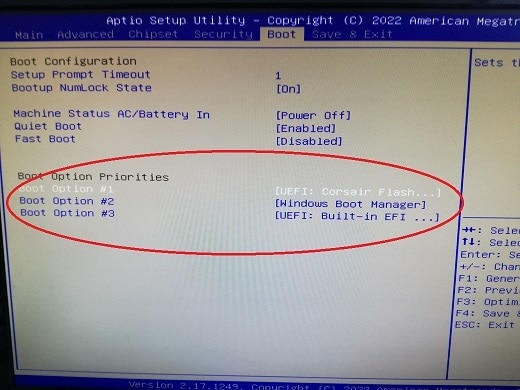
and - after reboot - installation has started. System image seems to be dedicated to another H/W version (CR200) but it installed correctly on our hardware.
Installation process progressed as in the manual and at the end we got working Ubuntu GUI (login using admin:admin)
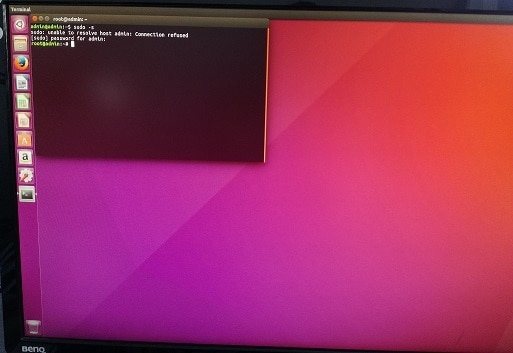
Next step - install SSH server and enable remote access. After connecting Ethernet cable system automatically got address using DHCP, but then repository problem appeared.
After issuing
#apt-get update
#apt-get install openssh-server
error message appeared informing about unmet dependencies. It turned out that the system used repository mirror at http://mirror.neu.edu.cn that seemed outdated. Replacing all references to http://mirror.neu.edu.cn with http://archive.ubuntu.com/ in /etc/apt/sources.list file, then re-running
#apt-get update
#apt-get install openssh-server
installed openssh server correctly. Next - some monitoring tools:
#apt-get install lm-sensors
#sensors-detect
#sensors
allowed for CPU temperature monitoring
# sensors
soc_dts1-virtual-0
Adapter: Virtual device
temp1:        +70.0°C

acpitz-virtual-0
Adapter: Virtual device
temp1:         +0.0°C  (crit = +100.0°C)

coretemp-isa-0000
Adapter: ISA adapter
Core 0:       +70.0°C  (high = +90.0°C, crit = +90.0°C)
Core 1:       +71.0°C  (high = +90.0°C, crit = +90.0°C)
Core 2:       +74.0°C  (high = +90.0°C, crit = +90.0°C)
Core 3:       +73.0°C  (high = +90.0°C, crit = +90.0°C)

soc_dts0-virtual-0
Adapter: Virtual device
temp1:        +71.0°C
No surprise that one type of enclosure has fan installed.
After verifying on the router what address LattePanda gets (or even better - add static DHCP MAC:IP_ADDR mapping or even static IP address to not be surprised by sudden address change after DHCP lease expiration) remote login into Panda from another computer was attempted:
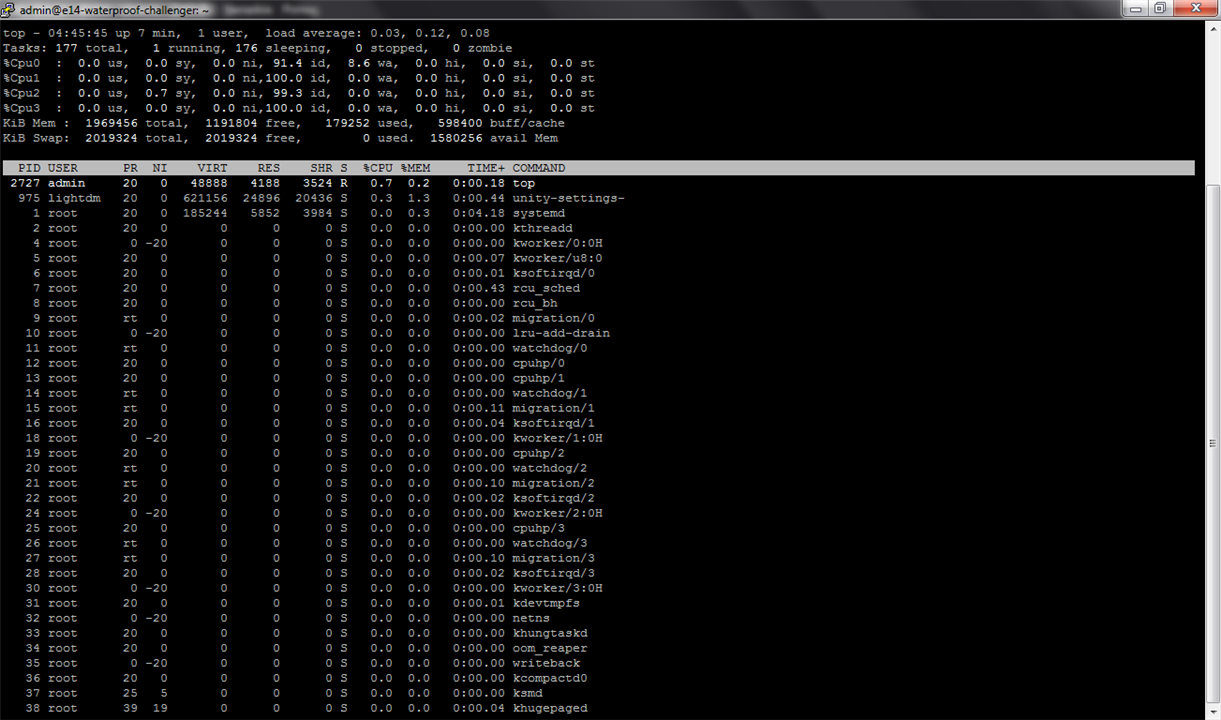
Then OS installation was (de)customized by:
- changing hostname by editing /etc/hostname then running hostname -F /etc/hostname
- changing locale information by removing custom entries from /etc/default/locale then running
dpkg-reconfigure locales - changing timezone by running
timedatectl set-timezone Europe/Warsaw - verifying that NTP time synchronization is running using
timedatectl
Installation of InfluxDB database and Grafana data presentation software.
Some initial remark - this is on-premises, traditional approach. Every element is directly connected, without any additional intermediates or cloud infrastructure - so it can be accessed locally (inside LAN) and external access should be configured as needed. Positive side? Proof of concept was installed on OrangePI Zero with 256MB RAM and works correctly to this day (storing and presenting data from a few sensors for several weeks now).
Another, probably more modern approach was presented (for example) here:
InfluxDB
Let's begin from some theory - what is time-series database (like InfluxDB)? It is database optimized for storage of time-stamped data (like sensor readings). Every record is referenced by it's timestamp, and usually stores one or more values and some additional information. In InfluxDB those are:
- measurement - it can be interpreted as a table in relational database, groups together data of similar type,
- field - it is like a column in RDBMS, it is key-value pair that stores one data value
- tag (set) - list of optional tags that can be used to differentiate data from different sources (for example). As tag keys are indexed, they can be used to accelerate queries
And the beautiful part? Data can be stored in the database using simple HTTP POSTs, like this:
https://docs.influxdata.com/influxdb/v1.8/write_protocols/line_protocol_tutorial/
so interfacing even with low-powered MCUs is very simple (basically - concatenating all the input data into HTTP POST request and doing a HTTP call).
Example HTTP POST content can be seen below:
environment,sensor=METAR Temperature=21,Humidity=35,DewPoint=05,Pressure=1023 1685953800000000000
Considering that version provided in OS repositories is rather archaic, dedicated repository was added as described in installation manual
https://docs.influxdata.com/influxdb/v1.8/introduction/install/
#wget -q https://repos.influxdata.com/influxdata-archive_compat.key

#echo '393e8779c89ac8d958f81f942f9ad7fb82a25e133faddaf92e15b16e6ac9ce4c influxdata-archive_compat.key' | sha256sum -c && cat influxdata-archive_compat.key | gpg --dearmor | sudo tee /etc/apt/trusted.gpg.d/influxdata-archive_compat.gpg > /dev/null

#echo 'deb [signed-by=/etc/apt/trusted.gpg.d/influxdata-archive_compat.gpg] https://repos.influxdata.com/debian stable main' | sudo tee /etc/apt/sources.list.d/influxdata.list

#apt-get install influxdb
Grafana
Grafana will be installed from a downloaded package - there are some certificate problems with current Grafana repository that prevent correct operation on Ubuntu 16.04.
#wget https://dl.grafana.com/oss/release/grafana_9.4.7_amd64.deb

#dpkg -i ./grafana_9.4.7_amd64.deb

#systemctl daemon-reload

#systemctl enable grafana-server

#systemctl start grafana-server
Then, Grafana GUI were accessed at
http://panda_address:3000
(initially log-in using admin:admin)
displaying startup screen

As a side note - Ubuntu installation with all needed components consumes about 6GB of disk, leaving 19GB for user data.
Data gathering script and presentation layer configuration
METAR client
Before we configure presentation layer, let's get some real data. As a reference (because of sensor tolerance) I have chosen weather data obtained from METAR reports.
METAR stand for Meteorological Aerodrome Report and are prepared by the airports or weather observation stations to describe current weather - usually in the vicinity of the airport - for aviation use. METARs for different sites can be downloaded at central location - website owned by National Oceanic and Atmospheric Administration and are indexed by coded name of destination point (for example - airport).
METARs are freely available (in contrast to other weather data sources that are usually paid-for or dedicated for one kind of application and actively prevented by authors from other forms of usage), but usually only for places with nearby airport or weather observation station.
So - let's install standard METAR client tool:
#apt-get install metar
Quick check (download METAR report for some arbitrary location) - and failure:
#metar -d ehgr

METAR pattern not found in NOAA data.
In turns out that Ubuntu 16.04 ships with outdated version of metar utility - querying using HTTP instead of HTTPS (which method was discontinued by the provider - National Oceanic and Atmospheric Administration). We could upgrade Ubuntu, build from source newer version of metar utility or learn how to parse METAR reports ourselves.
We will go the last route. First thing we need to know is a code for an airport nearbly. Using for example
https://airportcodes.aero/search
we can find ICAO code for - for example Warsaw Chopin Airport (which is EPWA).
Then, using the URL from our failed metar execution we can download a report:
#wget http://tgftp.nws.noaa.gov/data/observations/metar/stations/EPWA.TXT

URL transformed to HTTPS due to an HSTS policy
--2023-04-25 11:50:17--  https://tgftp.nws.noaa.gov/data/observations/metar/stations/EPWA.TXT
Resolving tgftp.nws.noaa.gov (tgftp.nws.noaa.gov)... 140.172.138.79
Connecting to tgftp.nws.noaa.gov (tgftp.nws.noaa.gov)|140.172.138.79|:443... connected.
HTTP request sent, awaiting response... 200 OK
Length: 79 [text/plain]
Saving to: ‘EPWA.TXT’
EPWA.TXT                          100%[==========================================================>]      79  --.-KB/s    in 0s
2023-04-25 11:50:18 (2.59 MB/s) - ‘EPWA.TXT’ saved [79/79]
As can be seen, wget correctly redirects to HTTPS when HTTP is not available.
Now let's see our report:
#cat EPWA.TXT

2023/04/25 09:30
EPWA 250930Z 30011KT 9999 -RA BKN012 09/07 Q1005 BECMG BKN020
We can decode it manually using data from
https://metar-taf.com/explanation
Most interesting fields are:
- 250930Z (09:30 UTC time)
- 09/07 (temperature of 9 deg. C with dew point at 7 deg. C)
- Q1005 (air pressure of 1005 hPa)
So - let's create some simple script to decode and store those data in our database ("Go away or I will replace you with simple shell script" says angry sysadmin to some persistent user).
Complete script is attached below
To execute it, we will need to create InfluxDB database first:
#influx
Connected to http://localhost:8086 version 1.8.10
InfluxDB shell version: 1.8.10
> create database tests
> exit
Then run our script and check if data is present in database:
# influx --database tests
Connected to http://localhost:8086 version 1.8.10
InfluxDB shell version: 1.8.10
> select * from environment
name: environment
-----------------
time                    DewPoint        Humidity        Pressure        Temperature     sensor
1682418600000000000     8               93              1005            9               METAR
> exit
Data visualisation
Now, as we have our first data, let's graph it. We will need to create datasource for local InfluxDB instance, then create some graphs. Graphs are created using panels and grouped by dashboards.
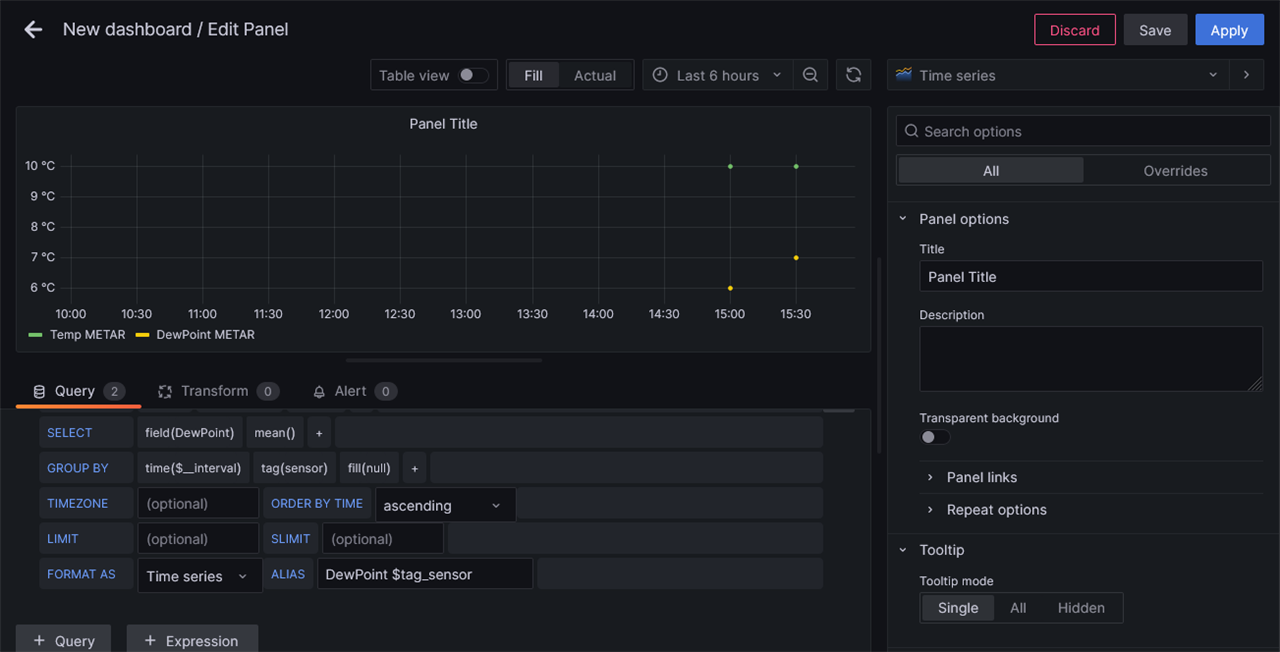
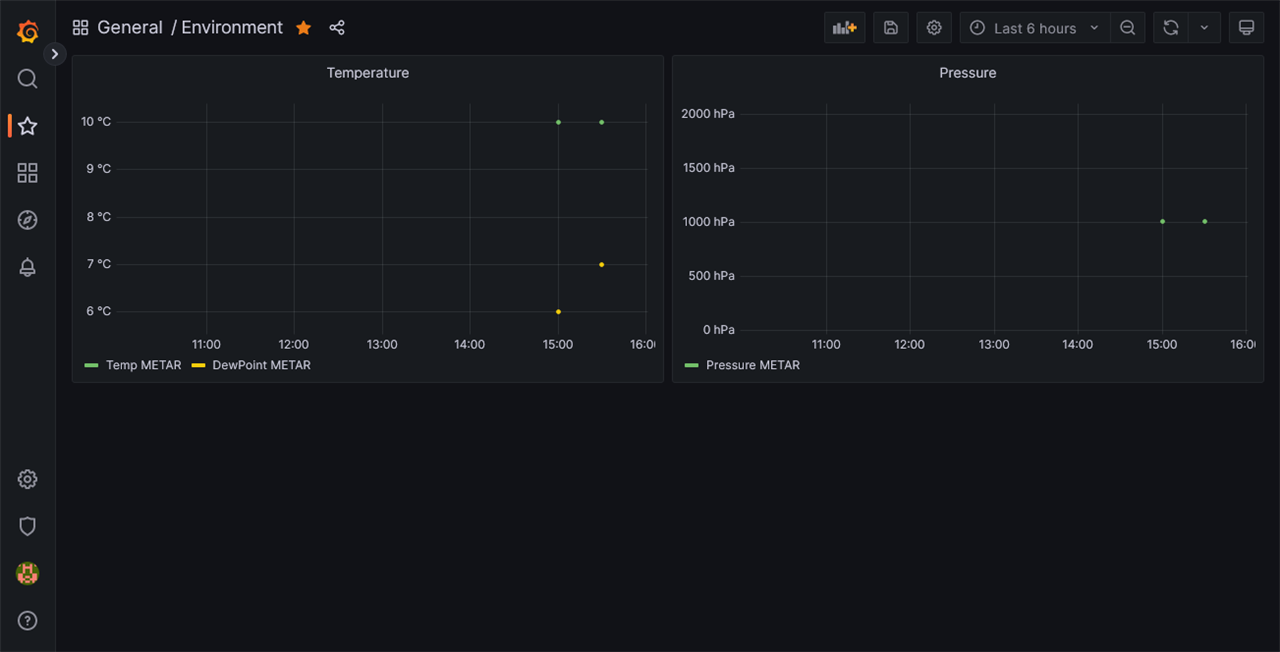
And our first graphs will look like this

Now we have created a simple weather station gathering data from METAR reports for an airport nearbly.
Experiment results
First stage of my experiment was to put both of reference enclosures outside and check for moisture buildup (challenge kit didn't arrived yet at this time), hopefully observing condensation during high temperature variations of early spring . As relative humidity changes with temperature, and weather conditions caused daily temperature variations I decided to monitor dew point temperature - it should be constant assuming constant amount of water vapor inside (and dew point temperature change would indicate water vapor migration to or from enclosure). Simple? Well not exactly.
First lesson - do not leave sensor in place with direct sun operation possible:
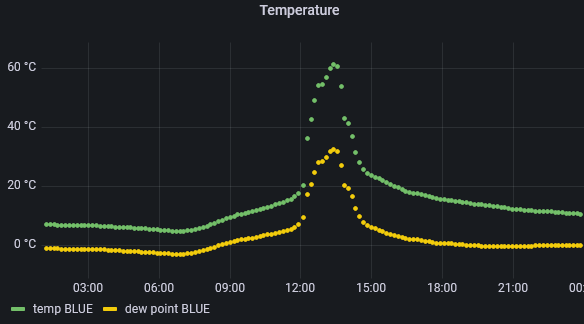
As can be seen, in the enclosure temperature can easily exceed 60°C (despite overall low external temperature), exceeding - for example - LattePanda allowed temperature range of 0~60°C (reference - data from LattePanda support forum /challenges-projects/design-challenges/experimenting-with-waterproof-connectors/f/forum/52797/lattepanda-v-1-environmental-requirements-found)
And first inconsistency - dew point temperature hike then drop along with inside temperature - in theory, when dew point temperature rises it means humidity increase (strange alongside such a big temperature jump) and condensation should be detectable when inside temperature lowers below that hiked dew point temperature, but none was observed.
As dew point calculation was done using formula published by University of Arizona (https://cals.arizona.edu/azmet/dewpoint.html) it could mean three things - either formula is not very precise in given range of input data, sensor operation is not ideal or there are some additional variables to measure. That encouraged me to modify my sensors boards by adding additional temperature/humidity combo sensor (to verify/compare readings from the enclosure) plus pressure sensor (as described in "sensor update" part of this article).
In the meantime I have consulted available literature ("The Rotronic Humidity Handbook" from http://www.southeastern-automation.com/PDF/Rotronic/Humidity_Handbook.pdf) and dew point variation seems to be normal:
Effect of Temperature and Pressure on %RH
[...]
c) in a closed container of fixed volume, %RH decreases as temperature increases,
however not quite as strongly as in the situation of the open space.
Slower RH decrease means dew point temperature increase, so - dew point temperature is not as usable metric inside closed container as it would be in open space.
Long term monitoring of my "bad reference" enclosure showed that (assuming wet weather with frequent rain but installation protected from direct rainfall by placing under the roof) mean moisture level inside enclosure without proper sealing (gasket missing) constantly increases:
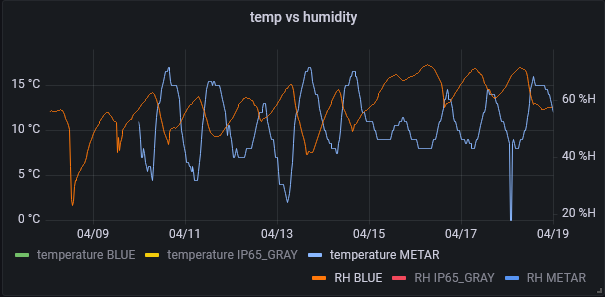
Taking into account daily temperature cycle (METAR temperature data plotted on the blue graph), it can be observed that internal RH increased from 60% to 69% (measured at points of constant external temperature of 10°C) during about eight days.Unfortunately weather got warmer before I was able to observe condensation inside (as I hoped).
Next phase - install all three enclosures (including our DUT) with dehumidifier bags inside and start measuring:
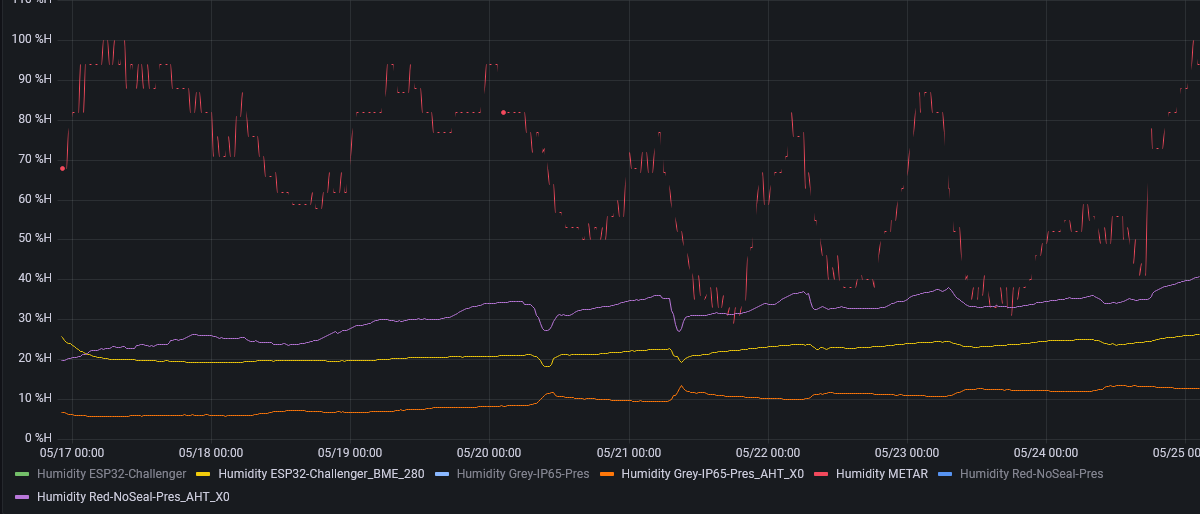
After brief humidity drop caused by dehumidifier removing resident moisture, [rolling mean value of] humidity in all enclosures started to grow. As expected, with the fastest rate inside "bad reference" enclosure, but also - at lower rate - inside DUT and "good reference". "Good reference" started from lower point through - it seems that because of it's lower volume, dehumidifier was able to work more effectively.
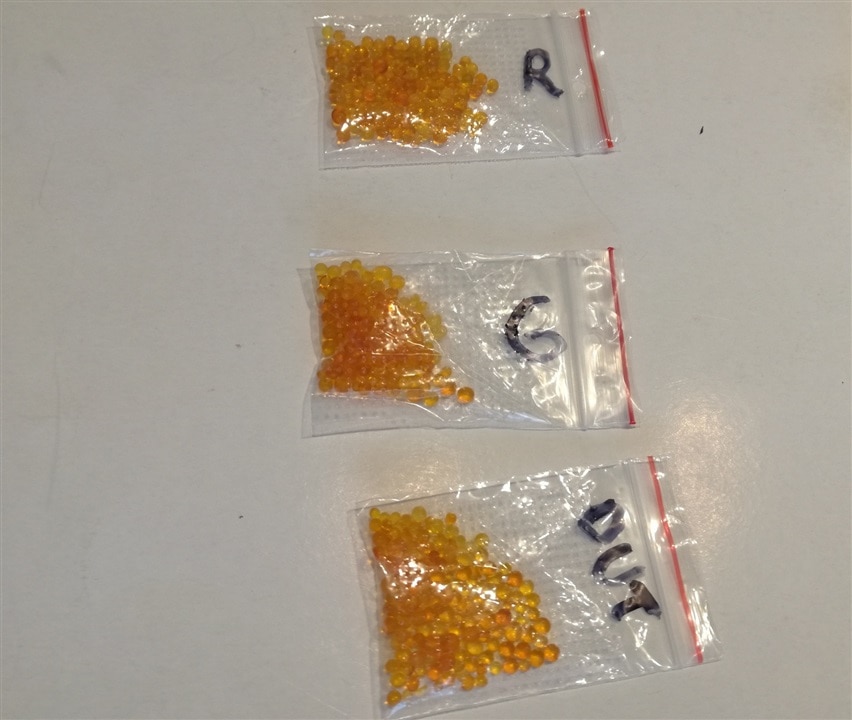
Those results can be confirmed by the appearance of silica gel after the test
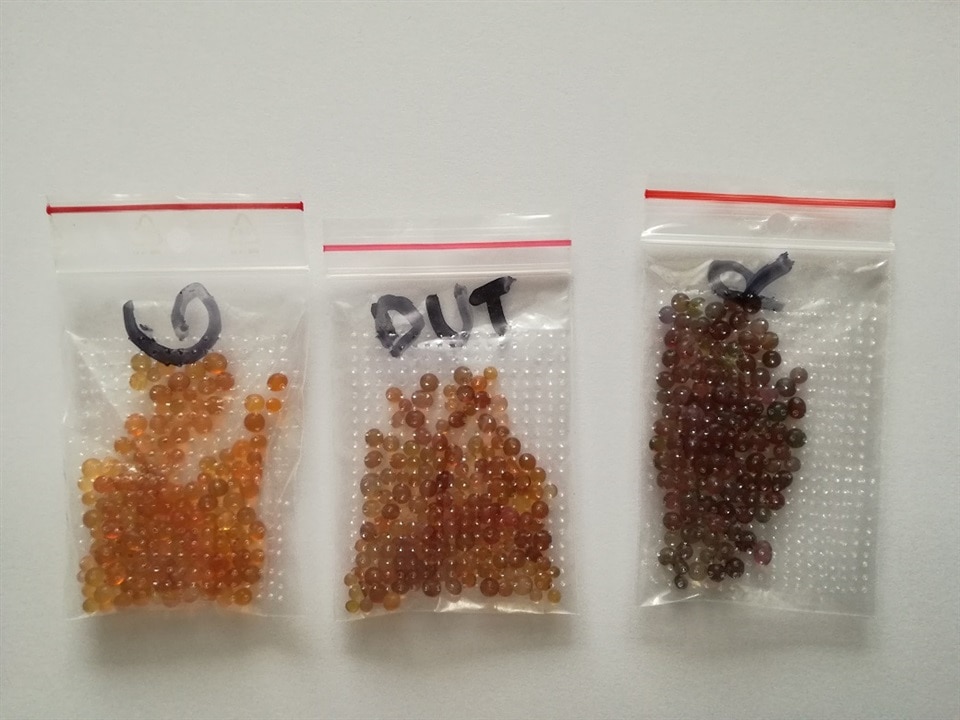
It can be seen that "good reference" gel looks like new, DUT is slightly darker and dehumidifier from "bad reference" is the darkest one. When comparing those three bags one should remember that DUT has a volume nearly three times of other enclosures, so it contained more moisture initially.
One can ask if conclusions from examining graph data are correct - temperature variations can influence relative humidity after all - so let's check actual readings at the same temperature level. I have selected temperature of about 15°C because it was present through all the test window - despite overall day-to-day temperature increase.
To take into account different volumes of enclosures, absolute humidity was also calculated (using calculator at https://www.omnicalculator.com/physics/absolute-humidity), then multiplied the air volume to obtain water vapor mass. Enclosure volumes were calculated earlier - in section of this document describing enclosures.
Remark - as temperatures inside each enclosure can be slightly different, not all data points are present in all enclosures.
| Date | Temperature | Humidity "bad" | Water vapor mass "bad" | Humidity "good" | Water vapor mass "good" | humidity DUT | Water vapor mass DUT |
| 2023-05-17 01:13 | 15.82°C | 20.9% | 3mg | 6.08% | 1mg | 22.06% | 9mg |
| 2023-05-19 15:56 | 15.53°C | 30.35% | 7.82% | 21.1% | |||
| 2023-05-21 03:31 | 15.44°C | 35.71% | 9.57% | 22.43% | |||
| 2023-05-23 02:25 | 15.45°C | 36.49% | 10.9|% | 24.36% | |||
| 2023-05-25 03:49 | 15.44°C | 41.3% | 12.74% | 1.8mg | 24.36% | ||
| 2023-05-25 08:50 | 15.4°C | 41.9% | 6mg | 26.43% | 11mg |
From this data we see that our Hammond enclosure fitted with six Amphenol connectors behaves even better than fully sealed "good" reference. But why? Trying to explain this phenomenon we will use data from additional sensor we have added.
When we graph internal pressure of the enclosures we can see something interesting:
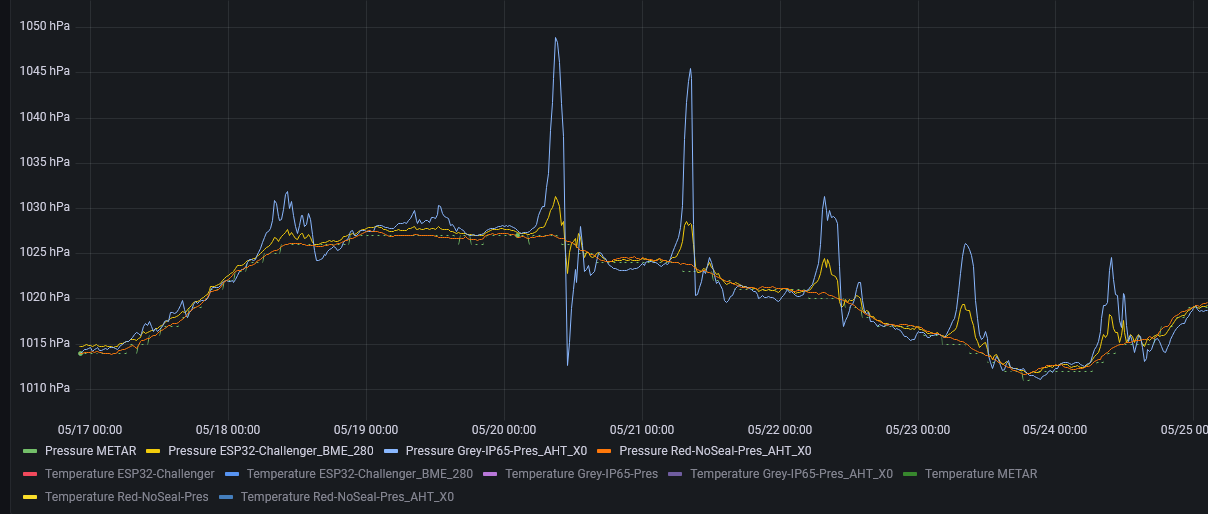
We can see that pressure inside our "bad" reference closely follows external pressure (green line - data obtained from METAR reports), but other two behave different.
Most interesting is dataset from out "good" reference - when temperature rises, internal pressure quickly goes up (that is something expected - pressure of gas inside closed space increases with temperature rise). When it exceeds external pressure by about 20hPa, gasket fails and pressure lowers - what is interesting, it seems that to the level below external pressure, then starts to oscillate with decaying amplitude. That air exchange process can accelerate moisture buildup when external humidity is bigger than internal. Similar process is observable for my Hammond enclosure, but with far lower amplitude (it seems that one of gaskets fails sooner, preventing big pressure buildup and excessive air exchange).
Below there are graph fragments for the "good" reference (compared to the "bad" reference):
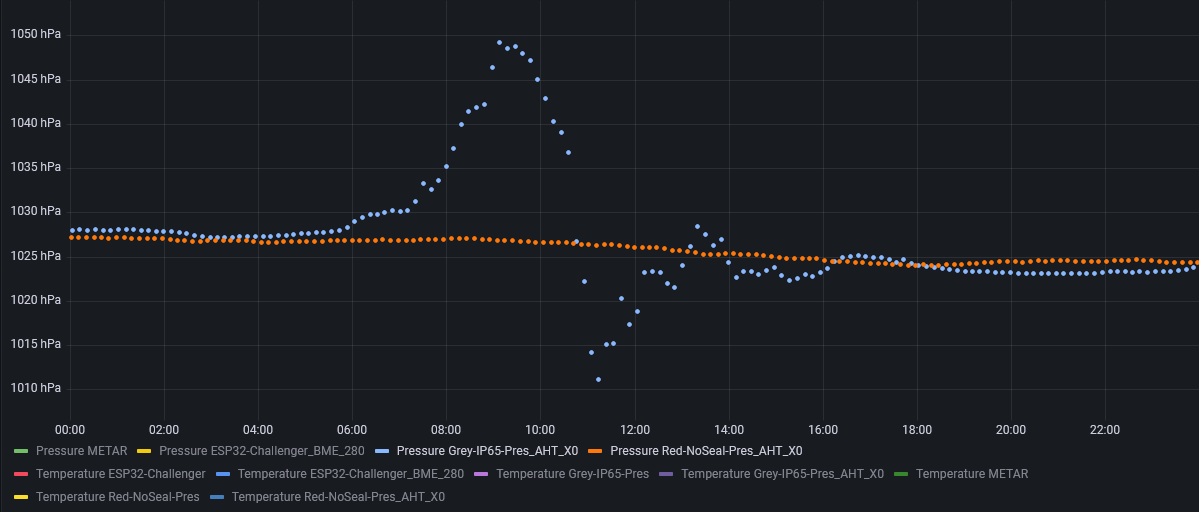
then Hammond enclosure (compared to the "bad" reference)
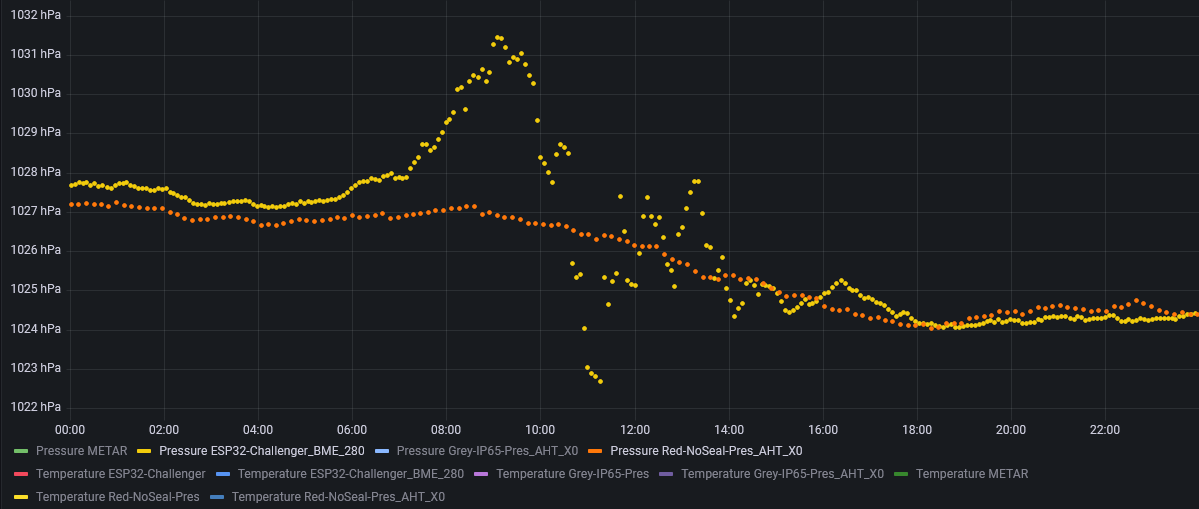
The same process can be seen but with different magnitude - below those three series on one graph (with addition of temperature curve inside "good" reference enclosure):
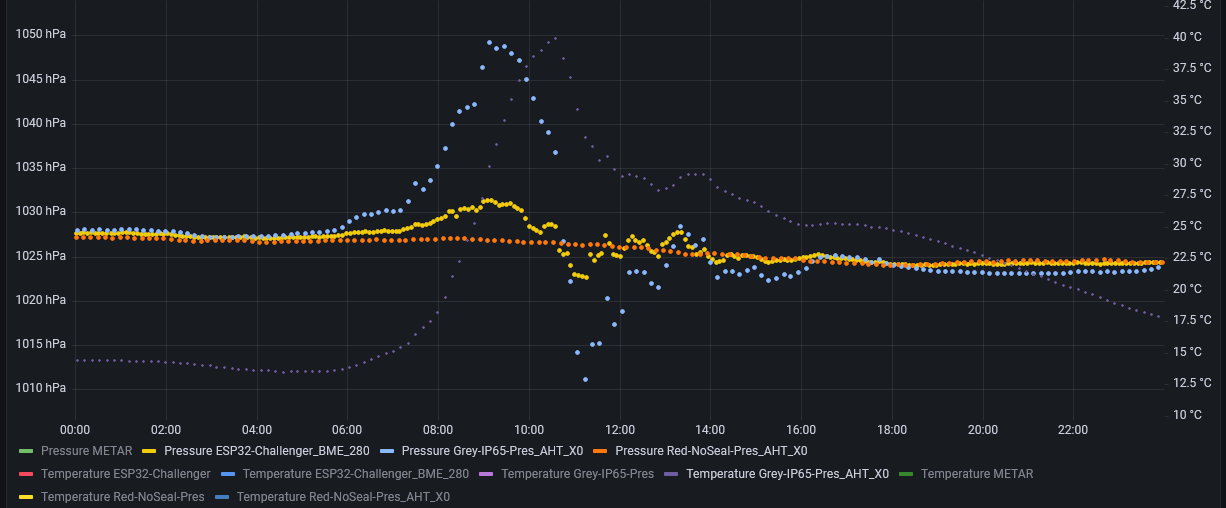
As can be seen, pressure drop is not caused by lowered temperature - it happens when temperature is still rising, which is additional point for the theory of failing gasket.
I have spoken with Kradex support about this phenomenon and they suggested installing pressure compensation plug to limit pressure buildup during day-night temperature variations. I have asked the same question to the Hammond support and got confirmation:
Yes, I would recommend trying a pressure compensation plug if there is moisture buildup inside.
We have one available that is rated up to Nema Type 4, 4X (IP66). Part # BDN4XN1
The 1554VA2GYCL has a max rating of Type 6, 6P which is for submersion. If they need a higher rated plug, they will have to find one elsewhere, since we don’t sell it currently. It sounds like they aren’t submersing the enclosure, so the above plug should work for them.
Such plug looks like this:
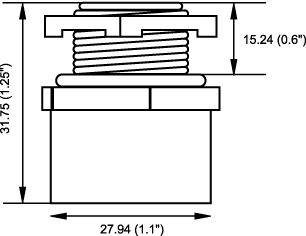
and as far as no submersion is expected, it can allow for further limiting of moisture buildup inside the enclosure. There are also third-party pressure compensation plugs rated for IP67/IP68 if required.
And the last point - Moisture Vapor Transmission Rate. One of desiccant manufacturers published a document about protecting sealed enclosures from moisture intrusion (https://www.agmcontainer.com/blog/how-to/engineering-moisture-pressure-protection-guide/), where they have mentioned water vapor transmission through plastics as possible way of moisture buildup.
After investigating, problem seems non-trivial: although material properties manuals specify MVTR for different plastic types, it seems that values provided are for packaging foils (1mil, about 25um thick).
Although ASTM F1249-20 specification for measuring WVTR through plastics says that provided method can be applied to plastic sheets up to 3mm thick, there is no solid data for thickness values different than reference one (and even this reference is often not stated).
Some sources suggest to scale it in linear way, but other warn that it cannot be guaranteed in all cases, and scaling published WVTR values for plastics used in my enclosures is giving values far to high.
For example, https://static.thermoscientific.com/images/D20826~.pdf defines WVTR for polystyrene at 1220 g/m2/24h (at standard 37°F and 90% RH, but with unknown thickness).
Assuming reference thickness of 25um, then scaling it in linear way to 3mm, then derating it by factor of 4 to account for lower mean external temperature still results in transfer of about 0.19g/24h, that is greater than full observed humidity increase.
Additionally, both Hammond and Kradex support teams seem to be sceptic about WVTR being possible source of moisture intrusion. Below is a fragment of answer for Hammond support team:
[...] I have spoken to the factory who have advised they have no MVTR data specific to our enclosure unfortunately. They understand what you mean regarding the values but it doesn’t seem applicable to our enclosures. [...]
Summary
During this experiment, I have measured moisture buildup inside Hammond enclosure fitted with six Amphenol connectors.
Both immersion test and extended time internal humidity measurements showed that Hammond enclosure and Amphenol connector set exceed my expectations - despite no covers installed on connector external parts there was no detected water leak during the submersion test.
Also air moisture intrusion test placed this setup even ahead of fully sealed IP65 enclosure (that I frankly didn't expected considering both it's bigger size - implying longer gasket surface and six additional possible weak points in form of installed connectors and their gaskets).
Considering that most of the moisture intrusion seems to be connected with failing gaskets when pressure buildup is present (during temperature variations - for example day/night operation), there is a possibility of improvement by installing pressure compensation cap then repeating the test.
Personally I find this challenge very educating - I have done observations that I would not expect previously (not only pressure buildup but also dew point instability in closed chamber or even possible link to water vapor migration through solids) and for that I would like to thank both Element14 and challenge's sponsors: Amphenol and Hammond Manufacturing.
One thing I wanted to do but didn't have time is to test the behavior of connectors when left powered, unconnected and without additional protection for extended periods of time in high moisture environment - probably some sort of galvanic corrosion could be observable.
References
A Guide to Engineering Moisture & Pressure Protection for Sealed Enclosures
The Rotronic Humidity Handbook
Predicting Permeability & Transmission Rate for Multilayer Materials, KAY COOKSEY, KENNETH S. MARSH



Top Comments