element14 Community
element14 Community
    Register Log In
  • Site
  • Search
  • Log In Register
  • Members
    Members
    • Benefits of Membership
    • Achievement Levels
    • Members Area
    • Personal Blogs
    • Feedback and Support
    • What's New on element14
  • Learn
    Learn
    • Learning Center
    • eBooks
    • STEM Academy
    • Webinars, Training and Events
    • Learning Groups
  • Technologies
    Technologies
    • 3D Printing
    • FPGA
    • Industrial Automation
    • Internet of Things
    • Power & Energy
    • Sensors
    • Technology Groups
  • Challenges & Projects
    Challenges & Projects
    • Design Challenges
    • element14 presents
    • Project14
    • Arduino Projects
    • Raspberry Pi Projects
    • Project Groups
  • Products
    Products
    • Arduino
    • Dev Tools
    • Manufacturers
    • Raspberry Pi
    • RoadTests & Reviews
    • Avnet Boards Community
    • Product Groups
  • Store
    Store
    • Visit Your Store
    • Choose Another Store
      • Europe
      •  Austria (German)
      •  Belgium (Dutch, French)
      •  Bulgaria (Bulgarian)
      •  Czech Republic (Czech)
      •  Denmark (Danish)
      •  Estonia (Estonian)
      •  Finland (Finnish)
      •  France (French)
      •  Germany (German)
      •  Hungary (Hungarian)
      •  Ireland
      •  Israel
      •  Italy (Italian)
      •  Latvia (Latvian)
      •  
      •  Lithuania (Lithuanian)
      •  Netherlands (Dutch)
      •  Norway (Norwegian)
      •  Poland (Polish)
      •  Portugal (Portuguese)
      •  Romania (Romanian)
      •  Russia (Russian)
      •  Slovakia (Slovak)
      •  Slovenia (Slovenian)
      •  Spain (Spanish)
      •  Sweden (Swedish)
      •  Switzerland(German, French)
      •  Turkey (Turkish)
      •  United Kingdom
      • Asia Pacific
      •  Australia
      •  China
      •  Hong Kong
      •  India
      •  Korea (Korean)
      •  Malaysia
      •  New Zealand
      •  Philippines
      •  Singapore
      •  Taiwan
      •  Thailand (Thai)
      • Americas
      •  Brazil (Portuguese)
      •  Canada
      •  Mexico (Spanish)
      •  United States
      Can't find the country/region you're looking for? Visit our export site or find a local distributor.
  • Translate
  • Profile
Forget Me Not Design Challenge
  • Challenges & Projects
  • Design Challenges
  • Forget Me Not Design Challenge
  • More
  • Cancel
Forget Me Not Design Challenge
Blog eLDERmon Graphs
  • Blog
  • Forum
  • Documents
  • Events
  • Mentions
  • Sub-Groups
  • Tags
  • More
  • Cancel
  • New
Blog Post Actions
  • Subscribe by email
  • More
  • Cancel
  • Share
  • Subscribe by email
  • More
  • Cancel
Group Actions
  • Group RSS
  • More
  • Cancel
Engagement
  • Author Author: mcb1
  • Date Created: 20 Oct 2014 11:35 AM Date Created
  • Views 436 views
  • Likes 1 like
  • Comments 4 comments
  • forget_me_not
  • b+
  • design_challenge
  • openhab
  • iot_eldermon
  • tektronix
  • rpisoc
  • eclipse
  • internet_of_things
  • enocean
  • raspberrypi
  • smarthome
  • challenge
  • iot
  • moteino
  • wipi
  • enocean_pi
  • arduino
Related
Recommended

eLDERmon Graphs

mcb1
mcb1
20 Oct 2014

This post is about graphing the data


Link to other posts
Forget Me Not : eLDERmon Intro
Forget Me Not :  eLDERmon  Electrical
Forget Me Not :  eLDERmon  Outlets
Forget Me Not : eLDERmon Planning
Forget Me Not : eLDERmon Parts 1
Forget Me Not :  eLDERmon  Sponsor Parts
Forget Me Not : eLDERmon Hardware Hacking
Forget Me Not : eLDERmon GNUplot
Forget Me Not: eLDERmon Protocol
Forget Me Not : eLDERmon Hardware Hacking #2
Forget Me Not : eLDERmon Hardware Hacking #3
Forget Me Not : eLDERmon Tim
Forget Me Not : eLDERmon Charts
Forget Me Not : LPG Level
eLDERmon EnOcean Sensors
eLDERmon EnOcean Sensors Part 2
eLDERmon EnOcean Sensors Part 3
eLDERmon EnOcean Sensors 4
eLDERmon EnOcean Wireless
eLDERmon External Sensor


One of the things I identified early on in my design, was that I didn't want to be constrained to 'fixed' graphs.


Since my application was to allow non intrusive monitoring of the well-being of an individual/house, I needed to be able to mix and match what was on the screen, and zoom in if required.

The fixed graphs within OpenHAB were not going to be suitable for this.


I looked at exporting the data, but this posed its own problems.

  • How often (Hourly, daily or several times per day, what times, etc)
  • Where do I send it that maintains its security.
  • What do I export.


As I pondered these I came across an add-on to OpenHAB called HABmin.

https://github.com/cdjackson/HABmin


It compliments and adds some other features, but best of all it includes graphing using Highcharts which I'd spotted earlier.

http://www.highcharts.com/


Graphs

I've already shown a few graphs, but having the ability to zoom at will is a real benefit for my application.

image

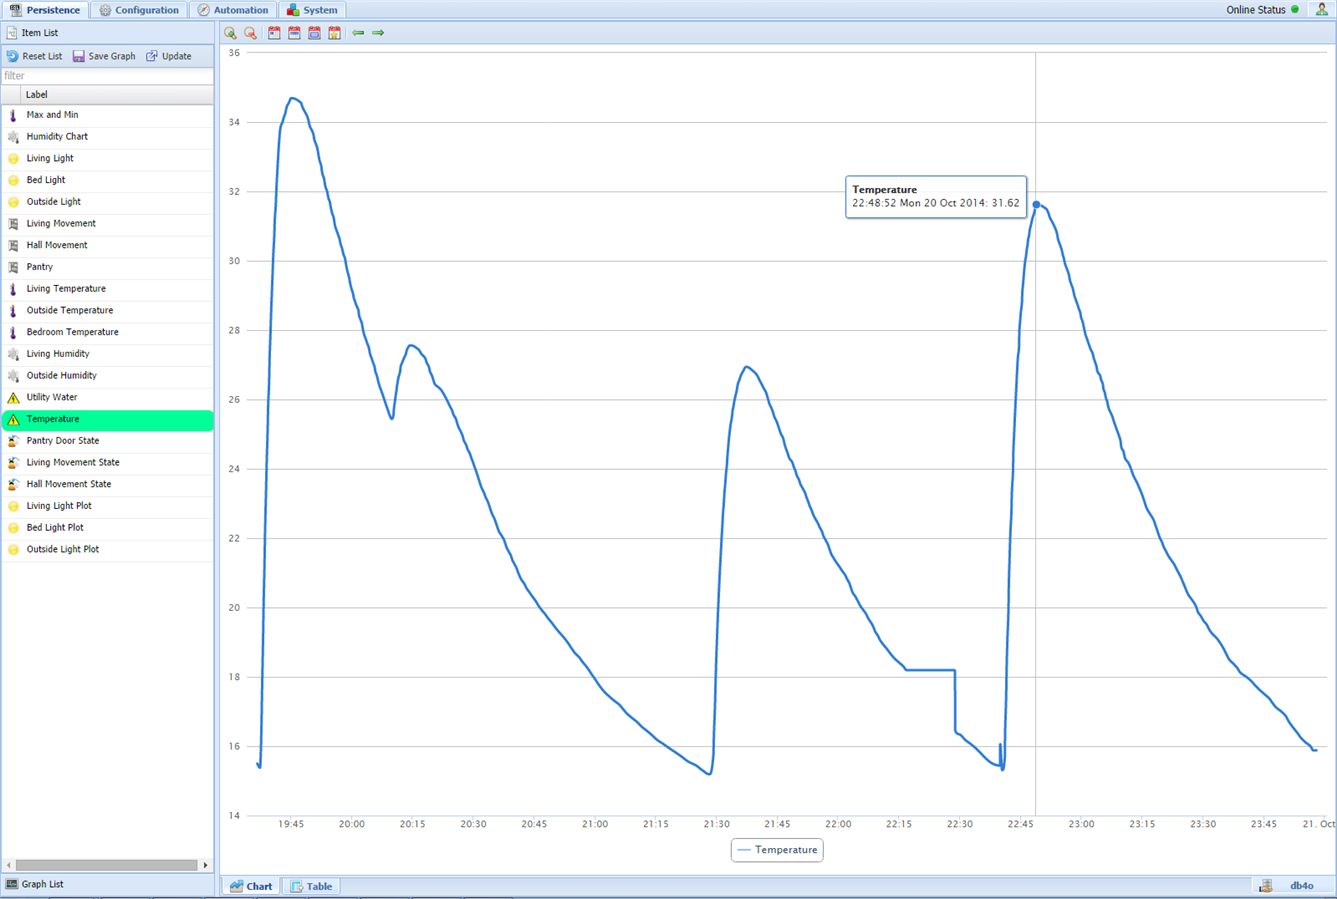
          Hot Water graph showing the various rises


You simply click and slide the mouse across the area you want to zoom into and it refreshes.

image


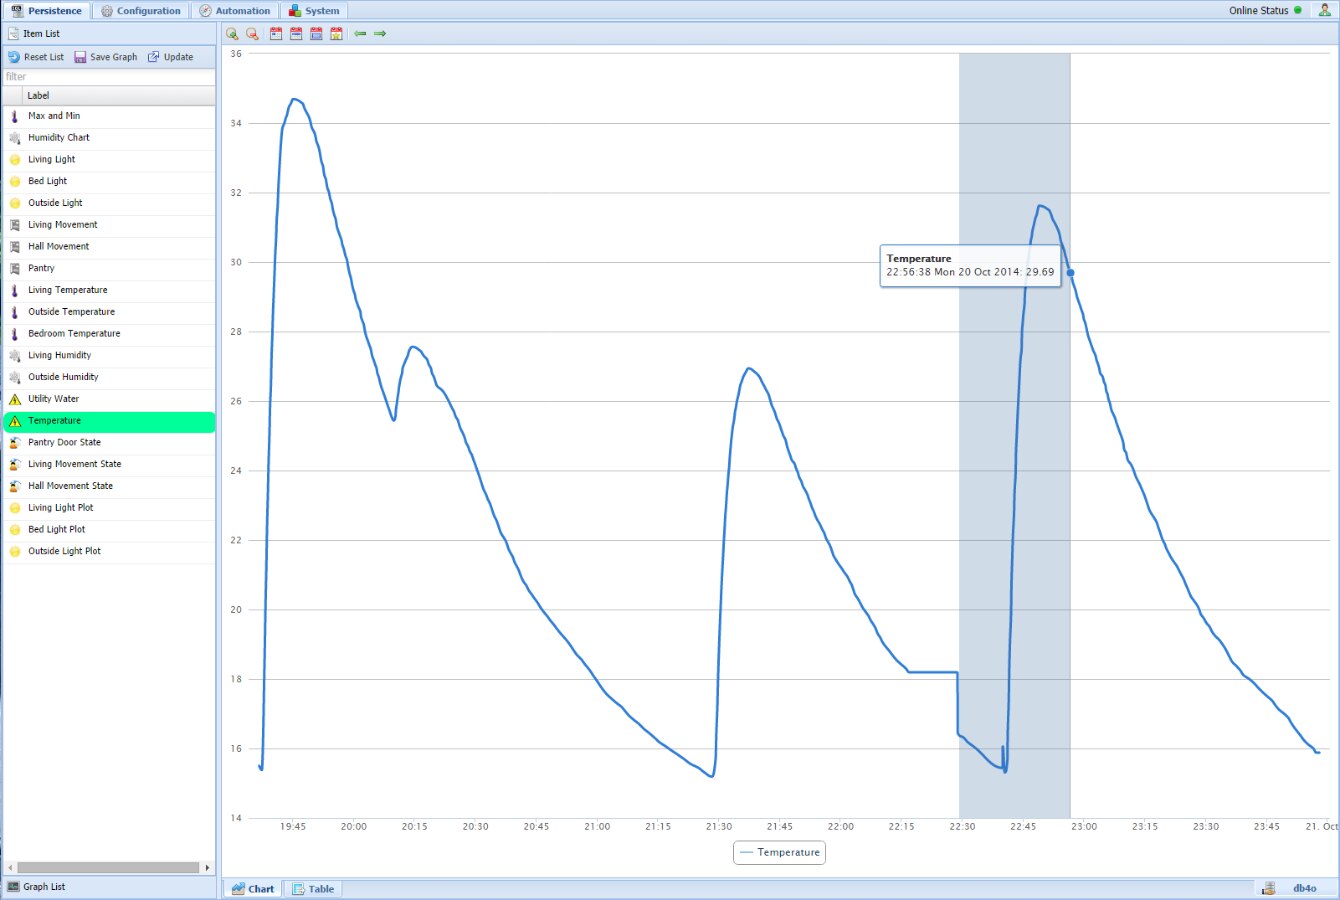
You can continue zooming as far as you want, it doesn't seem to matter, as long as the data is there.

image


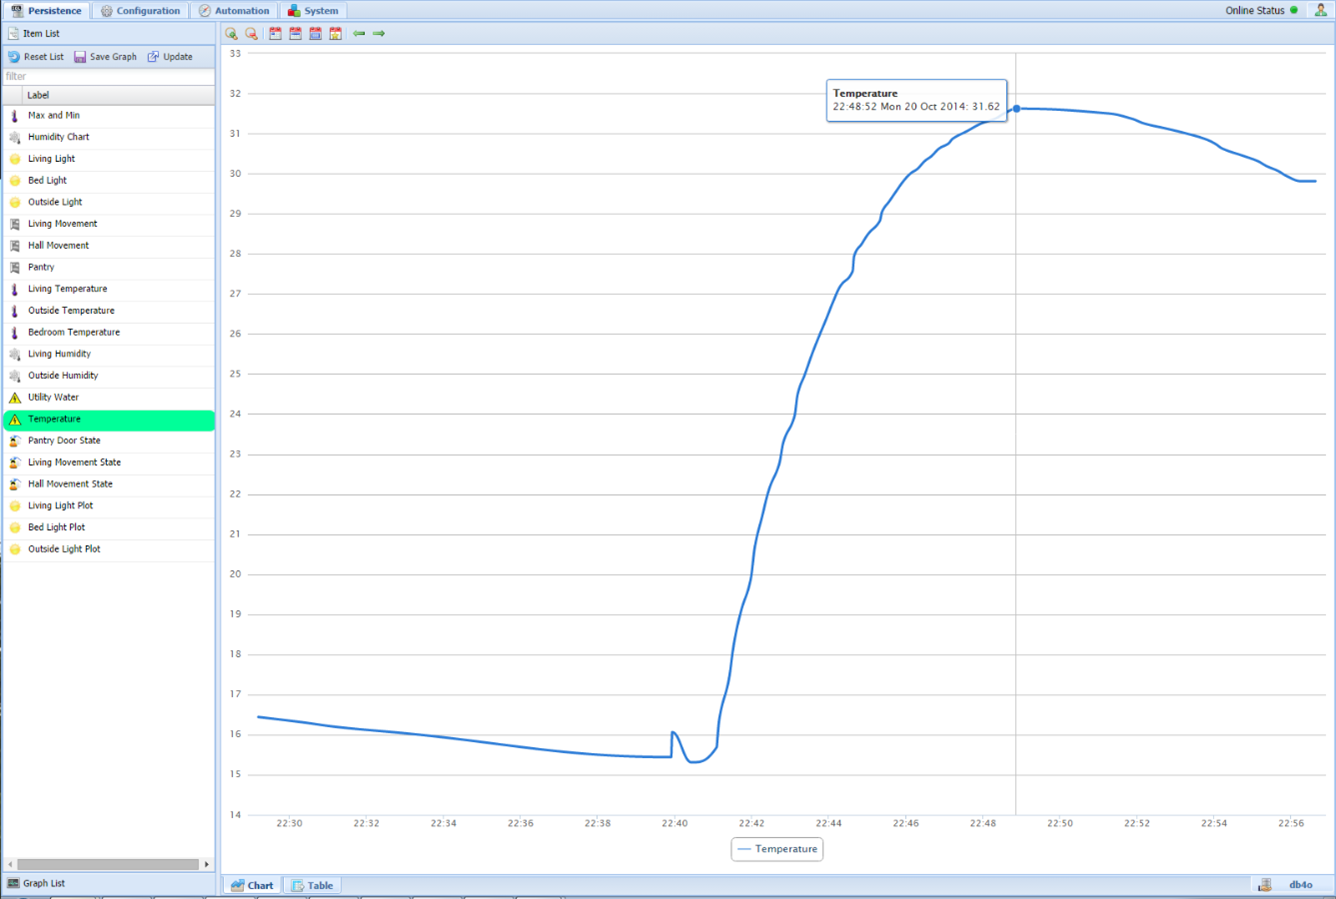
You can add other data sources and it will automatically adjust the range to suit (hence why I had to reduce the illumination graphs).

Once you update, you may need to zoom in again, but that's minor compared to the flexibility you get.


Saved Graphs

Once you have selected the sources for the graph, you can save and customise it.

image

In this one, I specified the colours, and the Max and Min setting, so it always stayed the same.


You can also specify the length of time (in this case 1 Hour), and once saved it simply pulls that data and assembles it for you.

image


The data is able to be zoomed, or shifted in time, while the colour and range you saved stays.... neat feature.


Once I have a more complete set of data (ie hasn't been changed, stopped and generally fiddled with), I can save a few graphs that will show the results consistently.


This one hasn't really ticked anything off my list, but it may help someone else at some point in time.

It has highlighted that the Hot Water temperature sketch needs adjusting.

Currently it will send if the temperature varies by 0.1 deg, and for this purpose that is too fine.


I really need to apply some logarithmic scaling, or incorporate time into the decision to send or not to send.

At the moment the RF isn't causing any issues, but it is consuming lots of RPi time.


Mark

  • Sign in to reply
  • mcb1
    mcb1 over 7 years ago in reply to Former Member

    If I recall it uses the db4o to gather the data, so ensure you include that in your persistance


    You also need to reboot the RPi to pick up changes.

    http://www.element14.com/community/community/design-challenges/forget-me-not/blog/2014/09/26/forget-me-not-eldermon-charts


    I'll dig out my rules, etc and add them but it will have to wait until I get back from work ...


    Mark

    • Cancel
    • Vote Up 0 Vote Down
    • Sign in to reply
    • More
    • Cancel
  • Former Member
    Former Member over 7 years ago

    Hello,

    I installed Habmin to visualize the chart but it did not extract data from my data base, it contains data stored from yesterday!

    it lists the items but no chart with a recent values as showed:

    image


    well Habmin gives me the possibility to see chart only for yesterday image

    not for today image


    What can I do to make it show me todays graphs?


    Thanks in advance for your help!

    • Cancel
    • Vote Up 0 Vote Down
    • Sign in to reply
    • More
    • Cancel
  • mcb1
    mcb1 over 8 years ago in reply to DAB

    No I haven't Don.

    EnOcean have some details regarding the amount of energy v frequency of updates for their sensors, and their software self adjusts to ensure it will keep running (as much as possible).


    My main issue with the Hot Water sensor is its not really adding anything useful, but is sending lots of messages every second (The sketch waits 1 second between issuing the measure command and getting the data from the DS18B20).


    It's useful to see the short bursts (I can see the handwashing as short bursts where it doesn't reach the full temperature).

    I could just send when it changes, and then send at the peak, and again after it settles, but the graph would look quite spiky/messy.

    I've contemplated a percentage based trap, but to be honest I haven't decided what I want.


    I'm concentrating on the other tasks, and noted that I need to fix it.

    I could also implement something in the receiver as well, but its better to not send out RF if its not adding anything useful.


    Mark

    • Cancel
    • Vote Up 0 Vote Down
    • Sign in to reply
    • More
    • Cancel
  • DAB
    DAB over 8 years ago

    Hi Mark


    Good update.


    Have you run a profile on how much time is consumed in communication verses the overall power draw?


    DAB

    • Cancel
    • Vote Up 0 Vote Down
    • Sign in to reply
    • More
    • Cancel
element14 Community

element14 is the first online community specifically for engineers. Connect with your peers and get expert answers to your questions.

  • Members
  • Learn
  • Technologies
  • Challenges & Projects
  • Products
  • Store
  • About Us
  • Feedback & Support
  • FAQs
  • Terms of Use
  • Privacy Policy
  • Legal and Copyright Notices
  • Sitemap
  • Cookies

An Avnet Company © 2023 Premier Farnell Limited. All Rights Reserved.

Premier Farnell Ltd, registered in England and Wales (no 00876412), registered office: Farnell House, Forge Lane, Leeds LS12 2NE.

ICP 备案号 10220084.

Follow element14

  • Facebook
  • Twitter
  • linkedin
  • YouTube