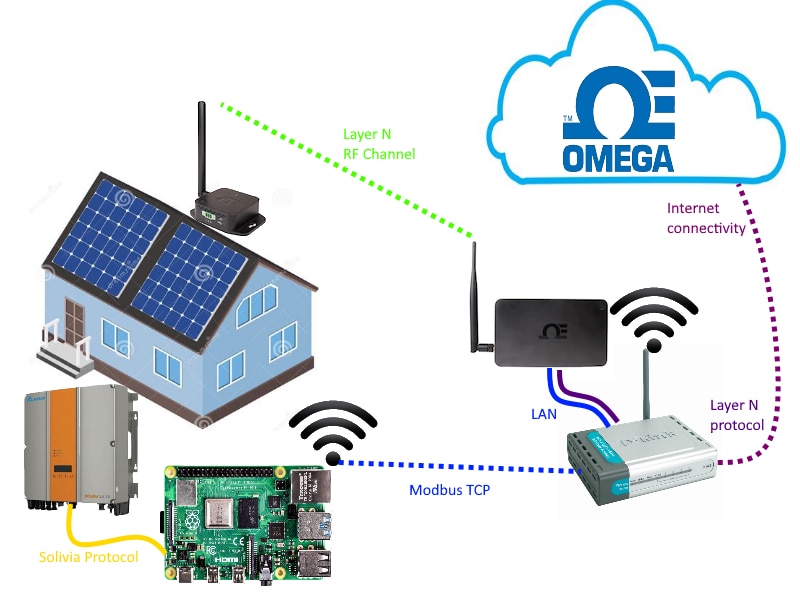
1. System diagram
Just a quick review of the system components
2. Omega Smart Sensor
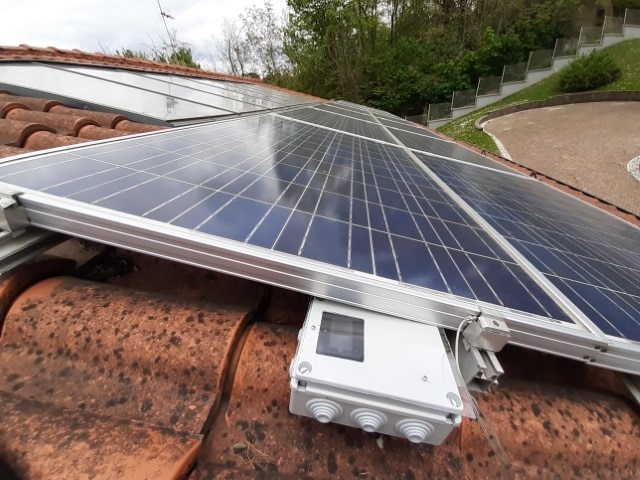
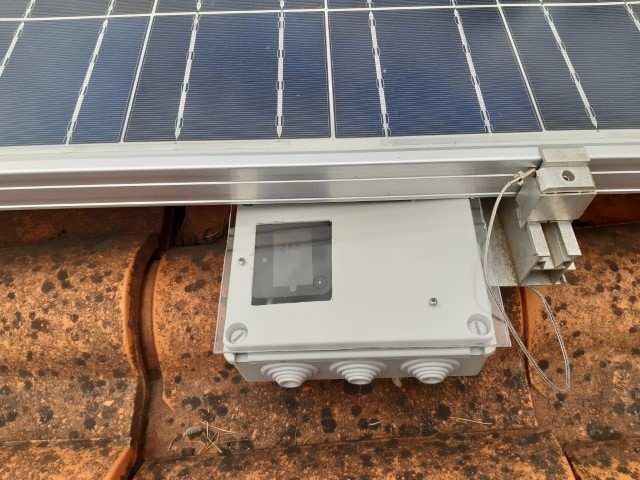
The Omega Smart Sensor installation has been installed on the roof, close to the PV panels. This for two reasons
- measure the actual irradiance the PV panels see, thus excluding errors due to orientation and shadows from trees and houses
- measure the PV panels surface temperature, which may be an interesting feature to evaluate when I will implement the anomaly detection algorithm. For this purpose, I connected a K-type thermocouple
The Smart sensor has been installed inside a water-proof ABS box with a transparent cover
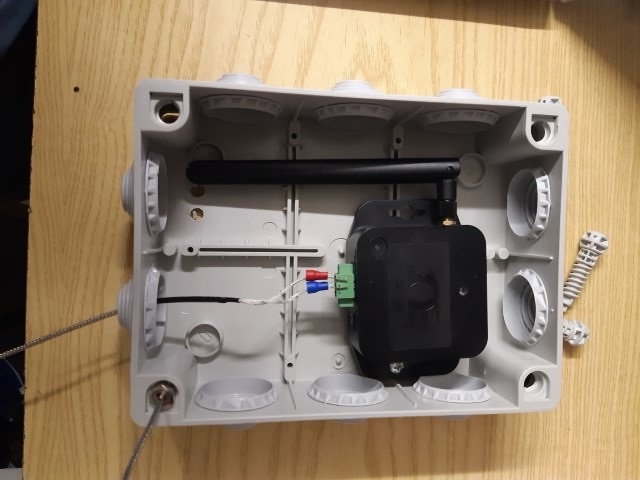
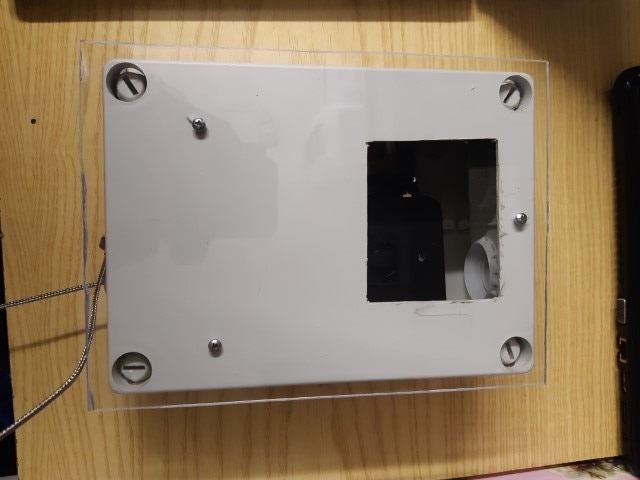
Here are some pictures of the Smart Sensor installed on the roof
3. Protocol converter
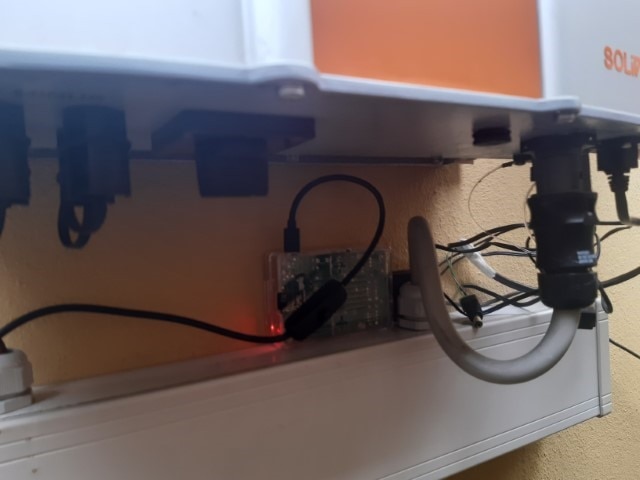
The Raspberry Pi that runs the protocol converter Python application has been installed just below the inverter
4. Preliminary data
The PVMonitor has been pushing data to the cloud for a couple of days, and I have some screenshots to show
Data can be accessed from any device at the URL
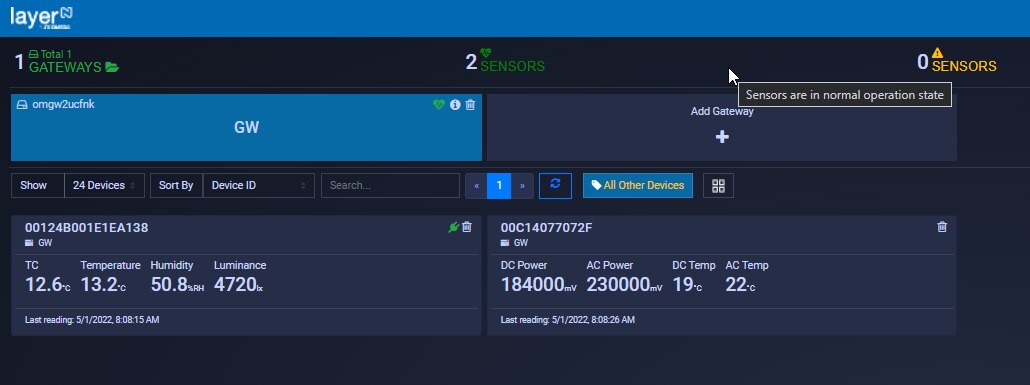
The main page of the portal shows the configured gateway. When a gateway is selected, the related sensors with the latest available readings are shown. In this case, I have
- on the left, the Omega Smart Sensor with the following values
- Temperature as reported by the external TC (12.6 °C)
- Temperature as reported by the internal sensor (13.2 °C)
- Relative humidity (50.8%)
- Luminance (4720 lux)
- on the right, the data coming from the protocol converter, namely
- DC power (1840000 mW - in the screenshot, you read mV because there are no options for power-related measures)
- AC power (230000 mW - looks like I have an inverter with efficiency greater than 1
)
- DC Temp (19 *C - temperature of the DC NTC sensor inside the inverter)
- AC Temp (22 *C - temperature of the AC NTC sensor inside the inverter)
By clicking a sensor, you can see charts with realtime data, or data collected today, in the current week or for a custom period of time

For each sensor, there is "Settings" tab where alarms can be enabled

For each sensor values, you can choose to raise an alarm when values is above or below a threshold or outside a certain range. The alarms will be shown in the "Alarm&Events" tab
In the "Historian" section, charts with values from multiple sensors can be shown. A chart shows values belonging to a certain category (for example, all temperature readings from all the selected sensors are shown in a single chart). For example, these are the charts with data collected by both Omega Smart Sensor and protocol converter
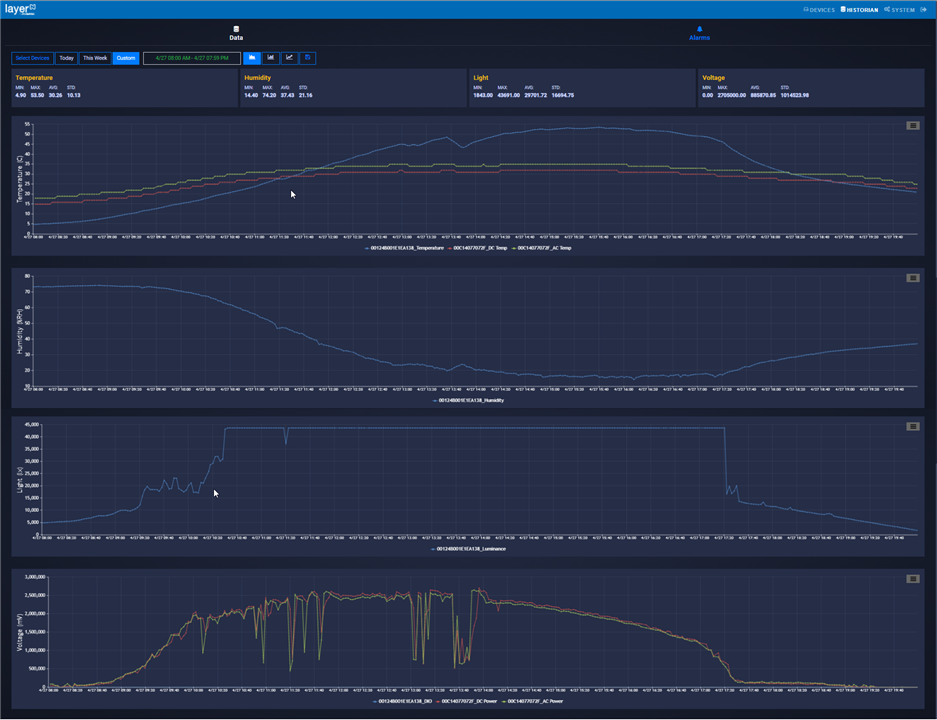
From top to bottom, we see
- Temperatures reported by
- Smart Sensor internal temperature sensor
- Inverter DC temperature reported by protocol converter
- Inverter AC temperature reported by protocol converter
- Humidity
- Luminance
- Generated power
- DC power (in red)
- AC power (in yellow)
The "Historian" section also has a "Plot prediction" feature, that shows a trend line based on displayed data. As far as I can understand, the line tries to fit data using the "least squares" method

Starting from this preliminary, I see of couple of issues that I need to correct
- The luminance saturates at about 44.000 lux when in full sunlight (the charts refer to a very clear day) with default settings (GAIN=6X, resolution=18 bits). In SYNC, I tried to change those settings but was unable to find a combination that gives me reliable luminance readings when in full sunlight. I simply went trough a test-and-evaluate process because I was unable to find any documentation about this parameters on the SYNC user manual. In particular
- with GAIN 1X and 3X, the readings seem to have a sort of overflow: values above 65535 roll back to 0
- with GAIN 9X and 16X, the readings saturate at lower levels (about 16.000 lux for GAIN 16X)
- the solution was to place a darkening film in front of the light sensor
- The external K-type thermocouple has some issues and needs to be fixed/placed in a different position
<< Prev: The great pretender (2)
Next: Anomaly detection (1) >>
