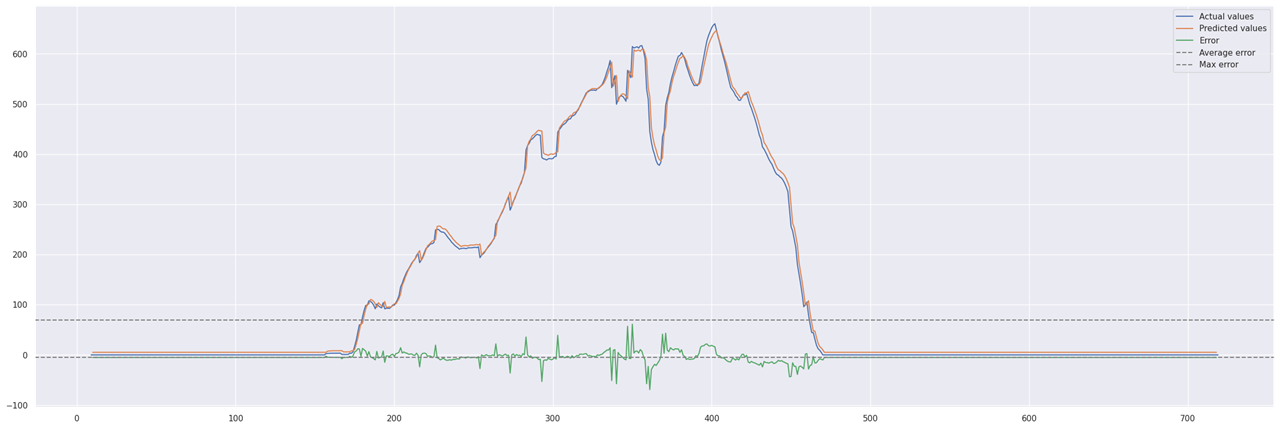
This is the second part of the anomaly detection implementation. In the first part, I explained how I gathered data from the Omega Cloud N servers and analyzed data to create a prediction model for the daily yield
In this part, I will explain how I am going to run the prediction model every day in order to promptly report any abnormal condition detected by the model
1. The prediction model
According to my experiments, two approaches look valid to make a prediction of the expected daily yield
- the first model is based tries to fit the input variables (luminance and temperature) with the output variables (DC power) with a curve that minimizes the squared error. This approach predicts wring values when production is low due to weather conditions (i.e. cloudy days)
- the second model is based on LSTM neural network and tries to predict power production based on previous data considered as a time series. This model works good in almost all the weather conditions but has an obvious dependency on seasons which can be mitigated by training the model with data collected over a period of at least 6 months
For the moment, I will focus on the LSTM model because looks more promising
The steps the run the prediction model are
1.1 Load data
Data for the current day. I will use the same REST APIs I described in my previous post
1.2 Load model parameters
During the data analysis phase, model parameters have been dumped to my Google Drive, so I can reload it quite easily
# load model
from google.colab import drive
drive.mount('/content/drive')

import shutil
shutil.copy('drive/MyDrive/lstm_model.h5','.')

import tensorflow as tf
model = tf.keras.models.load_model('lstm_model.h5')
1.3 Make predicition
To make the prediction, we need to extract data from the Pandas dataframe where I stored data collected from Omega Cloud N server.
# get DC_POWER_SMA data
dataframe= pdata_sma["DC_POWER_SMA"]
dataset = dataframe.values
dataset = dataset.astype('float32')
dataset= dataset.reshape(-1, 1)
# normalize the dataset
scaler = MinMaxScaler(feature_range=(0, 1))
dataset = scaler.fit_transform(dataset)
# make prediction
prediction = model.predict(dataX)

prediction = scaler.inverse_transform(prediction)

MEAN_THRESHOLD = 1.0

if (abs(mean) > MEAN_THRESHOLD):
  sendNotification


import smtplib

def sendNotification():
  # creates SMTP session
  s = smtplib.SMTP('smtp.gmail.com', 587)

  # start TLS for security
  s.starttls()

  # Authentication
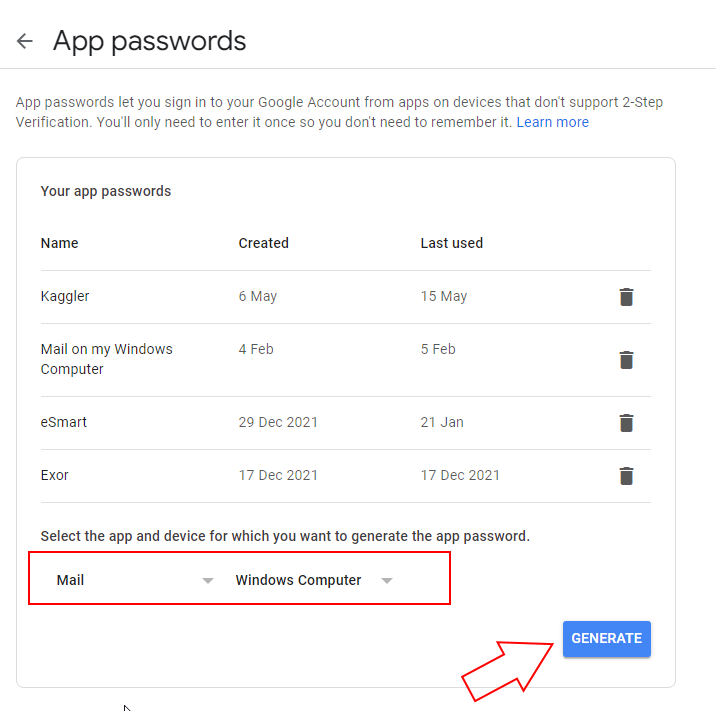
  s.login("xxx at gmail.com", "yourapplicationkey")

  # message to be sent
  message = "An anomaly has been detected on your PV plant"

  # sending the mail
  s.sendmail("sender at anymail.com", "receiver at anymail.com", message)

  # terminating the session
  s.quit()
.
2. The scheduler
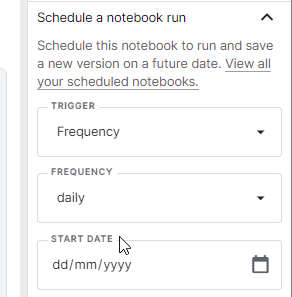
After many attempts to schedule a daily execution of the anomaly detection Python notebook, I finally moved the notebook itself to Kraggle, which provides a convenient scheduler

Now the anomaly detection algorithm will be executed every day and I will receive an email when daily power production is below the value predicted by the model
The source code of the Python notebook for anomaly detection is available on my github
