


Data has been collected for about one week and stored on the Omega Cloud N servers.
It's now time to think about the anomaly detection algorithm. The idea is to leverage the unlimited possibilities of a platform like Tensorflow to
- validate collected data
- devise and validate a prediction algorithm
- periodically, apply the prediction algorithm and check whether the most recent data is compatible with what the model has predicted. In case of discrepancy, it is likely that the PV plant is experiencing an abnormal condition
1. Data collection
In order to be validated, data must be moved from Omega Cloud N servers to Google Colab environment. Omega does not provide any documentation about an open API to access data, but, with a browser and a little bit of reverse engineering, it is simple to understand the proper queries to ask the Omega Cloud N platform for data
1.1 Login
The first thing is to authenticate on the Omega Cloud N server. Open the Omega Cloud N login page, open the "Developer tools" pane (typically this can be done by simply pressing F12), fill the fields with you credentials and click "Login". You will see the that a HTTP POST request is set to the following URL
https://omegadeviceportalapi-testing.azurewebsites.net/user/login
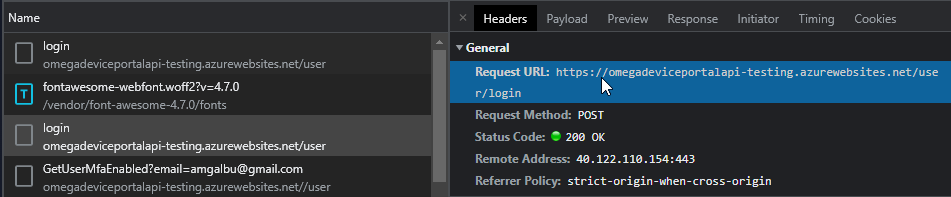
The payload of the request includes username and password

The response has the following format

{
"Result": 0,
"Value": "eyJhbGciOiJIUzI1NiIsInR5cCI6IkpXVCJ9.eyJ1bmlxdWVfbmFtZSI6ImFtZ2FsYnVAZ21haWwuY29tIiwicm9sZSI6IiIsIm5iZiI6MTY1Mjk4MDg3NywiZXhwIjoxNjg0NTE2ODc3LCJpYXQiOjE2NTI5ODA4NzcsImlzcyI6Im9tZWdhIn0.uOSUMvEY7fhhsinPVQNfVjtkI694_5dkRjuuzdibSLI",
"Attempt": 0
}
We need to store the value of the "Value" field: this is the authentication token that needs to be included in all subsequent requests
1.2 Getting the data
By means of the browser's "Developer tools" it is quite simple to discover all the URLs to be invoked to implement all the features supported by the Omega Cloud N portal. Here, I am interested in getting all the data in a given period of time.
Navigate to the "Historian" session, select a device, click "Custom" and enter any period of time. Finally click the plot icon

In the "Developer tools" you will see a HTTP GET request to the following URL
We can extrapolate the following pattern
where
- gatewayID is the ID of the gateway (see screenshot below)
- deviceID is the ID of any of the configured device (see screenshot below)
- from is the UTC start date and time in ISO8601 format
- to is the UTC end date and time in ISO8601 format

In the HTTP headers, you need to had an "Authorization" key and set the value to a string given by "Bearer" concatenated with the value returned during the login process

The response is a JSON document as shown in screenshot below

The response includes a "Value" array, whose elements are objects with the following fields
- BaseTime: timestamp of the sample, expressed in milliseconds since epoch (1/1/1970)
- Values: a string of comma-separated values. The order of the values in the string depends on the sensor configuration and, for sure, there is any REST API that can return the information of each single value. At this moment in time, I am not interested in creating a fully-automated data exporting tool, so I will assume the order of the values is known
Note that, for extended period of time, not all the available values are returned in order not to overload the client with an excessive amount of data. According to my tests, a maximum of 500 values are returned. Samples are selected by the Omega Cloud N platform so that timestamp are uniformly spread across the desired timespan. For this reason, I will query for values on a limited period of time, in order to be certain that all available data is actually returned
Exported data is then saved to a CSV file for data validation and further processing
2. Data validation
The final dataset has the following columns
- TC: ambient temperature as reported by the Omega Smart Sensor internal sensor
- TEMPERATURE: module temperature as reported by the external thermocouple (yes, labels are not correct...)
- HUMIDITY: humidity as reported by the Omega Smart Sensor internal sensor
- LUMINANCE: luminance with overflow correction
- DC_POWER: solar inverter DC power
- AC_POWER: solar inverter AC power
- DC_TEMP: solar inverter DC section temperature
- AC_TEMP: solar inverter AC section temperature
- LUMINANCE_UNCORRR: raw luminance values (before overflow correction)

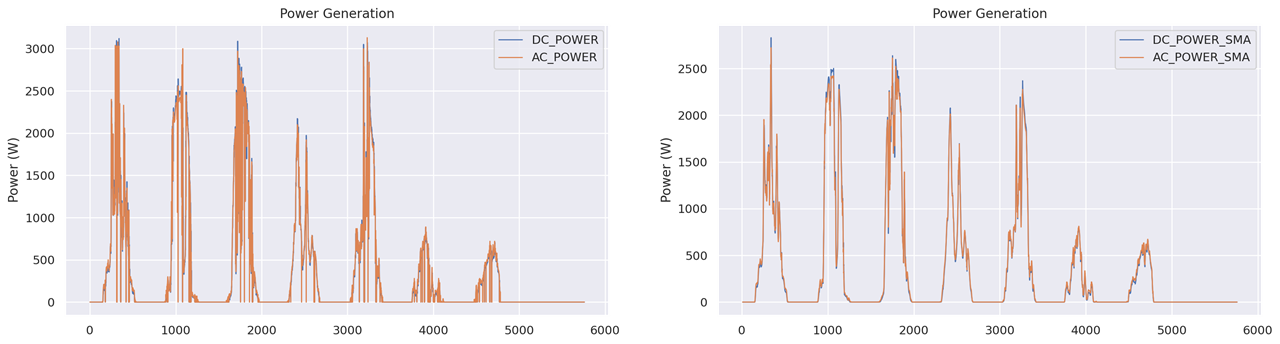
The plot of AC_POWER and DC_POWER looks not so good: inverter sometime reports values at 0 (still can't understand if I parse responses in the wrong way or this is something related to MPTT or other inverter's internal application logic)

While I try to work out this issue, I will apply a moving average filter to smooth out the effect of incorrect values. I added some more columns to the dataset (with the suffix_SMA) with the averaged data
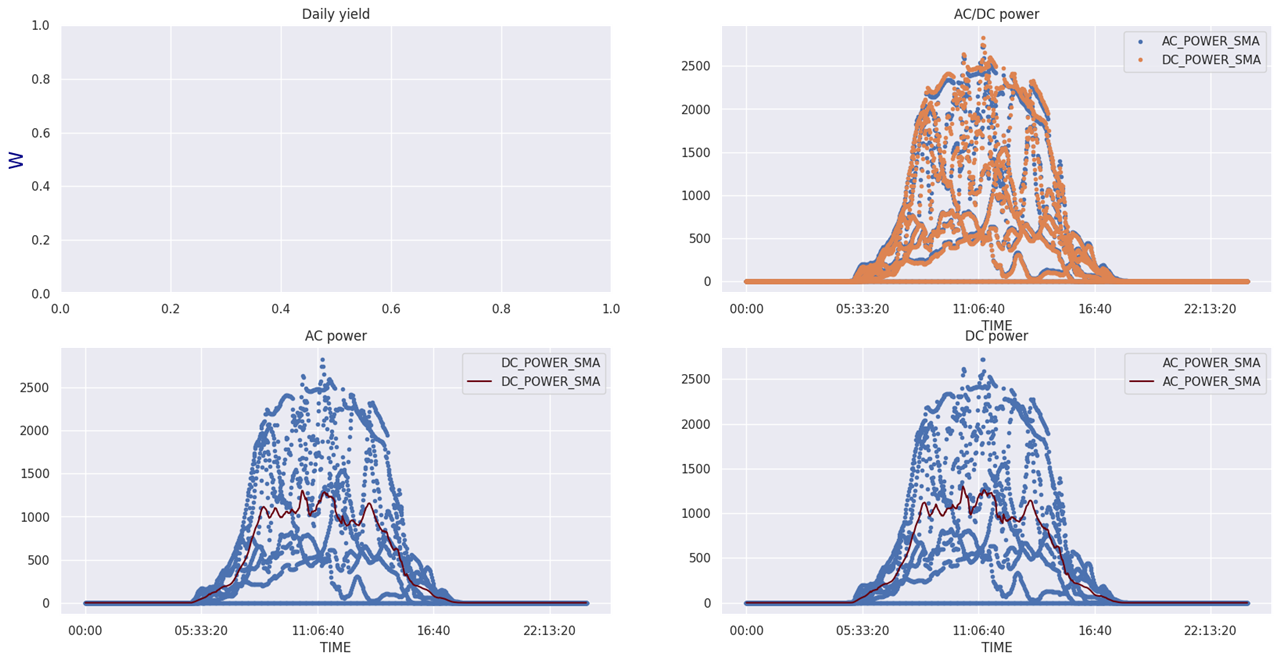
Another interesting chart id the scatter graphs with the values for AC and DC power (daily yield data is not available yet)
I created some other nice plots, but the most interesting part now is the find correlations between sensors data and power production. These are some of the regression plots

There is a clear correlation between power production and temperature and luminance, as confirmed by the correlation graph

3. The prediction model
The measures that shows the best correlation with power production are luminance (LUMINANCE_SMA) and module temperature (TEMPERATURE_SMA).
3.1 Linear regression models
The first try was to create a with a simple linear regression algorithm. Four models have been created, which take different input
- module temperature
- ambient temperature
- luminance
- module temperature + luminance
In the last model, I tried to correct the module temperature with a factor that takes into account to luminance. In particular, the correction goes with the logarithm of the luminance value. Here is the code that tries to fit the curve using the scipy's curve_fit function
from scipy.optimize import curve_fit

def func(X, a, b, c, d):
    '''Non-linear function to correct module temperature with luminance'''
    temp,lum = X
    return (a*(temp+(c*np.log10(lum) + d))+b)

# fit data
p0 = [1.,0.,-1.e4,-1.e-1]
popt, pcov = curve_fit(func, (df_train.LUMINANCE_SMA, df_train.TEMPERATURE_SMA), df_train.DC_POWER_SMA, p0, maxfev=5000)

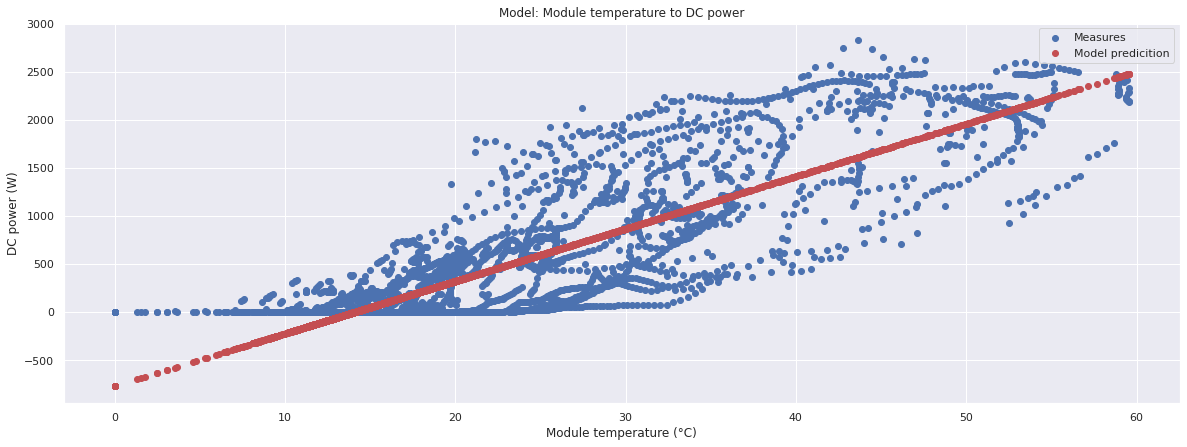


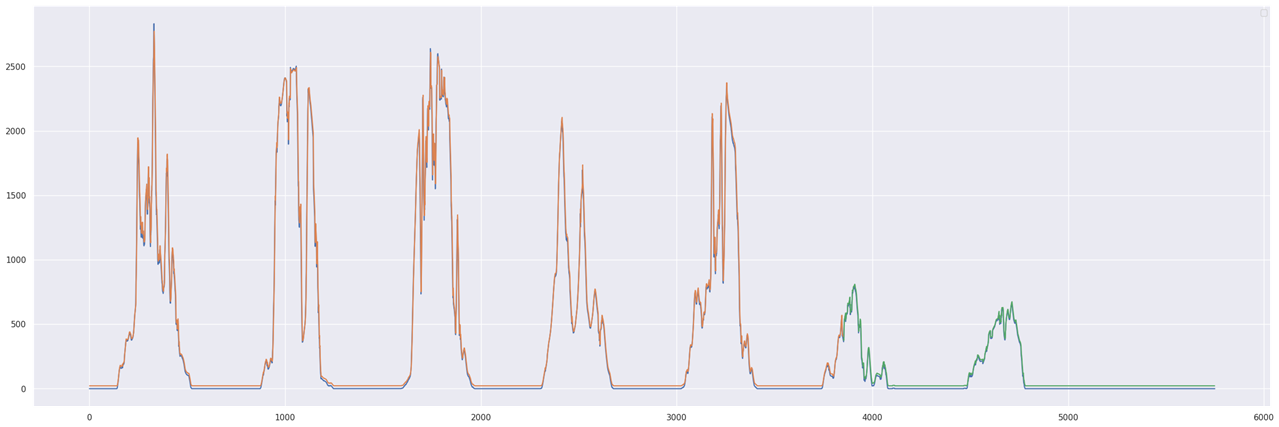
In the following plot, the error of the value predicted by the model versus the actual power production value is shown


Models based on temperature are very inaccurate in cloudy days. The other two models look very promising, but let's see you we can do better with a neural network
3.2 LSTM model
LSTM stands for Long Short-Term Memory.
LSTM networks are well-suited to classifying, processing and making predictions based on time series data, since there can be lags of unknown duration between important events in a time series. A common LSTM unit is composed of a cell, an input gate, an output gate and a forget gate. The cell remembers values over arbitrary time intervals and the three gates regulate the flow of information into and out of the cell.
LSTMs were developed to deal with the vanishing gradient problem that can be encountered when training traditional RNNs. The problem with vanilla RNNs is computational (or practical) in nature: when training a vanilla RNN using back-propagation, the long-term gradients which are back-propagated can "vanish" (that is, they can tend to zero) or "explode" (that is, they can tend to infinity), because of the computations involved in the process, which use finite-precision numbers. RNNs using LSTM units partially solve the vanishing gradient problem, because LSTM units allow gradients to also flow unchanged.
keras includes all the functions required to create an LSTM neural network
# create and fit the LSTM network
model = Sequential()
model.add(LSTM(4, input_shape=(1, look_back)))
model.add(Dense(1))
model.compile(loss='mean_squared_error', optimizer='adam')
model.fit(trainX, trainY, epochs=10, batch_size=1, verbose=2)
model.summary()
3.3 Saving the model
I saved model parameters on my Google Drive space.
from google.colab import drive
drive.mount('/content/drive')

# save model parameters
model.save('lstm_model.h5')

import shutil
shutil.copy('lstm_model.h5','drive/MyDrive')
4. Notebook
All the graphs in this post has been generated using the Python notebook available on the github repository of this project. Sample data is available as well
<< Prev: Installation and preliminary data
Next: System perfomances >>
Top Comments