Node-Red Dashboard - Final Configuration
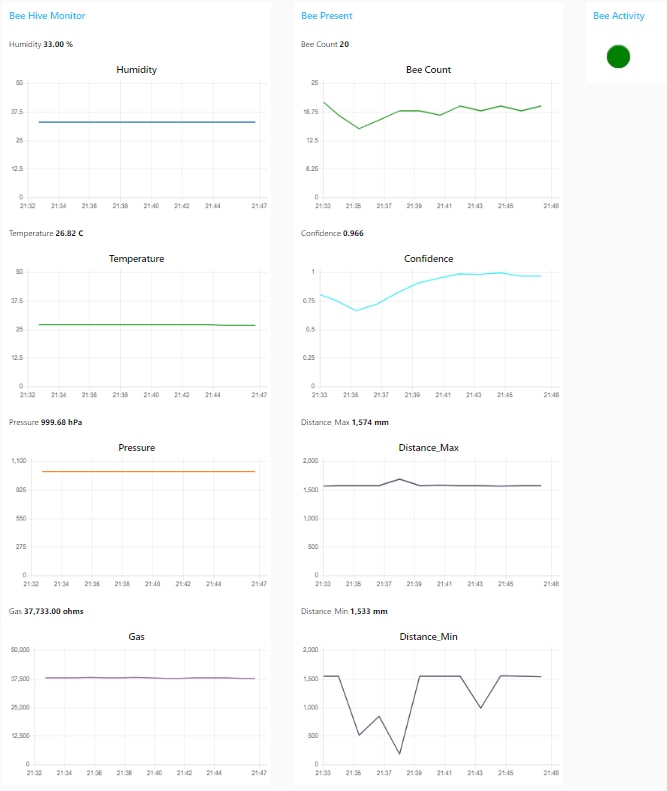
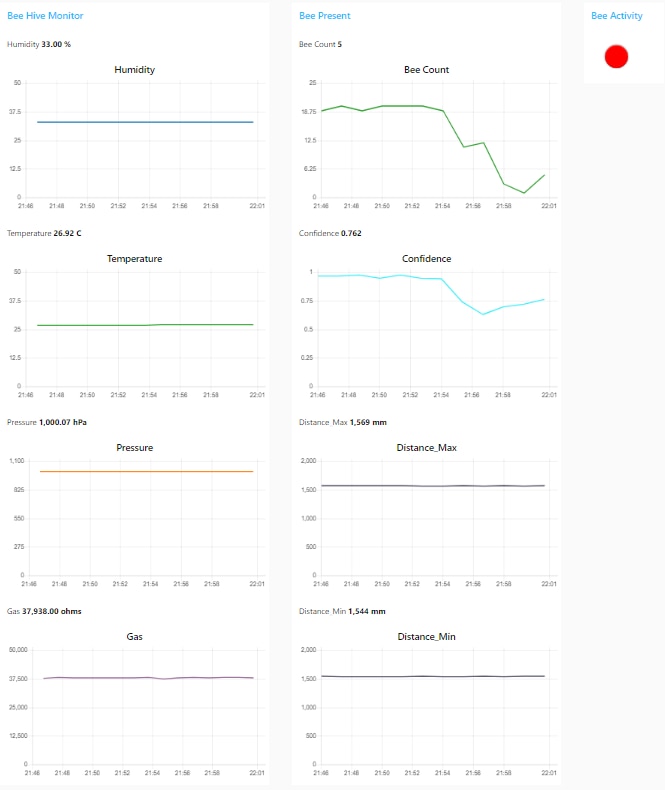
I changed the way that I display the inference data. First, I had to reduce the upload frequency to once every 80 seconds because the reduced RSSI due to the gateway distance to the deployed sensors was causing failures. The way the inference loop is set up, I get an inference about every 4 seconds with my 2 second sample window. That means that every upload cycle has about 20 inferences. I count the number of bees classified and plot that along with the average confidence of the bee classification. It is somewhat arbitrary, but I turn the Bee Actvity LED Green if the count is over 10 and Red otherwise.
I also plot the min and max distance measured in the cycle (this data does not sync with the inference data). The hope is that I can pick up movement - not sure how well this works with small objects like bees.


Here's a video of the dashboard, but since it's like watching paint dry - I sped it up 20x, so there's only 4 seconds between points.
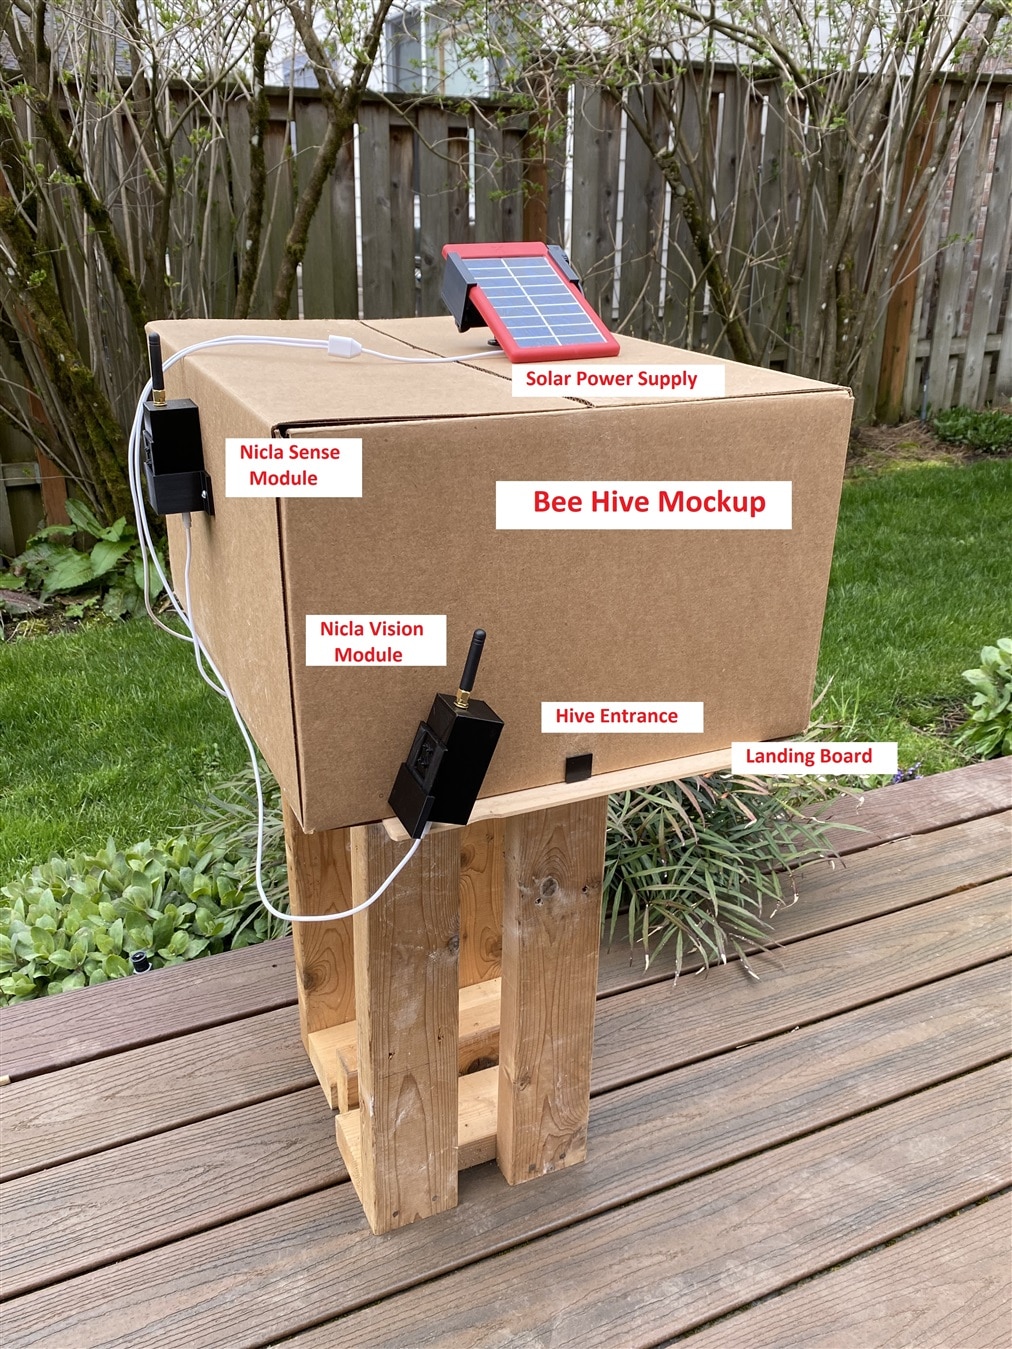
Beehive Mockup
I don't currently have a real bee hive (though there might be one in the future - certainly there will be a Bee Hotel ). The audio ML model that I built is based on honeybee hive data, so I wanted to deploy a mockup of how I might mount the Bee Healthy components on a real hive.
- Solar Power Supply - mount either on top of hive or on a side post. Split USB cable allows using only a single power bank for both modules
- Nicla Sense Module - mounts on sidewall with cutout for sensors to sample hive environment
- Nicla Vision Module - microphone and proximity sensor point at hive entrance to detect bee activity

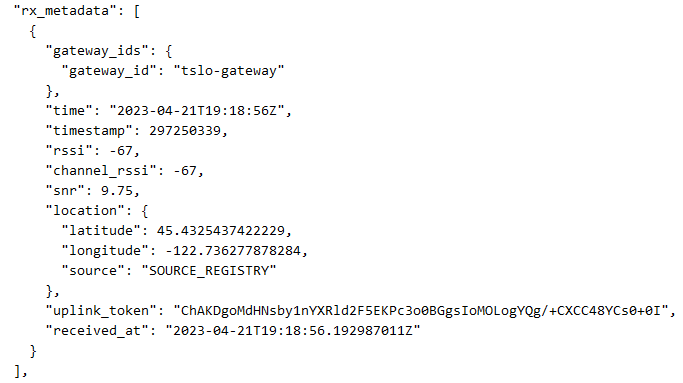
Reduced RSSI from Sensors
Now that the sensors are in the backyard which is about 5x distance further than my original test setup - the RSSI has dropped about 30dBm. I needed to increase the upload interval by about 33% to prevent upload failures.

Summary
The Save the Bees Design Challenge has been a very enjoyable and enlightening experience for me. I was able to work on more complex audio ML models and encountered the processing limitations of the Edge Impulse free tier of resources. I am looking forward to trying out the new Nicla Voice board with its advanced audio capability to see how it compares with the Nicla Vision for audio processing.
And I was reminded of the limitations of pushing data to the cloud using LoRaWan. I would have liked to have done more sensor fusion by correlating image, audio, and environment data. Something that I need to learn to do better.
I accomplished most of what I wanted to do in this challenge:
Developed and deployed an ML bee hive audio model
- Model was developed using a research dataset that I obtained from a professor,Vladimir Kulyukin, at Utah State University
- The Deployed Model was tested using YouTube audio from videos by Frederick Dunn who does a series on Backyard Beekeeping
- Model development and testing were done using Edge Impulse Studio
- Model was deployed as precomplied binaries for testing and as Arduino libraries that were integrated into hive monitoring programs
Built 2 sensor modules using the Nicla Sense, Nicla Vision, and MKRWAN 1310s
- Nicla Sense module is reporting the hive environmental conditions (temperature, humity, pressure, gas)
- Nicla Vision module is monitoring bee activity using the Audio ML model and the proximity sensor
- Both modules use I2C to communicate between sensor boards and LoRa boards
- LoRa boards are communicating with the Things Dashboard via a local Things Gateway
Built a Solar Power Supply to power the modules
- Uses a 2200mAh USB Power Bank to interface the 5.5VDC @ 360mA Solar Panel
- Uses a split USB-A to 2 microUSB connectors to supply power to the modules
Created a Save the Bees application on my Things Dashboard
- Receives data from each module separately from the Things Gateway
- Upload frequency was lowered to once per 80 seconds due to reduced RSSI when deployed (-65 to -70 dBm)
- Each device has a specific payload decoder
- Application uses MQTT automation to interface with a downstream Node-Red Dashboard
Created a Node-Red Dashboard to display bee hive environment and activity data
- Node-Red and an associated MQTT server are running on an RPi4 on my LAN
- Currently, I don't send downlink messages
Built a Honeybee Hive Mockup
- Demonstrates placement of project components
- Would allow emulation of hive monitoring, but I did not try to change the environment or simulate activity - just verified deployed operation
Challenge Takeaways
I think the biggest surprise for me was to see how much work has already been done to "Save the Bees". As I searched the internet for bee hive audio datasets, I came across many organizations and universities working to deploy electronics and AI to restore and protect the world's bees. It has inspired me to learn more about bees and I've taken a course about native bees and I am enrolled in a backyard honeybee hive course at the community college next month.
My only regret about the challenge is not being able to develop and test the project on an actual bee hive. Who knows, that opportunity may present itself in the future and I might be able to develop models based on my own data. In the meantime, I look forward to getting the Bee Hotel participation prize and putting it out in the backyard this summer .
I am also working on my subset of thebeeconservancy.org/10-ways-to-save-the-bees list.
- Plant a Bee Garden (native plants that support and attract bees)
- Go Chemical-Free for Bees (no pesticides or herbicides)
- Create a native bee nesting box (Bee Hotel)
- Become a Community Scientist (join “A Bee Or Not a Bee” iNaturalist project)
- Support Local Beekeepers and Organizations
Thanks to E14, Premier Farnell, and Arduino for the challenge kit hardware and the opportunity to participate in another great design challenge.
Challenge Blogs
Bee Healthy - Blog 1: Project Proposal
Bee Healthy - Blog 2: Hardware Development - Solar Power Supply
Bee Healthy - Blog 3: The Things Stack Setup
Bee Healthy - Blog 4: Audio Dataset
Bee Healthy - Blog 5: Edge Impulse Model
Bee Healthy - Blog 6: Hardware Development - LoRa Module
Bee Healthy - Blog 7: Edge Impulse Live Classification
Bee Healthy - Blog 8: Edge Impulse Model Deployment
Bee Healthy - Blog 9: Audio Inferencing with Nicla Vision
Bee Healthy - Blog 10: I2C Communication between Nicla Vision and MKR WAN 1310
Bee Healthy - Blog 11: Using Two LoRa Modules
Bee Healthy - Blog 12: Node-Red Dashboard
Bee Healthy - Blog 13: Save the Bees Design Challenge Summary
Extra Content
Backyard Beekeeping: Back to School
