


As part of the element14 Smart Home & Healthcare Challenge, I am developing VitalSense Desktop R&D Workbench, an experimental PC-based platform for physiological data acquisition, visualization, and analysis.
The project is built around two evaluation platforms from Analog Devices:
-
MAX30208EVSYS — a temperature-sensing evaluation system based on the MAX30208 digital temperature sensor, specified for ±0.1°C accuracy over the 30°C to 50°C range under the manufacturer's specified conditions.
-
MAXREFDES117 — an optical heart-rate and pulse-oximetry reference design based on the MAX30102 sensor, which uses red and infrared LEDs to acquire photoplethysmography (PPG) signals for heart-rate and SpO₂ estimation.
The primary objective is to integrate both evaluation platforms into a desktop research workstation using two independent USB-connected interfaces. The software is designed to provide a unified environment for sensor communication, real-time waveform visualization, data logging, digital signal processing, and experimental evaluation of physiological monitoring algorithms.
The software component focuses on developing diagnostic and analysis tools using C++ and Qt, with National Instruments LabVIEW serving as a potential complementary environment for measurement and algorithm verification. The intended architecture supports independent communication channels, structured data acquisition, and the recording of experimental results for subsequent analysis.
A key aspect of the project is the investigation of the complete measurement chain, from sensor data acquisition to software-based processing and visualization. This includes evaluating communication reliability, signal quality, measurement repeatability, and the limitations of the selected sensing platforms.
VitalSense is an experimental R&D platform rather than a clinically validated medical device. The accuracy specifications of individual sensors do not, by themselves, establish the accuracy of the complete measurement system. Heart-rate and SpO₂ estimation algorithms, as well as the overall temperature measurement chain, require appropriate testing and validation.
The resulting workstation is intended to provide a flexible foundation for embedded sensor development, physiological signal research, and the evaluation of measurement techniques. Portable implementations and alternative embedded platforms are outside the scope of this article and will be presented separately.
Throughout the research and system development process, the work, findings, and observations have been organized into functionally separate sections to maintain clarity and readability. You can navigate to each of the 13 parts via the linked table of contents provided below:
Part 1: System Concept and Architecture
Part 2 : Sponsored Kit Overview
Part 3 : Alternatives for Heart Rate, SpO₂, and Temperature Sensing
Part 4 : MAX30208EVSYS Evaluation System – Technical Overview & Operation
Part 5 : Reverse-Engineering the MAX30208EVSYS Communication Protocol
Part 6 : Communicating with the MAX30208EVSYS in LabVIEW
Part 7 : Building a Cross-Platform Qt6 Desktop Application for the MAX30208EVSYS Temperature Sensor
Part 8 : STM32 Pulse Oximeter & Heart Rate Monitor (MAXREFDES117 + USB CDC)
Part 9 : MAXREFDES117 – JSON Data Acquisition via USB-CDC in LabVIEW
Part 10 : Building a Real-Time Sensor Data Visualizer for MAXREFDES117 / USB CDC
Part 11 : Research Workstation System Architecture
Part 12 : Combined Pulse Oximeter & Temperature Monitoring System in LabVIEW
Part 13 : Dual-Port Biomedical Telemetry Dashboard - Integrating STM32 (MAXREFDES117) and MAX30208EVSYS in C++ and Qt
1. Main Architecture - Diagnostic Station (PC + C++/Qt / LabVIEW)
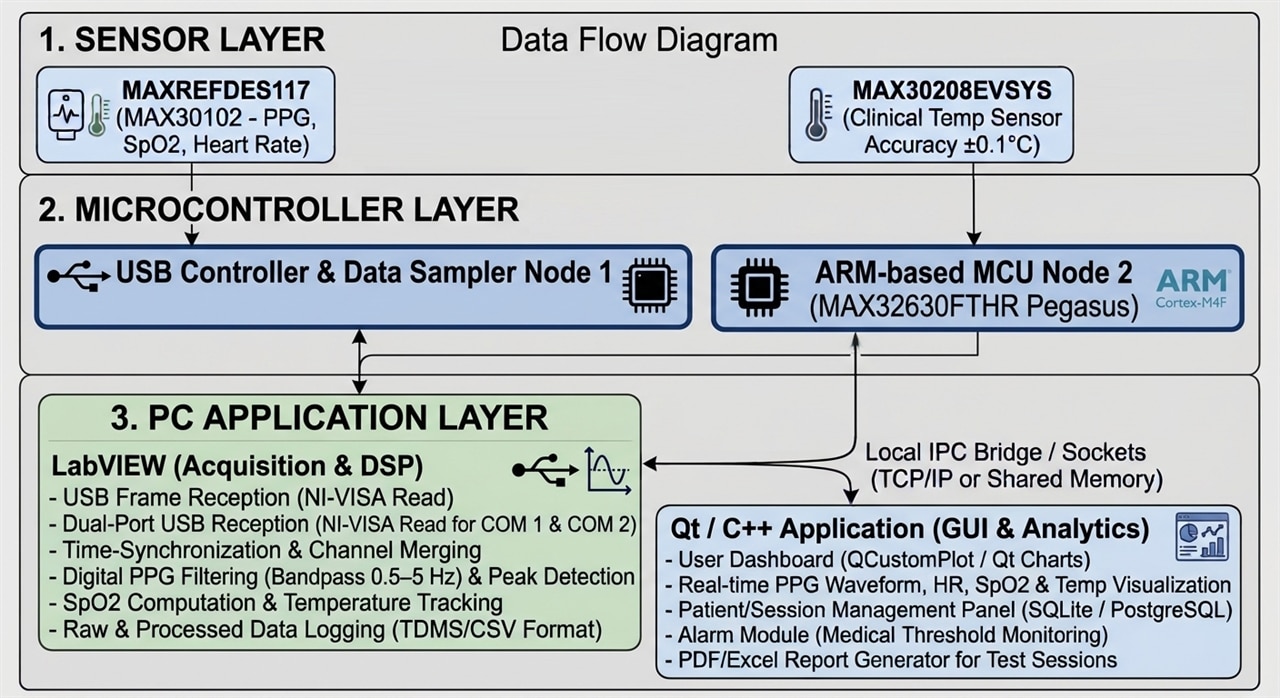
1.1. element14 Kits and Modules
-
Temperature measurement kit: MAX30208EVSYS# evaluation system, connected to a PC via USB using its supported evaluation interface and software or firmware configuration.
-
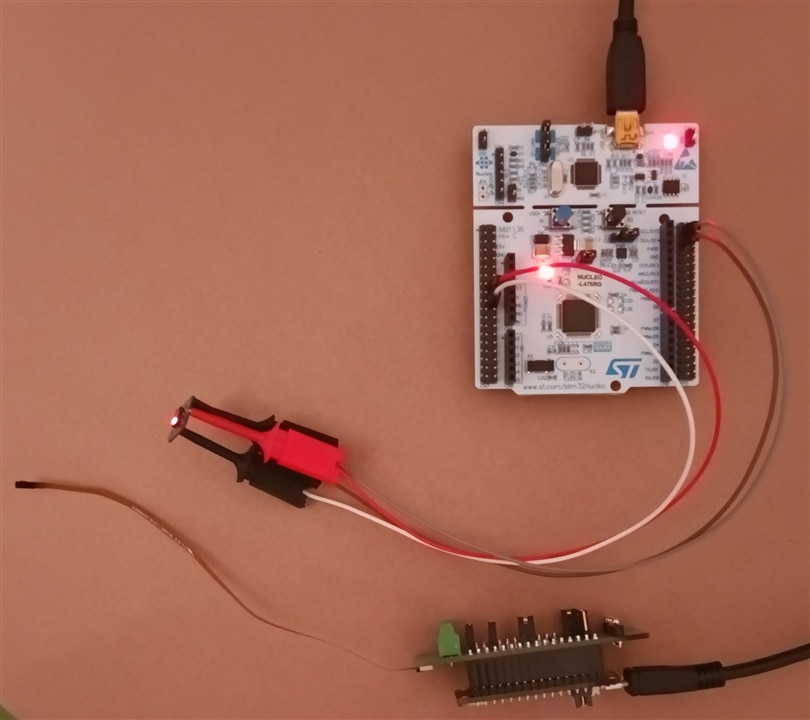
Heart rate and SpO2 measurement kit: MAXREFDES117# optical reference design, interfaced with an STM32 microcontroller that acquires sensor data and streams it to the PC via USB using a Virtual COM Port (VCP) or USB-to-UART bridge.
1.2 PC Connection Method and Software Layer
The workstation is designed to receive data through two independent USB-connected interfaces:
-
Channel 1 — Temperature: MAX30208EVSYS# → USB → evaluation firmware/software → temperature measurements.
-
Channel 2 — PPG and SpO₂: MAXREFDES117# → STM32 → USB (VCP/UART) → optical samples and calculated parameters, where supported by the firmware.
Alternative A: C++ / Qt Application (Cross-Platform)
A multi-threaded application using QThread, QSerialPort, and a plotting library such as QCustomPlot will provide a cross-platform software architecture for Windows and Linux, including Raspberry Pi OS, subject to the availability of compatible drivers and libraries.
The proposed application will include:
- Independent data-acquisition workers for the temperature and PPG channels.
- Real-time visualization of temperature and optical waveforms.
- Digital filtering and signal-quality assessment.
- Heart-rate estimation and SpO₂ estimation, where the required algorithm and calibration are available.
- Timestamped data logging and CSV export.
- Connection-status indicators and measurement-error reporting.
Alternative B: National Instruments LabVIEW Application
LabVIEW provides an established graphical programming environment for measurement engineering, data acquisition, signal processing, and real-time visualization.
Communication layer — NI-VISA
-
Configure independent communication sessions for the two data sources.
-
Use VISA functions such as VISA Configure Serial Port, VISA Read, and VISA Write where the devices expose compatible serial interfaces.
-
Implement appropriate framing, parsing, timeout handling, and communication-error detection.
Software architecture — Producer/Consumer design pattern
-
Producer loops: Independent acquisition loops read incoming data from the two interfaces without blocking the user interface.
-
Queues: Buffered data is transferred to processing and display loops.
-
Consumer loops: Validate, timestamp, process, visualize, and store measurements.
Signal processing and digital filters
-
Apply suitable digital filtering, such as a Butterworth band-pass filter, to reduce selected noise components in the PPG signal.
-
Use peak detection and inter-beat interval analysis to estimate heart rate.
-
Assess signal quality and identify motion-related artifacts.
-
Estimate SpO₂ using a suitable algorithm based on red and infrared PPG signals and an appropriate calibration model.
User interface — Front Panel
-
Waveform Chart and Waveform Graph elements for live temperature and PPG visualization.
-
Numeric indicators, gauges, and status indicators for measurement results.
-
Configurable sampling and display settings.
-
Measurement-session management and communication diagnostics.
-
Data export to TDMS (Technical Data Management Streaming) or CSV for subsequent research analysis.
1.3. Comparison of Similar Solutions in Portable Medical Diagnostics
| Feature / Parameter | VitalSense prototype (MAX30208 + STM32 + LabVIEW/Qt) | Standard Fingertip Pulse Oximeter | Commercial Smartbands (e.g., Apple Watch, Fitbit) | Industrial Patient Monitors (e.g., Philips) |
| Temp. Accuracy | Outstanding (+/-0.1'C - medical grade) | No temperature measurement | Low/Estimated (skin temperature, uncalibrated) | High (+/-0.1'C, continuous probes) |
| Data Access | Full access to raw PPG data and registers (LabVIEW/Qt) | No data access | Restricted (closed cloud APIs) | Integrated with hospital HL7/DICOM |
| Research Environment | High flexibility (LabVIEW for rapid prototyping and DSP analysis) | No modification options | Closed ecosystem | Dedicated clinical software |
2. Hardware Components Used
The Sponsored Kit designed for the Smart Home & Healthcare Challenge on the element14 platform consists of key components from renowned manufacturers (Analog Devices and 3M), along with additional prototyping accessories and branded swag.
The following overview describes the main components, their key characteristics, and their potential applications in the development of the VitalSense physiological-monitoring research platform.
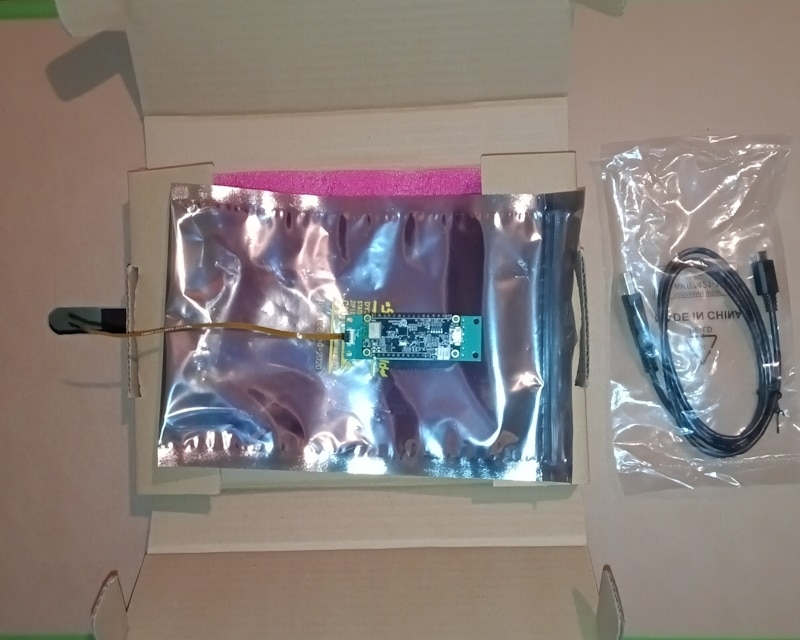
1. Analog Devices MAX30208EVSYS# Evaluation System
Quantity in kit: 1
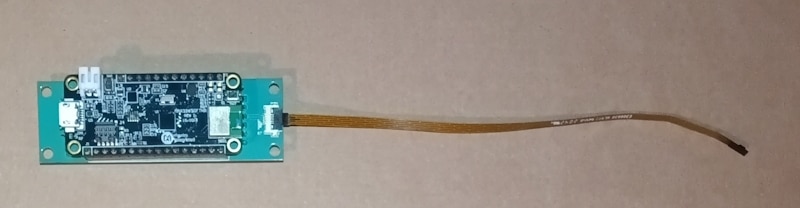
Description and main specifications: An evaluation system for the MAX30208 digital temperature sensor. The sensor is specified for ±0.1°C accuracy over the 30°C to 50°C temperature range. The evaluation system includes a MAX30208 sensor interface board, a MAX32630FTHR microcontroller board, and a flexible PCB carrying the sensor.
Project application: The system will serve as the starting point for evaluating temperature acquisition, sensor response, and measurement repeatability. Its compact sensor assembly and low thermal mass make it relevant to wearable and body-temperature-monitoring research. The accuracy of the complete measurement setup will depend on sensor placement, thermal contact, environmental conditions, and the measurement procedure.
2. Analog Devices MAXREFDES117# Reference Design
Quantity in kit: 1
Description and main specifications: A low-power optical heart-rate and pulse-oximetry reference design based on the MAX30102 sensor, with integrated red and infrared LEDs and supporting electronics.
Project application: The module will be used to investigate photoplethysmography (PPG), heart-rate estimation, and SpO₂ estimation. The reference design includes example source code and a basic algorithm for these measurements. It can be integrated with compatible development platforms, including Arduino-based systems, and adapted to other microcontrollers where suitable drivers and interfaces are implemented.
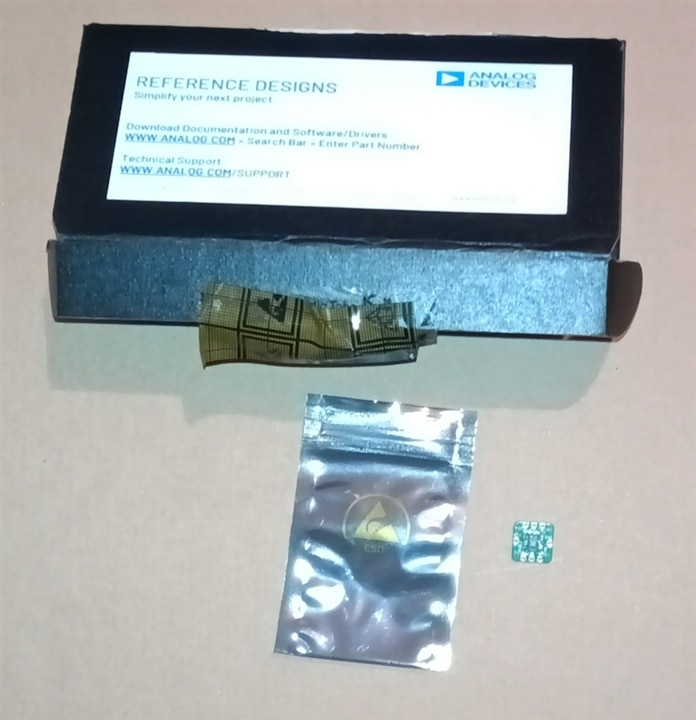
3. 3M EM25TP-0050 EMI Absorber Material
Quantity in kit: 1 piece (340mm x 340mm x 0.05mm sheet, EM25TP series)
Description and main specifications: A thin, flexible electromagnetic interference (EMI) absorber material from the 3M EM25TP family. The EM25TP family is designed to absorb electromagnetic energy over specified frequency ranges and can also provide magnetic-field shielding in applicable frequency ranges.
Project application: The material will be investigated as a potential aid in reducing selected electromagnetic interference in sensitive electronic prototypes. It may be useful when evaluating interference from wireless modules, switching circuits, and other electronic components. Its effectiveness will depend on the interference frequency, material placement, and overall system design.
The absorber will be treated as an experimental EMI-mitigation measure rather than a universal solution for electrical noise or measurement errors.
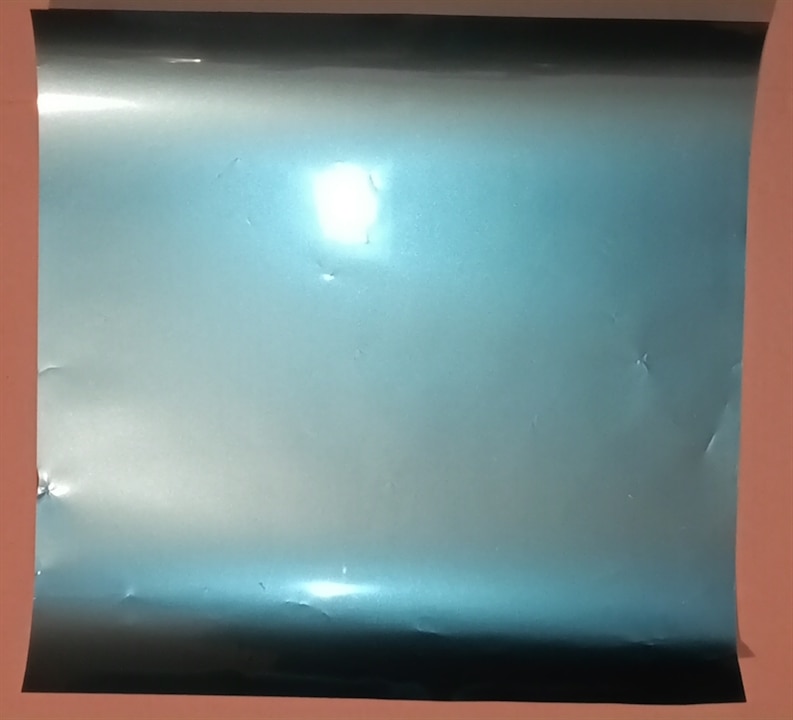
4. 3M 8810 Thermally Conductive Adhesive Transfer Tape
Quantity in kit: 1 roll, 3M 8810 series.
Description and main specifications: A thermally conductive adhesive transfer tape intended to provide an adhesive interface between suitable components and heat-dissipating surfaces.
Project application: The tape may be useful for selected thermal-management and mechanical-assembly experiments involving electronic components and enclosures. In the VitalSense project, its use near temperature sensors will be evaluated carefully because thermal coupling, heat flow, and contact conditions can influence the measured temperature.
The tape will not be assumed to improve body-temperature measurement accuracy without experimental evidence.
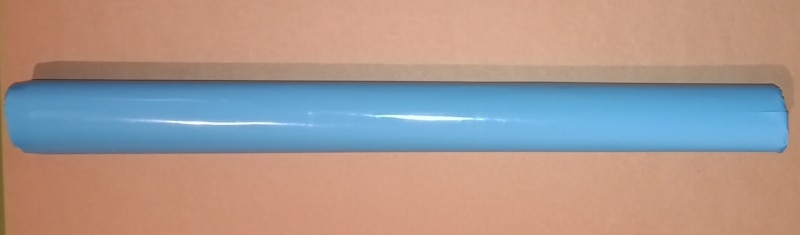
5. Multicomp MCBB830K Solderless Breadboard
Quantity in kit: 1
Description and main specifications: A solderless prototyping breadboard, providing 830 connection points.
Project application: The breadboard will support rapid prototyping of low-voltage circuits, including sensor interfaces (such as the MAX30208 or MAXREFDES117), microcontroller connections, and signal-conditioning experiments. It allows components to be connected and rearranged without soldering.
3. MAX30208EVSYS Evaluation Kit: Hardware, Sensor Specifications, and GUI Software
The MAX30208EVSYS evaluation system from Analog Devices provides a hardware and software platform for evaluating the MAX30208 digital temperature sensor. The sensor is designed for applications such as wearable temperature monitors, healthcare patches, and human-body thermometers.
The system consists of three main hardware elements:
- MAX30208 sensor flex PCB: A flexible printed circuit board carrying the MAX30208 sensor in a 10-pin LGA package.
- MAX3020x interface board: Provides accessible test points, configuration jumpers, and connections between the sensor and the microcontroller board.
- MAX32630FTHR microcontroller board: Runs the firmware required to communicate with the PC GUI and supplies power to the interface board.

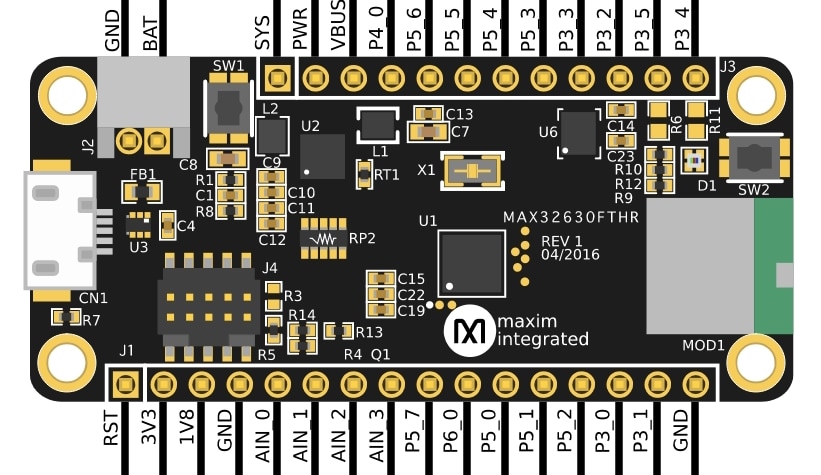
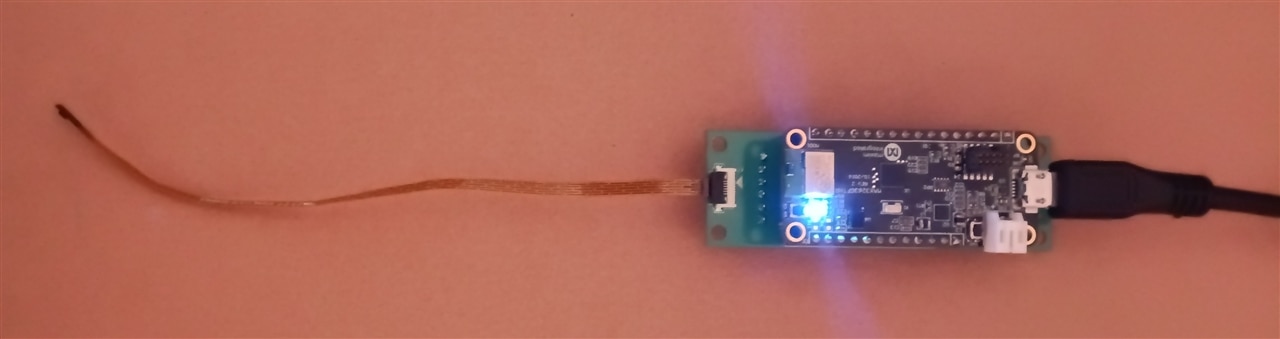
The system connects to a Windows PC through the micro-USB connector on the MAX32630FTHR board. The supplied firmware enables the evaluation software to configure the sensor, acquire temperature measurements, and access device registers.
The flexible sensor PCB has a low thermal mass, which supports a fast thermal response and allows the sensor to be positioned away from the main interface electronics. However, the measured temperature still depends on thermal contact, mounting, environmental conditions, and the measurement procedure. The flex PCB does not, by itself, guarantee accurate skin-temperature or clinical body-temperature measurements.
Technical Specifications of the MAX30208 Sensor
Temperature accuracy: ±0.1°C from +30°C to +50°C; ±0.15°C from 0°C to +70°C, according to the sensor datasheet.
Operating temperature range: 0°C to +70°C. The datasheet also specifies that the device can withstand a wider temperature range of −40°C to +85°C without damage; this should not be interpreted as the specified measurement-accuracy range.
Resolution: 16-bit, corresponding to 0.005°C per digital output step. Resolution is not the same as measurement accuracy.
FIFO: A 32-sample buffer for temperature readings, allowing the host controller to retrieve stored samples.
Communication interface: I²C, supporting four address configurations using the GPIO pin states at the I²C start condition.
GPIO0: Can be configured as an interrupt output for selected status conditions, including programmable high- and low-temperature alarms.
GPIO1: Can be configured as an external temperature-conversion trigger.
The sensor's ±0.1°C specification describes component-level performance under the conditions defined by the manufacturer. It does not, on its own, demonstrate that a complete thermometer meets clinical accuracy requirements or complies with medical-device standards.
MAX30208 EV Kit GUI Software
Analog Devices provides a Windows application for evaluating the MAX30208 without requiring the user to develop custom firmware for the initial tests.
According to the evaluation-system documentation, the GUI provides the following functions:
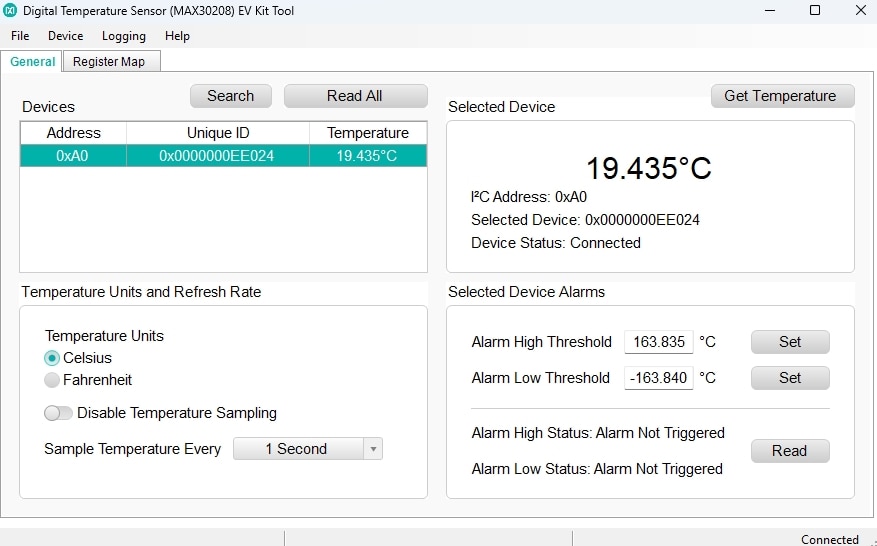
1. Temperature Monitoring
The application displays temperature readings from the connected sensor and provides controls for relevant device settings. The documentation does not describe a built-in real-time temperature-trend graph or a dashboard of minimum, maximum, and average statistics.
2. Data Logging
The GUI supports exporting measurement samples to a comma-separated values (CSV) file. This allows recorded data to be analyzed using tools such as Microsoft Excel, MATLAB, or Python.
The evaluation system also supports logging to a microSD card when configured for standalone operation with a compatible card and battery.
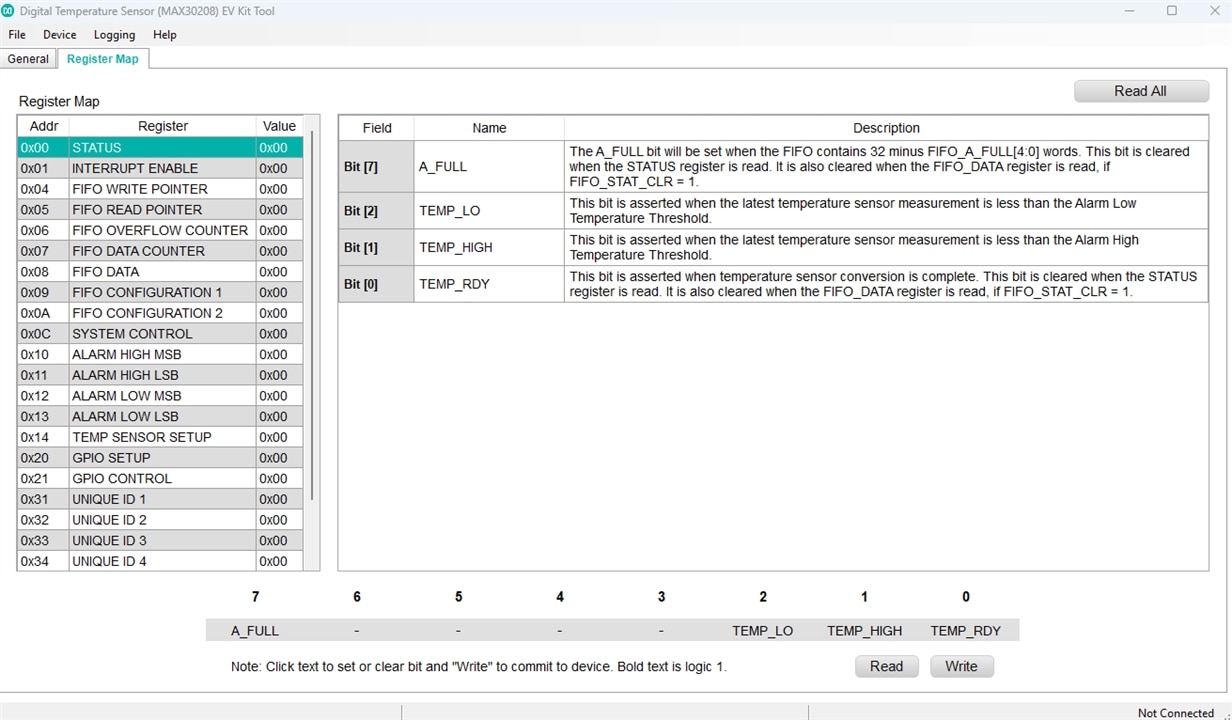
3. Register Map
The Register Map tab allows users to read individual MAX30208 registers, read all registers, and modify register bit settings. This is useful for exploring sensor configuration, measurement control, status flags, and other device functions.
4. Temperature Alarms and Interrupt Configuration
The MAX30208 supports programmable high- and low-temperature thresholds. When the relevant status and interrupt settings are enabled, the GPIO0 pin can signal a selected alarm condition. These functions can be configured through the device registers; the exact controls available in the GUI should be confirmed against the installed software version.
Relevance to the VitalSense Project
For VitalSense, the MAX30208EVSYS provides a useful starting point for characterizing temperature measurements, recording sensor data, exploring register-level configuration, and developing a custom acquisition and analysis application.
Further work should evaluate repeatability, response time, thermal contact, sensor placement, and agreement with a suitable reference thermometer. The results should be reported as experimental measurements rather than assumed clinical performance.
Troubleshooting the MAX30208EVSYS GUI: A Possible Regional Decimal-Separator Issue
During evaluation of the MAX30208EVSYS kit, I encountered a software issue involving the interaction between the hardware and the PC application. The GUI launches successfully when the sensor is disconnected, but crashes shortly after the sensor is connected.
The exception reported is:
System.FormatException: Input string was not in a correct format
One possible explanation is a regional number-formatting mismatch in the GUI software. In Windows configurations that use a comma as the decimal separator, such as the default Polish regional format, an application that parses a decimal value using incompatible formatting assumptions may fail. For example, the strings 24.57 and 24,57 can be interpreted differently depending on the parsing method and culture settings.
The fact that the application starts without the sensor but crashes when the sensor is connected suggests that the error may occur during device initialization or temperature-data processing. However, the exception alone does not establish the exact root cause.
Workaround to test
-
Close the MAX30208 EV Kit application.
-
Open Windows Settings → Time & language → Language & region (or the equivalent Regional Settings panel in your Windows version).
-
Temporarily select English (United States) as the regional format, or change the decimal-symbol setting to a period if Windows allows this independently.
-
Restart the application, connect the evaluation system, and check whether the crash still occurs.
-
Restore your preferred regional settings after testing if necessary.
If the application works under the alternative regional format and fails again under the original settings, this would support the decimal-separator hypothesis.
The issue would then appear to be related to the PC software's handling of regional number formats rather than necessarily indicating a fault in the MAX30208 sensor itself. A permanent software fix would be to parse numeric values using an explicitly defined culture that matches the data format, with appropriate validation and error handling.
What is 3M 8810 and how does it affect the temperature reading of the MAX30208 sensor
3M 8810 is a 0.25 mm thick thermally conductive double-sided tape made from an acrylic polymer filled with ceramic particles. It is designed to mechanically bond components while creating a thermal path to dissipate heat between a heat source and a cooling element (such as a chassis or heatsink).
Using this tape directly and significantly impacts how the MAX30208 sensor (a clinically accurate temperature sensor with ±0.1°C accuracy) registers the temperature of the ambient environment or the target object.
How does 3M 8810 tape affect the MAX30208 sensor readings
1. Sensor Specificity: MAX30208 (Inverted Design)
Most digital temperature sensors measure heat through thermal pads and ground pins on the bottom of the package (via the PCB). The MAX30208 measures temperature primarily from the top of its package (top-side), making it ideal for measuring human body temperature in wearable devices. To achieve accurate measurements, the target object must contact the top of the sensor package. Placing 3M 8810 tape there introduces specific physical consequences.
2. Introduction of Thermal Resistance (Measurement Error)
Although 3M 8810 is a thermally conductive material, its thermal conductivity is 0.6 W/m-K. At a thickness of 0.25 mm, this generates a measurable thermal impedance of approximately 5.8 °C·cm²/W.
Effect: The tape acts as a very thin layer of insulation. If the target object changes temperature, the sensor hidden behind the tape will register a temperature slightly lower (or higher, if the environment is cooling down) than the object's actual temperature. This creates a thermal offset (a steady-state error) that must be calibrated in the firmware.
3. Increased Response Time (Thermal Inertia)
The bare MAX30208 sensor responds to temperature changes incredibly fast (the response time of an unsoldered sensor is only about 0.5 s).
Effect: Adding a layer of acrylic adhesive and ceramics (3M 8810) introduces a barrier with a specific thermal mass. This causes the sensor to require more time to stabilize its reading after a sudden change in the object's temperature. Rapid, dynamic temperature spikes may be flattened out or completely missed.
4. Positive Effect: Elimination of Air Pockets
Air is a terrible conductor of heat (approx. 0.026 W/m-K). If you place the sensor directly against a rigid, rough surface, microscopic air gaps will distort the reading far more than the tape would.
Effect: 3M 8810 tape is compliant and features good "wet-out" capabilities (the ability to flow into and fill microscopic surface irregularities). Replacing these micro-air gaps with thermally conductive tape stabilizes and improves the repeatability of readings compared to a dry, unstable mechanical contact.
Summary of Impact Metrics
| Impact Parameter | Change with 3M 8810 | Goal & Solution |
|---|---|---|
| Absolute Accuracy | Degraded (introduces a small error/offset) | Requires software calibration of the temperature delta. |
| Response Time | Extended (greater response delay) | Acceptable for slow processes (e.g., body temperature measurement). |
| Reading Stability | Significantly improved (eliminates air and vibration impact) | Key advantage – prevents sudden measurement noise. |
If you are designing a medical or wearable device based on the MAX30208 and require its factory ±0.1°C accuracy, you must account for the temperature drop across the 3M 8810 tape or use a thinner material with higher conductivity (such as dedicated copper and gold-plated electrodes making direct contact with the package top).
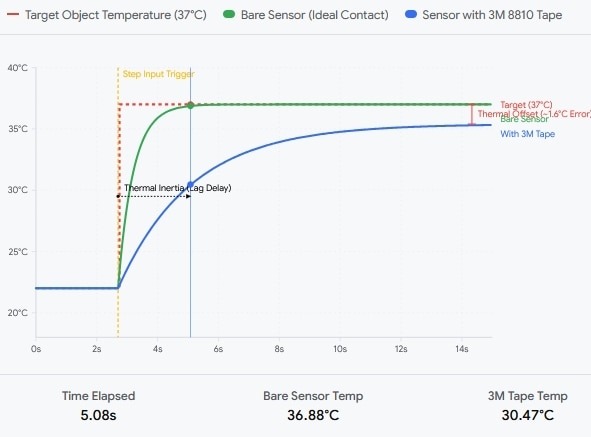
- Thermal Inertia (Delay): Without the tape (ideal contact), the sensor reacts almost instantly. The 3M 8810 tape layer causes the measurement curve to rise more gradually—the sensor needs a few more seconds to register the full change.
- Thermal Offset (Shift Error): Due to the thermal resistance of the tape, the measurement line with 3M 8810 stabilizes at a level slightly lower than the actual temperature of the object. This difference is a constant error that needs to be corrected (added) in the microcontroller code handling the sensor.
5. Reverse-Engineering the MAX30208EVSYS Communication Protocol
The MAX30208EVSYS evaluation system combines the MAX30208 digital temperature sensor with a flexible sensor PCB, an interface board, and a MAX32630FTHR microcontroller platform. It provides a convenient environment for evaluating temperature measurements, configuring the sensor, and collecting experimental data.
However, the usefulness of the evaluation system depends not only on the sensor itself, but also on the reliability of the communication path between the hardware and the PC application.
The communication architecture provides an interesting case study in embedded-system design. It connects a PC-based graphical user interface (GUI) to a microcontroller, which communicates with the temperature sensor over an I²C bus. In the software version examined for this analysis, the host-to-device interface uses text-based commands rather than requiring the user to construct binary protocol frames manually.
This article examines the communication architecture, serial-interface configuration, command syntax, response parsing, and potential software issues identified during the evaluation process. Details of the text protocol are based on analysis of the particular application version examined and should not be assumed to apply to every firmware or GUI release.
5.1. System Architecture
The communication path can be represented as follows:
PC application → USB virtual serial port → MAX32630FTHR firmware → I²C bus → MAX30208 sensor
The main elements are:
- PC/host layer: Runs the manufacturer's GUI or a custom diagnostic application.
- USB serial interface: Provides the communication channel between the PC and the microcontroller board.
- MAX32630FTHR: Runs the firmware that handles host commands and communicates with the sensor.
- MAX30208 interface board: Provides the electrical connections between the microcontroller and the sensor flex PCB.
- MAX30208 sensor: Measures temperature and provides digital measurement data through I²C.
The MAX32630FTHR is more than a passive USB-to-I²C converter: its firmware implements the device-side communication and control functions required by the evaluation software.
The MAX30208 itself uses a standard I²C interface. Its main features include 16-bit temperature output, a 32-sample FIFO, programmable temperature alarms, and configurable I²C addressing.
5.2. Serial Interface Configuration
In the application version examined, the host software initializes a virtual serial connection through the .NET SerialPort interface.
The configuration is:
| Parameter | Observed setting |
|---|---|
| Baud rate | 115200 bit/s |
| Data bits | 8 |
| Parity | None |
| Stop bits | 1 |
| Handshaking | None |
| DTR | Enabled |
| RTS | Enabled |
| Read timeout | 5000 ms |
| Write timeout | 5000 ms |
These settings correspond to a conventional 115200-8-N-1 serial configuration.
The analyzed application also appears to identify the evaluation board using Windows device information and USB identifiers. The values observed in the tested setup were:
VID: 0B6A
PID: 0042
These identifiers should be treated as observations from the tested hardware and software configuration, not as guaranteed identifiers for every revision of the evaluation system. Windows device enumeration and the exact identification method may vary with the firmware, driver, or board configuration.
5.3. Text-Based Command Interface
In the analyzed application, commands are transmitted from the host to the microcontroller as text strings terminated by a carriage return (\r). The firmware interprets the commands and performs the corresponding operations, including sensor discovery, temperature acquisition, register access, and logging configuration.
The following table summarizes the commands identified during the software analysis. The syntax and semantics should be verified against the firmware version used for testing.
| Command or example | Observed purpose |
|---|---|
s\r |
Search for connected devices |
t 0\r |
Request a temperature reading from device index 0 |
t 0 F\r |
Request readings for a specified device range or group, according to the analyzed implementation |
r 0 10\r |
Read a register from device index 0 |
w 0 10 5A\r |
Write a value to a register |
g 0 0\r |
Read a register array or group of registers |
i 10\r |
Configure a logging or sampling interval |
d 0\r |
Configure the device-selection mask used for logging |
f\r |
Query microSD-card status |
The exact argument order, numeric bases, whitespace requirements, and response formats are implementation-specific. In particular, register addresses and values may be represented in hexadecimal even when device indices or other fields use decimal notation.
A text-based interface is useful for debugging because commands can be inspected without a dedicated binary-protocol analyzer. Where the firmware supports direct terminal access, a serial terminal can be used to send commands and inspect responses. The serial settings and command syntax must match the firmware currently loaded on the board.
5.4. Response Framing and Host-Side Parsing
The analyzed software receives responses from the microcontroller as text and processes the returned fields in the host application. The response-handling code uses delimiters and regular expressions to extract values from the received strings.
This regular expression matches text enclosed in square brackets. It can be used to extract fields from responses such as:
[0] [24.570] [0]
The example above illustrates a possible temperature-response structure:
[0] — device index;
[24.570] — temperature value in degrees Celsius;
[0] — status or result field.
The precise meaning and number of fields must be confirmed against the actual response generated by the tested firmware. Whitespace, delimiters, and additional fields should not be inferred solely from a single example.
Device Discovery
The analyzed host application sends the s command to discover connected devices. The response is then parsed to obtain device-related information used to initialize software objects.
The code examined appears to process fields representing a logical device index, an address or identifier, and a value labelled as a ROM code.
Care is required when interpreting these fields. The MAX30208 has a configurable 7-bit I²C address in the range 0x50 to 0x53 under its standard address configurations. A reported value such as decimal 90 (hexadecimal 0x5A) would not be a valid standard MAX30208 7-bit I²C address. It should therefore not be labelled as the sensor's physical I²C address without further verification.
Similarly, the MAX30208 supports a unique ROM ID, but the precise structure and representation of that ID in the GUI's response must be confirmed from the implementation. A field described as a ROM code should not automatically be interpreted as a standard Dallas/Maxim 64-bit ROM identifier without evidence from the relevant firmware or source code.
Temperature Acquisition
The analyzed application requests temperature data using a command such as t 0\r.
A returned value like 24.570 is an example of a temperature represented as text in degrees Celsius. If the firmware uses a period as the decimal separator, the host application must parse that string using a compatible numeric format.
This is especially important on systems configured for locales that normally use a comma as the decimal separator, including the default Polish Windows regional format.
5.5. Regional Number Formatting and the FormatException Issue
During evaluation, the PC application was observed to start when the sensor was disconnected but to crash after the sensor was connected. The reported exception was:
System.FormatException: Input string was not in a correct format
One possible cause is a mismatch between the numeric format transmitted by the firmware and the format expected by the host application.
For example, the same decimal value can be represented as 24.570 or 24,570, depending on the locale. If the firmware sends a period-delimited decimal string but the application parses it using incompatible culture settings, conversion to a floating-point value may fail.
In .NET, a robust implementation should explicitly define the expected number format when parsing protocol data. If the firmware protocol specifies a period as the decimal separator, the host application can use CultureInfo.InvariantCulture, together with appropriate input validation and exception handling.
For example:
using System.Globalization;

string rawTemperature = "24.570";

if (double.TryParse(
        rawTemperature,
        NumberStyles.Float,
        CultureInfo.InvariantCulture,
        out double temperature))
{
    // Use the parsed temperature value.
}
else
{
    // Report invalid or unexpected protocol data.
}
This example demonstrates the recommended parsing approach; it does not establish that the same code change has been applied to the manufacturer's GUI.
Changing the Windows regional format to English (United States) may be a useful diagnostic workaround. If the application works with that setting and fails under Polish regional settings, the result would support the decimal-separator hypothesis. It would not, by itself, exclude other parsing or device-initialization problems.
A permanent fix should make the protocol's numeric representation explicit, validate received fields, and handle malformed or incomplete responses without terminating the application.
5.6. Engineering Value of the Protocol
A text-based command interface can make an embedded evaluation platform easier to inspect and debug. It allows engineers to examine individual operations, test register access, and build custom data-acquisition tools without first implementing a binary protocol decoder.
For the VitalSense project, this architecture offers several practical opportunities:
- Custom Python diagnostics: Send supported commands, collect temperature readings, and save measurements to CSV.
- Custom Qt application: Implement a desktop interface for live data display, logging, configuration, and experimental analysis.
- Protocol validation: Check response framing, malformed data, timeouts, and error reporting.
- Sensor characterization: Record repeatability, response time, and the influence of sensor placement and thermal contact.
- Regional-format testing: Verify that the host application behaves consistently across Windows locale settings.
Any custom implementation should preserve the command syntax and response format expected by the firmware and should not assume that all commands listed here are supported by every firmware revision.
The MAX30208EVSYS evaluation system illustrates how a sensor with a standard I²C interface can be integrated into a PC-based evaluation workflow through a microcontroller and a USB serial communication channel.
Examining the host software and the text-based command interface can help engineers understand the data path, develop custom diagnostic tools, and identify potential integration problems. The reported FormatException also highlights an important general principle: communication protocols should define numeric formats explicitly, and host applications should parse incoming data independently of the operating system's regional settings.
For VitalSense, this provides a useful starting point for developing a custom acquisition and analysis application. The next step is to validate the observed protocol against actual device responses and the corresponding firmware version before relying on it for automated measurements or long-term data logging.
MAX30208EVSYS Python Reader Script
Description: This script implements a direct communication protocol with the MAX30208EVSYS evaluation kit, bypassing the official Windows GUI. It establishes a serial connection through the USB-to-UART bridge (MAX32630FTHR) and communicates using text-based commands terminated with a carriage return ('\r'). Key Features: - Initializes the serial port according to firmware requirements (115200 baud, 8 data bits, no parity, 1 stop bit, DTR/RTS enabled). - Sends control commands like 's' (search devices) and 't0' (read temperature) - Uses regular expressions to parse bracket-notated data frames received from the microcontroller (e.g., [0] [24.570] [0])
import re
import time
import serial


class MAX30208Reader:

  def __init__(self, port_name, baud_rate=115200):
    self.port_name = port_name
    self.baud_rate = baud_rate
    self.serial_port = None

  def connect(self):
    """Initialization and opening of the serial port according to firmware parameters."""
    try:
      self.serial_port = serial.Serial(
          port=self.port_name,
          baudrate=self.baud_rate,
          bytesize=serial.EIGHTBITS,
          parity=serial.PARITY_NONE,
          stopbits=serial.STOPBITS_ONE,
          timeout=5,  # 5-second timeout for read and write operations[cite: 3]
      )

      self.serial_port.dtr = True
      self.serial_port.rts = True

      time.sleep(0.015)  # Equivalent to Thread.Sleep(15) after opening port in C#[cite: 3]
      self.serial_port.reset_input_buffer()
      print(f"Successfully connected to port {self.port_name}")
      return True
    except Exception as e:
      print(f"Error while opening port {self.port_name}: {e}")
      return False

  def disconnect(self):
    """Closing the serial connection[cite: 3]."""
    if self.serial_port and self.serial_port.is_open:
      self.serial_port.close()
      print("Disconnected from device.")

  def _send_command(self, command):
    """Sending a text command terminated with a carriage return (\r)[cite: 3]."""
    if self.serial_port and self.serial_port.is_open:
      full_command = command + "\r"
      self.serial_port.write(full_command.encode("utf-8"))

  def _read_response(self):
    """Reading the response line and clearing it of control characters[cite: 3]."""
    if self.serial_port and self.serial_port.is_open:
      line = self.serial_port.readline().decode("utf-8", errors="ignore")
      return line.replace("\r", "").replace("\n", "")
    return ""

  def find_devices(self):
    """Searching for devices on the I2C bus ('s' command) and clearing buffer lines[cite: 3]."""
    self._send_command("s")
    header_response = self._read_response()
    print(f"Controller response: {header_response}")

    # Read additional lines returned by the controller for each found device
    match = re.search(r"(\d+)", header_response)
    if match:
      num_devices = int(match.group(1))
      for _ in range(num_devices):
        dev_line = self._read_response()
        print(f"  -> Device info line: {dev_line}")

  def get_temperature(self, device_index=0):
    """Reading temperature for the indicated device index ('t' command)[cite: 3]."""
    self._send_command(f"t{device_index}")
    response = self._read_response()

    # Parsing the protocol response based on square brackets[cite: 3]
    # Example response format: [0] [24.570] [0]
    match_collection = re.findall(r"\[(.*?)\]", response)

    if len(match_collection) == 3:
      dev_idx = int(match_collection[0], 16)
      temperature = float(match_collection[1])
      status = int(match_collection[2])
      return {"device_index": dev_idx, "temperature_c": temperature, "status": status}

    return None


# --- Example script usage ---
if __name__ == "__main__":
  PORT_COM = "COM21"

  sensor_reader = MAX30208Reader(PORT_COM)

  if sensor_reader.connect():
    # Scan for devices (correctly flushes descriptive lines from the buffer)
    sensor_reader.find_devices()

    # Short pause before reading temperature
    time.sleep(0.5)

    # Continuous temperature reading from device index 0 in a loop
    try:
      print("\nStarting temperature reading (press Ctrl+C to abort)...")
      while True:
        data = sensor_reader.get_temperature(0)
        if data:
          print(
              f"Device: {data['device_index']} | Temperature:"
              f" {data['temperature_c']} °C | Status: {data['status']}"
          )
        else:
          print("Warning: Failed to read a valid data frame.")
        time.sleep(1)
    except KeyboardInterrupt:
      print("\nInterrupted by user.")
    finally:
      sensor_reader.disconnect()
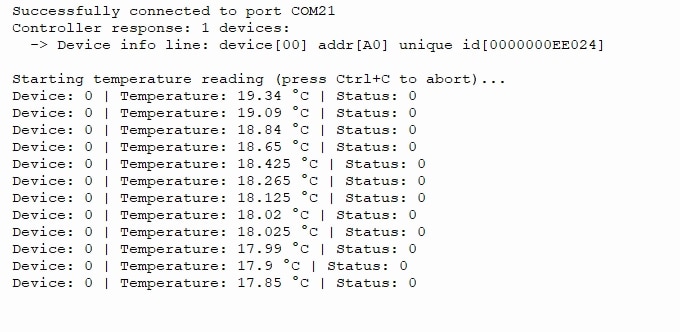
The result of this script's execution is as follows:
6. Communicating with the MAX30208EVSYS in LabVIEW
Creating a project in LabVIEW that reads data from sensors connected via USB in CDC mode (Communications Device Class – i.e., as a Virtual Serial / COM Port) is a standard task. In the operating system, such a device (e.g., Arduino, ESP32, or a dedicated microcontroller) is recognized as a serial port (COMx on Windows or /dev/tty... on Linux/macOS). In LabVIEW, the NI-VISA library is used to handle such ports. Designing such an application proceeds in a few steps.
Step 1: Prerequisites
Before writing code in LabVIEW, make sure you have the required software installed:
-
LabVIEW (any modern version).
-
NI-VISA Driver – a free package from National Instruments that enables communication with serial, USB, and GPIB ports (can be downloaded via the NI Package Manager).
-
USB CDC Device Driver – the device must be visible in Device Manager (Windows) under Ports (COM & LPT), for example, as a USB Serial Device (COM3).
Step 2: Step-by-Step Project in LabVIEW
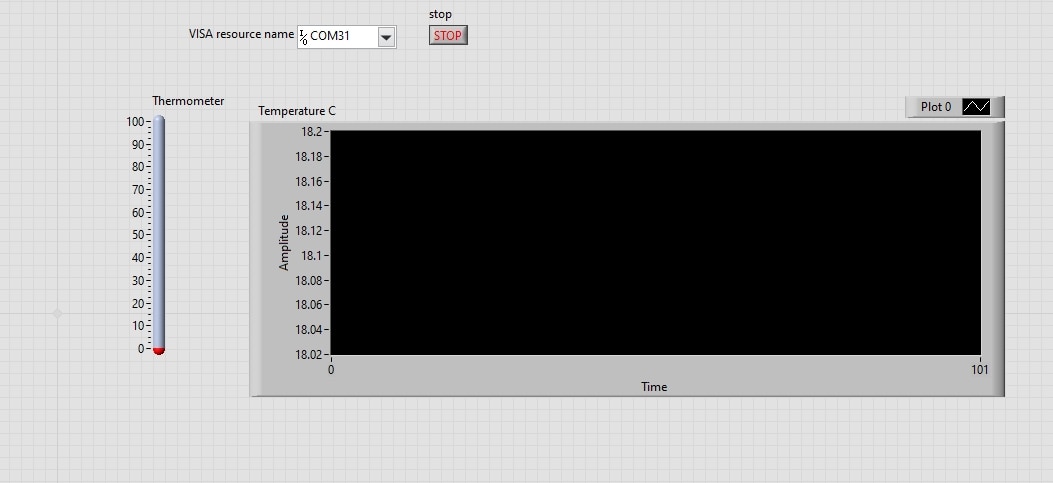
Front Panel (User Interface)
We designed a simple interface to control the connection and visualize the data:
-
VISA Resource Name (Control): A drop-down list allowing you to select the appropriate COM port (e.g.,
COM3). -
Baud Rate: Specifies the transmission speed (e.g.,
9600or115200– must match the microcontroller settings). -
Stop (Button): A button to stop the read loop.
-
Data Out / String / Graph (Indicator): A String indicator for raw data or a Waveform Chart/Graph to present sensor readings.
Block Diagram (Program Logic)
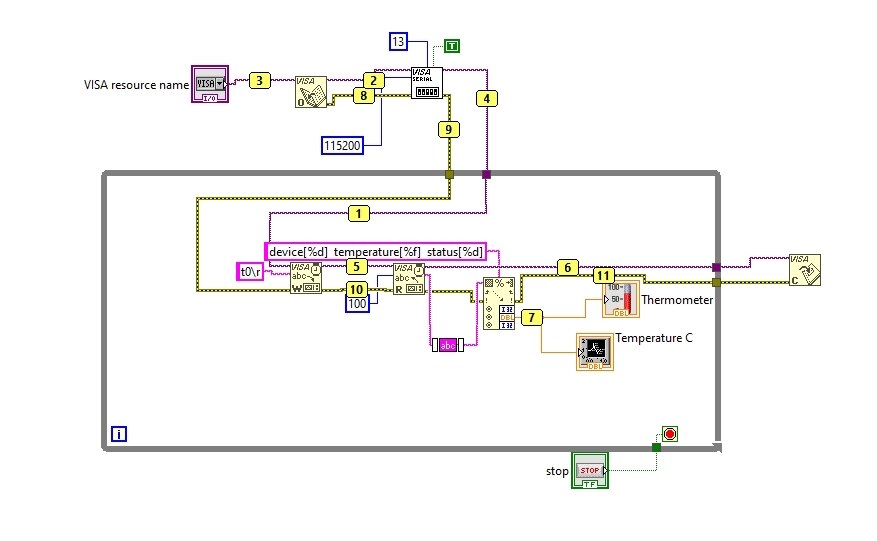
The standard structure for reading data from a COM port relies on a While Loop and functions from the Instruments I/O Serial palette.
Implementation steps in code:
-
VISA Open: Opens a connection to the selected port (input receives the VISA Resource Name control, output yields the VISA session).
-
VISA Configure Serial Port (optional, but recommended): Allows you to explicitly set the Baud Rate, data bits, stop bits, and flow control.
-
While Loop:
-
VISA Read: Reads a specified number of bytes. The Byte Count input specifies how many bytes to read (e.g., as many as the sensor typically sends in a single frame, or a fixed-size buffer like
256). -
Error Cluster: Passed through the entire pipeline.
-
Wait: It is best to include a short delay inside the loop (e.g.,
ms to wait = 10-50 ms) to prevent 100% CPU utilization.
-
-
VISA Close: Placed outside the While Loop (executed when shutting down the program) to properly release the COM port resource.
Step 3: Data Parsing (Processing)
Sensors typically send data in text format separated by newline characters (e.g., Temp:23.5, Hum:60\n or simply a numeric value as a string).
To convert the read string into numbers:
-
We used the Scan From String function if the data follows a fixed format (e.g.,
%f,%f). -
If data is transmitted in JSON or CSV format, you can use built-in LabVIEW string functions (such as Match Pattern or Spreadsheet String To Array) to extract the desired sensor parameters.
Evaluation Kit Context
The MAX30208EVSYS evaluation kit consists of the high-accuracy MAX30208 digital temperature sensor, the MAX32630FTHR microcontroller (which handles I²C communication with the sensor and provides a virtual COM port over USB CDC), and a flexible printed circuit (Flex PCB).
Below is the description of how to create a LabVIEW project to read data from this evaluation board via USB CDC:
Communication Architecture
The MAX32630FTHR board, connected via a Micro-USB cable, communicates with the computer using the USB CDC class (Virtual COM Port). Windows detects the board as a COMx port. The microcontroller transmits measurement data in text (ASCII) format, ending each frame with a carriage return/newline character (\r).
Here are the key takeaways from the code analysis:
Serial Transmission Parameters (USB CDC)
The OT07Serial.cs class shows how the host opens and configures the serial port:
-
Baud Rate: 115,200 baud.
-
Frame Format: 8 data bits, no parity (
Parity.None), 1 stop bit (StopBits.One). -
Flow Control: None (
Handshake.None). -
Control Lines: DTR and RTS signals are active (
DtrEnable = true,RtsEnable = true).
Text Command Protocol (CLI / Firmware Communication)
The application communicates with the microcontroller (e.g., MAX32630FTHR) using simple text commands sent and terminated with a carriage return (\r). Responses are also textual, often with lines ending in newline characters.
Main commands used in the code:
-
s– Device Search. Returns the number of sensors found, followed by lines with I²C addresses and ROM codes. -
t[index]ort [start] [end]– Temperature reading for a specific device index or a range of devices. -
r[index] [addr]orr[index] [start_addr] [end_addr]– Read a register or a range of registers from a given I²C sensor. -
g[index] 0– Read all registers (register map) for the indicated device. -
w[index] [addr] [data]– Write data (data) to a register (addr) of the selected sensor (index).
Response Format and Data Parsing
In response to commands, the firmware returns data enclosed in square brackets, e.g., [index] [value] [status].
-
Temperature reading example:
[0] [23.500] [0](where the first is the device index, the second is the temperature in °C, and the third is the status – e.g.,0means successful connection / no errors). -
Register values are read in hexadecimal format (e.g.,
0x10).
MAX30208 Sensor Register Structure
The Form1.cs class defines the complete register map of the MAX30208 chip (addresses from 0x00 to 0xFF):
-
0x00 (STATUS): Contains measurement readiness flags (
TEMP_RDY), alarm thresholds (TEMP_HIGH,TEMP_LO), and FIFO buffer full status (A_FULL). -
0x01 (INTERRUPT ENABLE): Configuration for enabling interrupts.
-
0x10 - 0x13: High and low temperature alarm thresholds (MSB and LSB).
-
0x20 (TEMP SENSOR SETUP): Contains the
CONVERT_Tbit (writing1triggers a single temperature measurement).
Raw Temperature Data Conversion
The code implements a method for converting 16-bit register values into degrees Celsius:
-
The sensor resolution is 0.005 per bit (0.005'C).
-
Negative values are handled by checking for a 16-bit overflow (32768).
-
Temperature formula:

How to use this knowledge in LabVIEW?
When creating your own LabVIEW program to handle this kit via USB CDC, instead of writing an advanced I²C protocol parser from scratch, you can send the exact same text commands to the serial port (e.g., sending the string "s\r" to detect devices or "t0\r" to read the temperature from device #0) and receive text responses using the VISA Read function.
Implementation process
The implementation process carried out in LabVIEW consists of the following phases:
Step 1: Serial Transmission Configuration (NI-VISA)
Before reading data, the serial port was correctly configured in LabVIEW using the VISA Configure Serial Port function to match the parameters extracted from the C# source code (OT07Serial.cs):
-
Baud Rate: 115,200
-
Data Bits: 8
-
Parity: None
-
Stop Bits: 1
-
Flow Control: None
-
Termination Character: Enabled (TRUE), set to \r (Return / 0x0D).
Step 2: LabVIEW Project Architecture (Block Diagram)
A sequential logic structure was established to mirror the text command mechanism of the original application, utilizing a While Loop for continuous data acquisition:
-
Initialization (Before the Loop):
-
The VISA Open function was used to open a connection to the selected COM port (e.g.,
COM3). -
The VISA Configure Serial Port function was applied with the parameters defined in Step 1.
-
-
Measurement Loop (While Loop Execution):
-
Command Transmission (VISA Write): Sent text commands terminated with a carriage return \r) using a string constant (e.g., sending
t0\rto request a temperature reading from device index 0). -
Response Acquisition (VISA Read): Read the text buffer returned by the firmware, which encapsulates output data inside square brackets (e.g.,
[0] [23.500] [0]representing the device index, temperature in °C, and status code). -
Data Parsing (Scan From String / Regex): Processed the incoming string using pattern-matching functions to extract the numerical temperature value.
-
Data Visualization: Routed the parsed temperature value to a numeric indicator and a Waveform Chart.
-
Loop Timing (Wait ms): Integrated a 1,000 ms (1 second) delay to match the native refresh rate of the original software and prevent 100% CPU utilization.
-
-
Resource Cleanup (After the Loop):
-
Upon pressing the stop button, the loop terminates and the VISA Close function executes to properly release the COM port resource in the operating system.
-
Step 3: Advanced Command Support (Maxim Protocol Reproduction)
To replicate the full feature set of the original application, the LabVIEW architecture was expanded to handle multiple CLI commands:
-
s\r: Initiates a device search across the I²C bus, returning the number of detected sensors along with their ROM codes and addresses. -
t0\r: Requests a direct temperature conversion and reading from the sensor at index 0, returning the formatted string[0] [23.500] [0]. -
r0 10\r: Reads register address0x10from device number 0, returning the hexadecimal value. -
w0 10 1F\r: Writes data (0x1F) into register0x10of device number 0, yielding a confirmation response.
Best Practices Implemented:
-
Error Handling (Error Cluster): The error cluster wire is daisy-chained continuously through every VISA operation (
Open->Configure->Write/Read->Close) to ensure robust exception handling and prevent application freezing if the USB cable is abruptly disconnected.
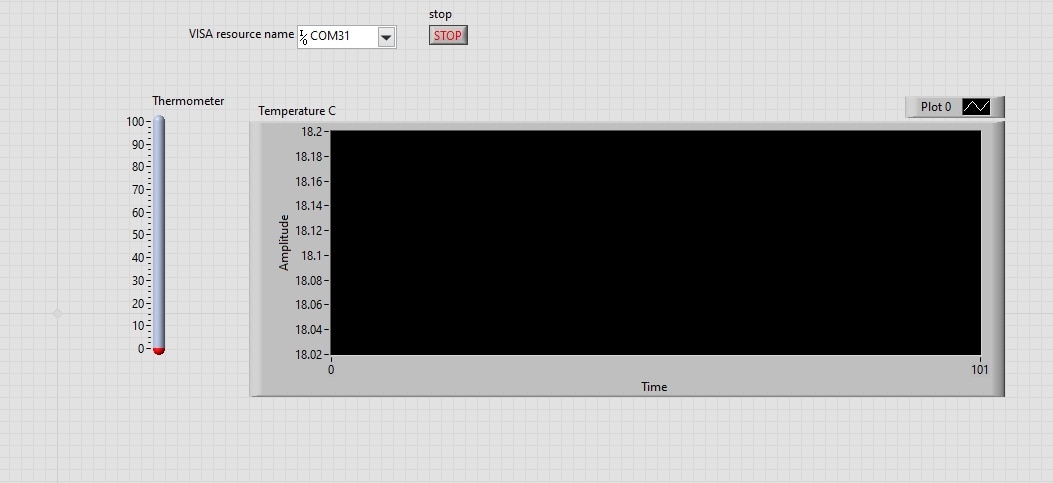
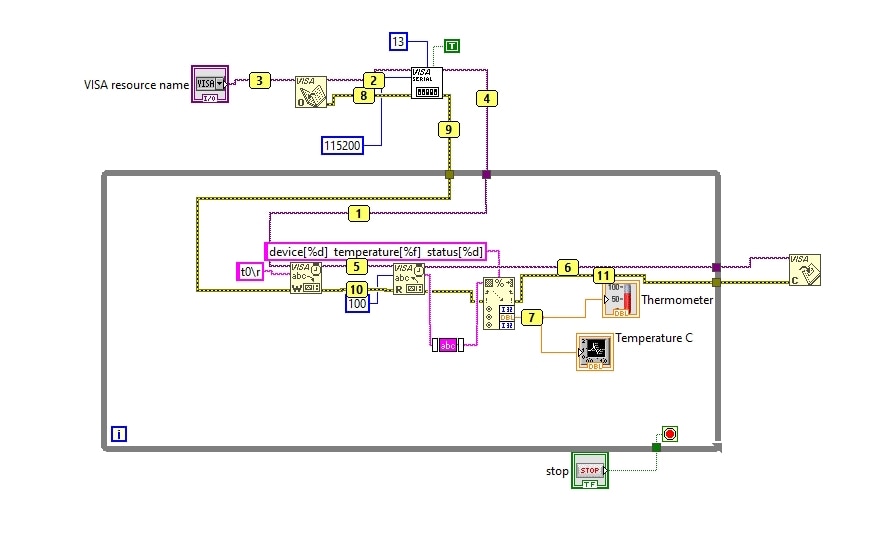
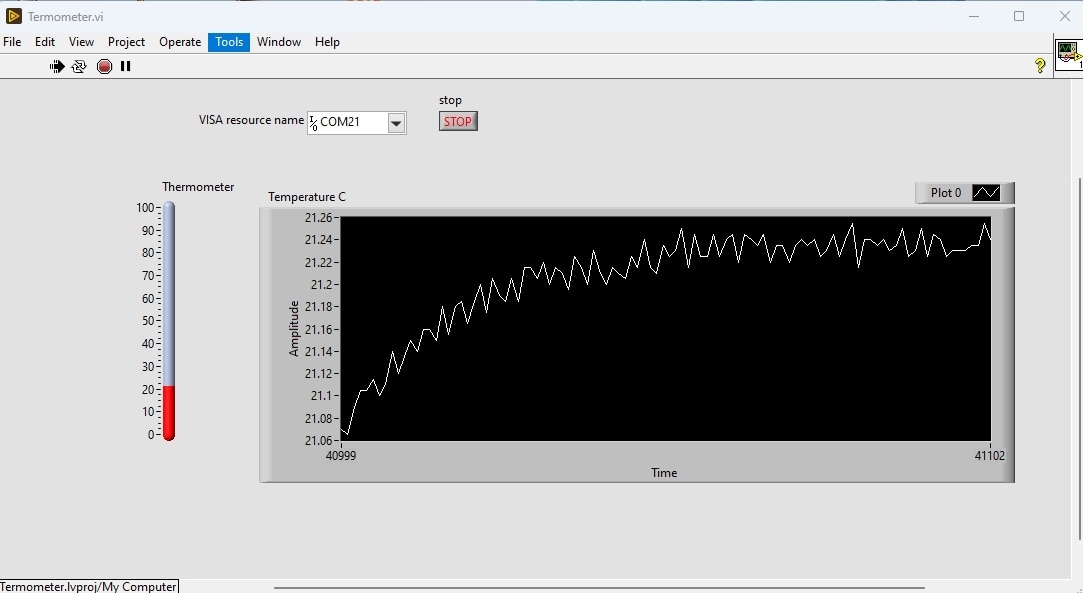
To display real-time temperature data from the MAX30208EVSYS sensor on a LabVIEW chart, the Waveform Chart element is the recommended choice.
The configuration process in the project involves the following steps:
1. Front Panel Configuration
From the Controls Palette, navigate to Graph -> Waveform Chart and place it on your user interface:
-
Chart vs. Graph Selection: The Waveform Chart was chosen over a standard Graph because it automatically maintains a history buffer of incoming data points and scrolls over time. A Graph, by contrast, would require manual array management to store and update historical data with every new temperature reading.
-
Labeling: The indicator is designated as Temperature History.
-
Axis Precision: Because the MAX30208 sensor provides high-precision data down to thousandths of a degree, the Y-axis formatting was adjusted via Right-Click -> Format and Precision (setting Digits of Precision to at least 3) to properly display floating-point values with multiple decimal places.
2. Block Diagram Implementation
Inside the primary While Loop where data is acquired from the device:
-
Data Acquisition & Parsing: After receiving the serial string via VISA Read (e.g.,
[0] [23.500] [0]) and extracting the numeric temperature value as a Double-precision float, a single sample is ready for plotting. -
Data Wire Connection: The numeric data wire is connected directly to the Waveform Chart terminal located on the loop boundary (or inside it). LabVIEW automatically appends the new sample to the chart's internal history buffer.
3. Timeline and Smoothness Optimization
To ensure the chart clearly visualizes temperature variations over time:
-
Loop Timing (Wait ms): A Wait (ms) function is embedded inside the While Loop, configured to a 1,000 ms delay (1 second per reading), matching the default refresh rate of the native application.
-
X-Axis (Time Scale): Through PropertiesScales Time, the time formatting can be customized (e.g., displaying hours, minutes, and seconds).
-
History Length: By default, a Waveform Chart retains the last 1,000 points. To extend the retention window (e.g., covering several hours of data), Data History can be modified by right-clicking the chart and increasing the buffer size.
4. Sensor Communication in LabVIEW
The MAX30208EVSYS evaluation board streams a raw text frame over the virtual COM port whenever a measurement command is triggered. The received data string typically follows this format:
device[00] temperature[18.090] status[0]
To successfully parse this string and extract the temperature value in LabVIEW, the implementation follows these steps:
-
Trimming Hidden Characters: Serial devices often append hidden carriage return and line feed characters (
\r\n) at the beginning or end of the incoming data stream. Before any parsing takes place, the raw string is passed through LabVIEW’s Trim Whitespace function. Trimming the text removes these stray control characters and whitespace, preventing matching errors and ensuring the string format is clean and predictable. -
Parsing and String Matching: Once the text is properly trimmed, LabVIEW uses pattern matching or the Scan From String function to locate the
temperature[...]block. It isolates the characters nested inside the square brackets. -
String-to-Number Conversion: The isolated floating-point number (e.g.,
18.090) is converted from text into a numeric data type (Double format). This yields a clean numerical temperature value ready to be displayed on indicators, plotted on real-time charts, fed into the statistical analysis engine, or logged to a CSV file.
7. Building a Cross-Platform Qt6 Desktop Application for the MAX30208EVSYS Temperature Sensor
7.1. Motivation & Background
When working with high-accuracy temperature sensors such as the Maxim Integrated MAX30208 (delivering clinical-grade accuracy), developers frequently encounter a major bottleneck: vendor lock-in and restrictive software ecosystems.
Official evaluation software provided by manufacturers is typically restricted exclusively to Windows, leaving Linux workstations, developer laptops running Ubuntu, and edge single-board computers (SBCs) like Raspberry Pi unsupported. Furthermore, proprietary tools often lack flexibility for multi-sensor scaling, real-time CSV streaming, or automated remote storage management.
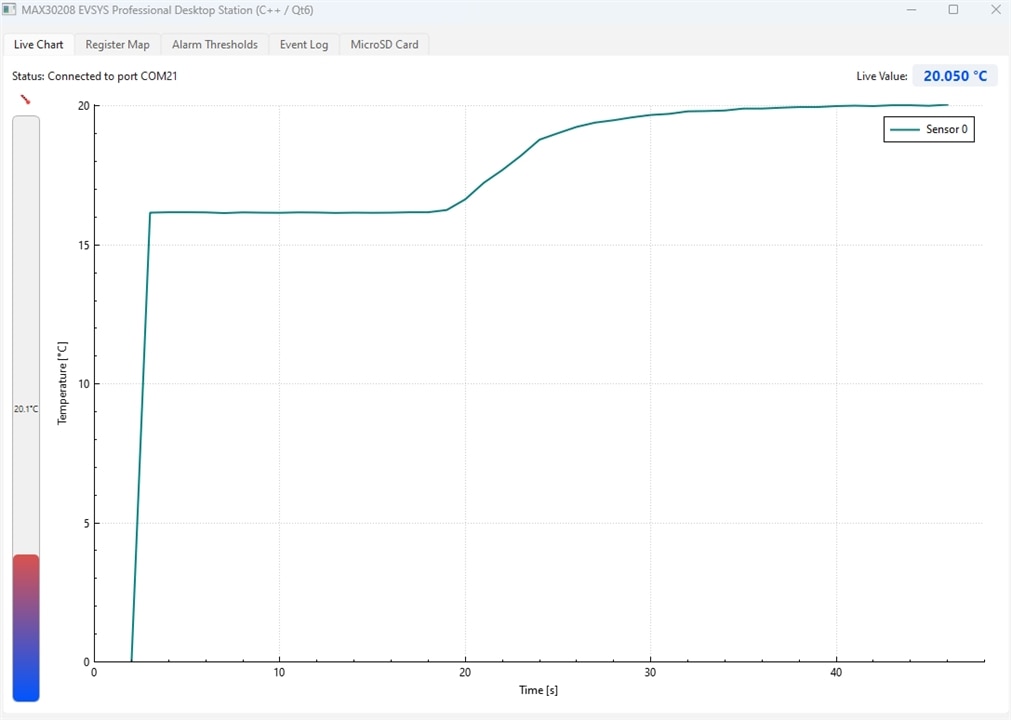
To overcome these hardware and OS constraints, MAX30208 EVSYS Desktop Monitor was engineered from scratch using modern C++ and Qt6. It provides engineers and researchers with a responsive, multi-threaded telemetry station that runs seamlessly across Windows, Linux, and embedded SBC environments.
7.2. Key Capabilities & Features
-
Cross-Platform Portability: Built with CMake and Qt6, ensuring native execution on Windows, Linux, and ARM-based single-board computers.
-
Plug & Play Auto-Detection: Automatically scans available system serial ports and connects to the evaluation kit using dynamic device descriptor matching, removing the need for manual COM port configuration.
-
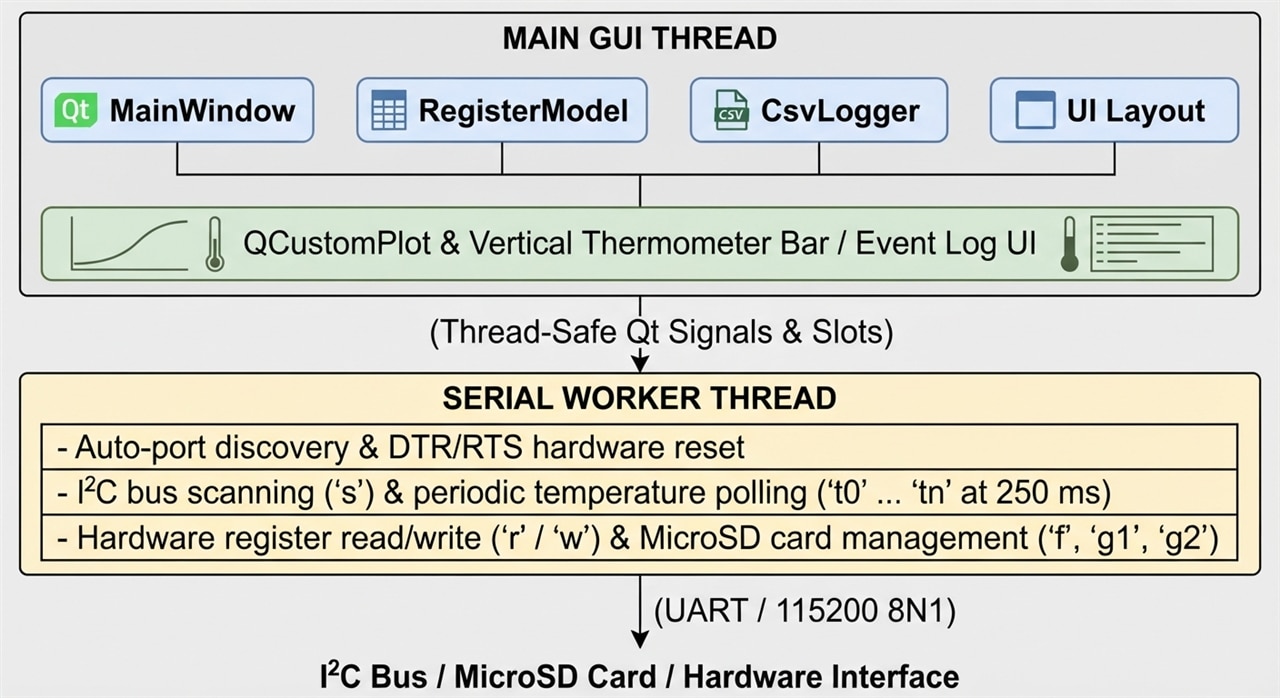
Non-Blocking Multi-Threaded Architecture: Utilizes a dedicated background thread (
SerialWorker+QThread) combined with thread-safe Qt signals and slots, ensuring the user interface remains completely smooth and responsive during heavy polling or file I/O operations. -
Real-Time Multi-Channel Plotting (
QCustomPlot): Dynamically renders high-refresh-rate temperature curves for all sensors discovered on the I²C bus, complete with zoom, pan, and live color-coded legends. -
Interactive Vertical Thermometer Widget: Features an intuitive, gradient-styled vertical progress bar acting as a visual thermometer alongside the main plot for quick status checks.
-
Hardware Register Map Viewer: Provides a custom
QAbstractTableModelinterface to inspect, read (r), and write (w) internal device registers (0x00to0xFF) on the fly. -
Remote MicroSD Card Management: Enables users to check onboard storage status (
f), download internal log files (g1), and clear storage memory (g2) directly from the desktop GUI. -
Streamlined Data Logging: Automatically captures real-time telemetry into structured CSV files (
.csv) for post-processing and compliance reporting.
7.3. System Architecture & Tech Stack
-
Language: C++17
-
Framework: Qt6 (Core, GUI, Widgets, SerialPort)
-
Charting Library: QCustomPlot
-
Build System: CMake
UI Tabs & Functional Breakdown
1. Live Chart Tab (Main Dashboard)
The primary workspace designed for real-time telemetry observation and quick visual assessment.
-
Top Compact Info Bar: Displays the current connection status (e.g., active COM port name) and a real-time numerical readout of the primary sensor's temperature (
Live Value) formatted to three decimal places. -
Vertical Thermometer Widget: Positioned on the left side, this gradient-styled vertical progress bar acts as a visual mercury column that provides an intuitive, at-a-glance thermal indicator.
-
Multi-Channel
QCustomPlotArea: Occupies the main right-hand portion of the window. It renders smooth, color-coded temperature curves for all sensors discovered on the I²C bus simultaneously. It features interactive zoom, pan, and a live legend.
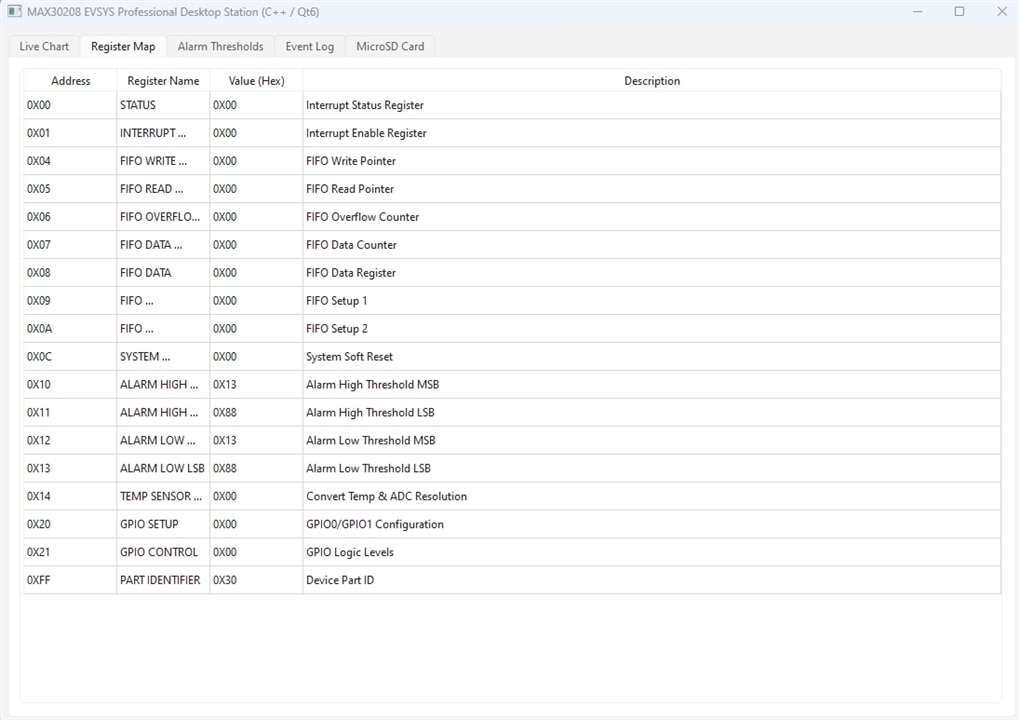
2. Register Map Tab
An advanced hardware debugging interface providing transparent access to the internal register architecture of the MAX30208 sensors.
-
Interactive Table View (
QTableView): Powered by a customQAbstractTableModel, it displays all core device registers from address0x00(Status) through0xFF(Part Identifier). -
Detailed Mapping: Columns explicitly outline the register Address, Register Name, current Value (Hex), and a functional Description (e.g., FIFO configuration, high/low alarm thresholds, and GPIO settings).
3. Alarm Thresholds Tab
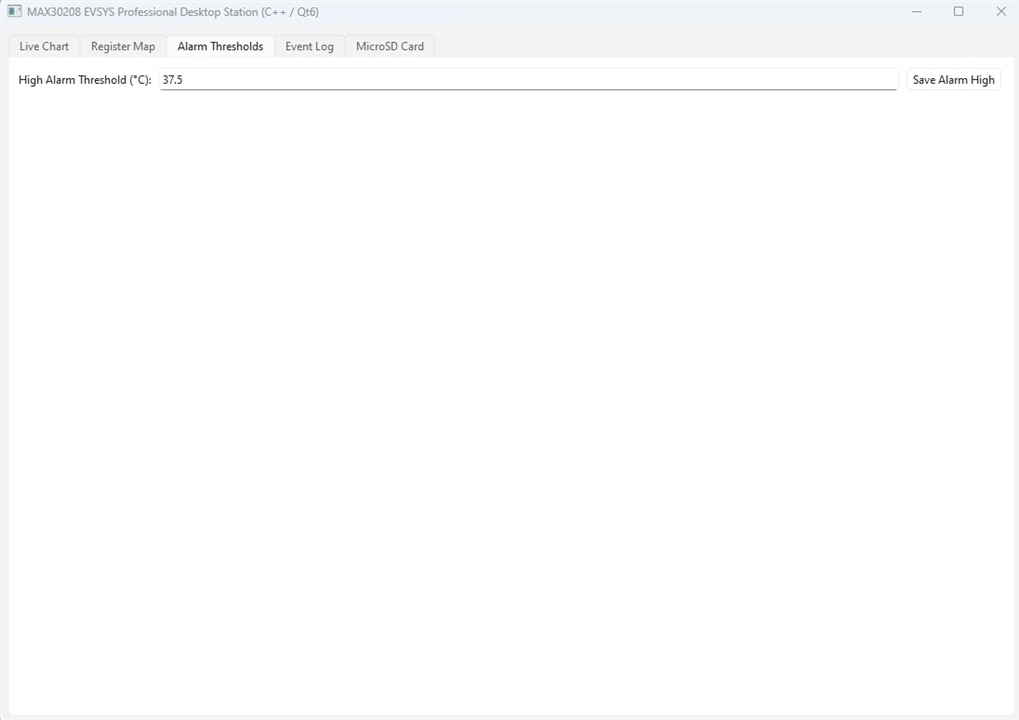
A dedicated control panel for configuring high and low temperature warning limits.
-
Input Controls: Allows engineers to specify precise high-temperature thresholds (e.g., default set to 37.5'C).
-
Hardware Triggering: Clicking the "Save Alarm High" button invokes background routines that automatically translate the floating-point Celsius value into 16-bit Two's complement register bytes and writes them directly to the sensor's threshold registers (
0x10and0x11). When breached, the UI visually highlights the temperature label in warning red.
4. Event Log Tab
The system audit trail and diagnostic log viewer.
-
Chronological Tracking: Records significant background events, such as successful hardware initialization, device discovery counts, USB serial disconnections, auto-reconnect attempts, and critical hardware errors.
-
Timestamping: Every log entry is prefixed with an exact system timestamp (
hh:mm:ss) to aid in debugging communication drops or signal integrity issues.

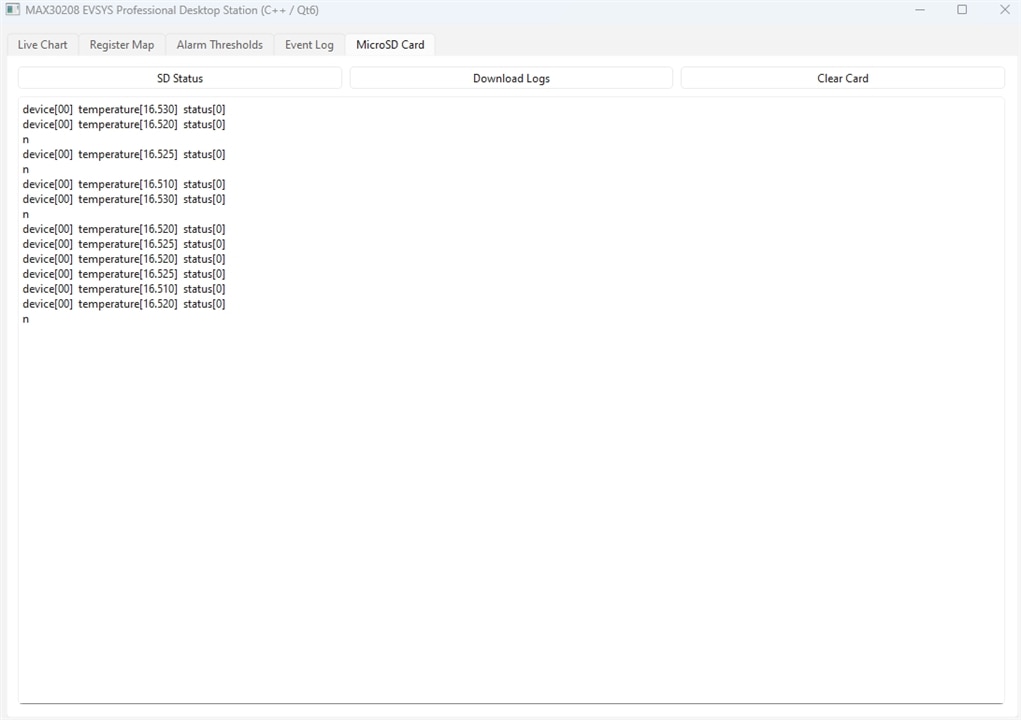
5. MicroSD Card Tab
An embedded storage management interface for the evaluation kit's onboard logging capabilities.
-
SD Status (
f): Queries the storage subsystem to verify if a card is present, formatted, and operational. -
Download Logs (
g1): Remotely pulls historical data logs stored on the kit's internal card and displays the text dump directly in the scrollable preview box. -
Clear Card (
g2): Issues a hardware wipe command to flush and clear stored logs directly from the desktop software.
8. STM32 Pulse Oximeter & Heart Rate Monitor (MAXREFDES117 + USB CDC)
The main objective was to build a non-blocking, highly responsive firmware that streams clean sensor data in real-time to a PC via USB CDC (Virtual COM Port) using a universal JSON format.
Throughout the development process, we successfully tackled several core challenges typical of PPG (Photoplethysmography) optical systems:
-
DC vs. AC Component Separation: The raw optical signal reflected from tissue has a massive DC component (~200,000 units), while the actual pulse wave accounts for less than 2% of the total signal.
-
Motion Artifacts: Finger tremors or shifting pressure cause severe signal spikes that ruin traditional peak-detection algorithms.
-
Avoiding System Freezes: Standard rigid buffer-filling loops easily freeze the microcontroller if the user momentarily lifts their finger.
Hardware Architecture & Pinout
The hardware stack is built around low-power, high-reliability components:
-
Microcontroller: STM32 Nucleo-L476RG (ARM Cortex-M4 core with FPU, ultra-low-power L4 series).
-
Sensor Module: MAXREFDES117 featuring the MAX30102 integrated optical sensor (Red and Infrared LEDs, plus a sensitive photodetector).
-
Communication: I2C Bus (pins
PB8for SCL andPB9for SDA) and USB Virtual COM at 115200 baud.
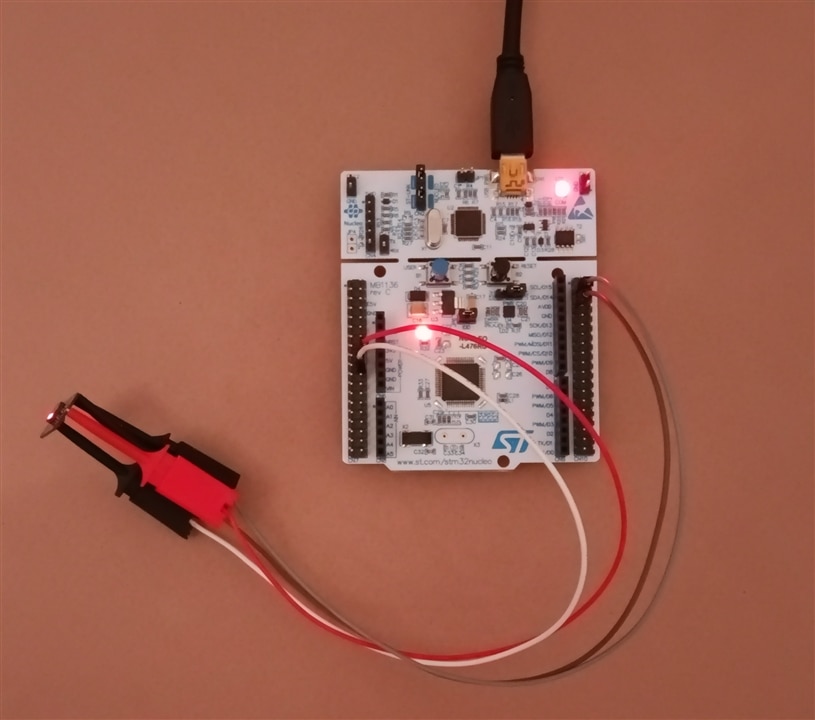
Before diving into the code, let's take a closer look at the hardware layer that forms the foundation of our device.
A. Microcontroller Choice: STM32 Nucleo-L476RG
The core of the system is a 32-bit microcontroller from the STM32L4 family (an ARM Cortex-M4 core with a floating-point unit / FPU). The "L4" series is designed specifically for battery-powered and low-power applications, offering massive processing power while maintaining high energy efficiency.
B. Optical Sensor: MAX30102 vs. MAX30105
Mounted on the MAXREFDES117 board is the MAX30102 – an advanced optical PPG (Photoplethysmography) sensor designed specifically for pulse oximetry and heart rate monitoring. It contains two integrated LEDs: Red and Infrared (IR), along with a sensitive photodetector.
-
Good to know: In the Arduino/PlatformIO ecosystem, SparkFun's universal library based on the
MAX30105.hclass is commonly used. Although we physically have the MAX30102 model (equipped with 2 LEDs, unlike the MAX30105 which adds a green LED for things like smoke detectors), the registers and I2C communication protocol are identical, allowing for seamless compilation. -
Pinout & Connections: Communication takes place via the I2C bus (
PB8for SCL,PB9for SDA).
Step-by-Step Development Milestones
To reach a production-grade hobbyist firmware, the development evolved through several crucial stages:
Milestone 1: Establishing Basic I2C and Raw IR Streaming
We started by verifying basic sensor communication over I2C and streaming raw IR values. This confirmed that the wiring, power rails, and USB CDC serial pipeline were working properly without any driver conflicts.
Milestone 2: Transitioning from Blocking Buffers to Non-Blocking Architecture
Initial standard buffer algorithms (like those requiring strict 100-sample windows at 100Hz) caused the system to hang or reset whenever a finger twitched. We replaced this with a non-blocking sliding window and timeout mechanism, allowing the firmware to recover instantly if contact was temporarily lost.
Milestone 3: Implementing Digital Filtering (DC Removal / High-Pass)
To strip away slow baseline drifts (such as skin deformation or changing pressure), we implemented a recursive Infinite Impulse Response (IIR) filter:
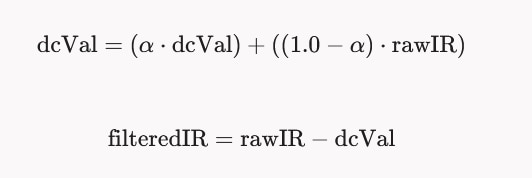
Setting the smoothing factor to alpha = 0.95 effectively isolated the clean AC pulse wave. Furthermore, we added a 1.5-second warm-up phase upon finger placement to initialize the filter smoothly and prevent startup transient spikes.
Milestone 4: Motion Artifact Detection & Signal Quality Control
Optical sensors are notoriously sensitive to movement. We added real-time delta tracking

If a sudden spike exceeds the safety threshold (8000), the sample is discarded, and a status message ({"status": "Motion detected - keep finger still"}) is sent instead of corrupted BPM values.
Maximizing MAXREFDES117 (MAX30102) Performance on Difficult Body Locations (e.g., Wrist)
Placing the PPG sensor on the wrist or forearm significantly attenuates the blood volume pulse signal, introducing heavy motion and muscle noise. To overcome this using an STM32 microcontroller, you must transition to non-blocking register management, apply digital band-pass filtering, implement an adaptive peak detection algorithm, and re-calibrate the SpO₂ R-curve.
Modifying Sample Rate (SPS) and Register Configurations
Default libraries often configure the sensor for power-saving mode with lower resolution. For difficult locations, you must increase the LED drive current and lengthen the pulse width (LED_PW) to ensure the light penetrates deeper tissue layers.
Using the standard SparkFun MAX30105 Library (which is fully compatible with the MAX30102 on your MAXREFDES117 board), configure the parameters in your setup() function as follows:#include <Wire.h>
#include "MAX30105.h" // Works perfectly with the MAX30102 chip on the MAXREFDES117 board
MAX30105 particleSensor;
void setup() {
Serial.begin(115200);
if (!particleSensor.begin(Wire, I2C_SPEED_FAST)) {
Serial.println("Sensor not found!");
while (1);
}
// --- HARDWARE OPTIMIZATION FOR DIFFICULT LOCATIONS ---
byte ledBrightness = 0x3F; // High LED current (~12.6mA to 50mA depending on setup) - deeper tissue penetration
byte sampleAverage = 4; // On-chip sample averaging (1, 2, 4, 8, 16, 32) - filters high-frequency noise
byte ledMode = 2; // Mode: 2 = Red + IR (Required for both SpO2 and Heart Rate)
// Increasing the Sample Rate (SPS) improves the precision of the captured PPG wave shape
int sampleRate = 400; // Options: 50, 100, 200, 400, 800, 1000, 1600, 3200
// Extending Pulse Width increases the internal ADC resolution (411us = 18-bit)
int pulseWidth = 411; // Options: 69 (15-bit), 118 (16-bit), 215 (17-bit), 411 (18-bit)
// Load custom configurations into the sensor registers
particleSensor.setup(ledBrightness, sampleAverage, ledMode, sampleRate, pulseWidth, 4096);
}
Golden Rule for Wrists: Set sampleRate = 400 or 800 and pulseWidth = 411. The maximum 18-bit ADC resolution allows the sensor to capture miniscule volumetric changes in the bloodstream that are otherwise dampened by thicker skin.
On-Chip Averaging: Setting sampleAverage = 4 averages the samples directly inside the sensor's hardware FIFO, delivering a smoother signal to your microcontroller.
Eliminating Ambient Light Noise and Filtering Signal Waves
The MAX30102 features built-in hardware Ambient Light Cancellation (ALC). It measures the background light while the LEDs are turned off and subtracts it from the active measurement. However, rapid ambient changes (like 50Hz/60Hz indoor fluorescent lighting or direct sunlight) can still saturate the ADC.
To fix this, you must apply both software filtering and physical isolation:
A. Digital Band-Pass Filter (Removing Muscle Noise and Baseline Drift)
Wrist movement introduces baseline wander (low-frequency drifting), while muscle micro-tremors introduce high-frequency hiss. The code below implements a digital band-pass filter (a combination of High-Pass and Low-Pass) that isolates the AC component, cutting off everything below ~0.5 Hz (30 BPM) and above ~5 Hz (300 BPM).#include <Wire.h>
#include "MAX30105.h"
MAX30105 particleSensor;
// Filter coefficients (Tuned for ~100 Hz effective sampling rate after averaging)
const float alpha_hp = 0.95; // High-Pass filter coefficient (Cuts DC baseline wander)
const float alpha_lp = 0.25; // Low-Pass filter coefficient (Smooths muscle noise)
float dc_offset = 0;
float filtered_signal = 0;
void loop() {
// Read raw Infrared (IR) values - IR provides a more stable heart rate wave than Red
uint32_t raw_ir = particleSensor.getIR();
if (raw_ir > 50000) { // Skin-proximity check (ensures a body part is touching the sensor)
// 1. HIGH-PASS FILTER (Removes DC component and baseline wandering)
dc_offset = (alpha_hp * dc_offset) + ((1.0 - alpha_hp) * raw_ir);
float ac_component = raw_ir - dc_offset;
// 2. LOW-PASS FILTER (Smooths high-frequency muscle tremors)
filtered_signal = (alpha_lp * ac_component) + ((1.0 - alpha_lp) * filtered_signal);
// Output to the Arduino IDE Serial Plotter to visualize a clean PPG wave
Serial.print("Raw_AC:");
Serial.print(ac_component); // For reference
Serial.print(",");
Serial.print("Filtered_AC:");
Serial.println(filtered_signal);
} else {
// Sensor is off the skin
Serial.println("No Signal (Place sensor against skin)");
dc_offset = 0;
filtered_signal = 0;
}
delay(10); // Matches the loop execution to the ~100Hz effective sampling rate
}
B. Physical Optical Isolation
3D Print a Matte Black Enclosure: Your custom casing must include a physical wall separating the LEDs from the photodetector on the MAXREFDES117 PCB. This prevents optical crosstalk (light traveling sideways through the plastic enclosure directly into the sensor without entering the skin).
Use a Black Foam Gasket: Place a small ring of dense, black neoprene foam or rubber around the sensor perimeter. When strapped to the body, it compresses and blocks external light leaks entirely.
Stabilization of Mechanical Contact Pressure
PPG signal response to contact pressure follows a bell-shaped (U-shaped) curve:
- Too Loose: The sensor records air movements, ambient light leaks, and loses contact immediately during movement.
- Too Tight: The sensor compresses the local capillaries, blocking microvascular blood flow entirely. This causes the PPG amplitude to vanish.
To achieve consistent, optimal pressure (optimum transmural pressure), use these mechanical techniques:
- Elastic Hook-and-Loop (Velcro) Band: Avoid stiff, solid plastic watch bands. Use an elastic material that stretches slightly to absorb muscle expansions (e.g., when making a fist) while keeping the sensor tension uniform.
- Spring-Loaded Module Housing: Design an enclosure where the MAXREFDES117 PCB sits on top of a soft miniature spring or silicone sponge cushion inside the strap capsule. This maintains a light, continuous push against the skin, regardless of how tightly the main strap is pulled.
- Double-Sided Medical Adhesive Tape: If testing on the forehead or forearm, using biocompatible, hypoallergenic double-sided medical tape provides the cleanest signal. Cutting a hole for the optics and adhering the sensor directly to the skin completely eliminates motion artifacts.
Non-Blocking STM32 Architecture (C/HAL) and SpO₂ Processing
To calculate SpO₂, you must extract the AC and DC values for both the Red and IR channels simultaneously to compute the Ratio of Ratios (R):
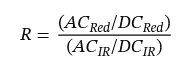
Polling the sensor using delay() fails on STM32 because the sampling intervals must be mathematically uniform. Instead, connect the INT pin of the MAXREFDES117 to an STM32 GPIO External Interrupt (EXTI) pin. When the sensor fills its FIFO, it pulls the INT pin low, triggering the STM32 to fetch data via I2C asynchronously.
Here is the implementation of the SpO₂ extraction algorithm in C for STM32:#include "main.h"
#include <math.h>
#define BUFFER_SIZE 100 // Window size (100 samples = 1 second at 100Hz effective sampling)
// Global filter variables (separated for Red and IR channels)
float dc_red = 0.0f;
float dc_ir = 0.0f;
const float alpha = 0.98f; // IIR low-pass coefficient to isolate the DC baseline
// Sliding buffers for AC wave analysis
float ac_red_buffer[BUFFER_SIZE];
float ac_ir_buffer[BUFFER_SIZE];
uint16_t buffer_index = 0;
extern I2C_HandleTypeDef hi2c1; // Assumes your STM32 HAL I2C setup
/**
* @brief Processes a single raw sample packet (called inside your non-blocking main loop when INT fires)
*/
void Process_PPG_Sample(uint32_t raw_red, uint32_t raw_ir)
{
// 1. Extract the DC component using an IIR Low-Pass Filter
dc_red = (alpha * dc_red) + ((1.0f - alpha) * (float)raw_red);
dc_ir = (alpha * dc_ir) + ((1.0f - alpha) * (float)raw_ir);
// 2. Isolate the AC component by removing the DC offset
float ac_red = (float)raw_red - dc_red;
float ac_ir = (float)raw_ir - dc_ir;
// 3. Store the filtered AC waves into the analysis arrays
ac_red_buffer[buffer_index] = ac_red;
ac_ir_buffer[buffer_index] = ac_ir;
buffer_index++;
// 4. Once the window is full (1 second of data), compute SpO2
if (buffer_index >= BUFFER_SIZE)
{
// Proximity validation: Ensure the sensor is actually resting on tissue
if (dc_red > 50000.0f && dc_ir > 50000.0f)
{
Calculate_SpO2(dc_red, dc_ir);
}
buffer_index = 0; // Reset window index
}
}
/**
* @brief Calculates SpO2 using Peak-to-Peak amplitudes of the collected AC waves
*/
void Calculate_SpO2(float dc_r, float dc_i)
{
float min_red = 999999.0f, max_red = -999999.0f;
float min_ir = 999999.0f, max_ir = -999999.0f;
// Locate the peaks and troughs within the 1-second window
for (int i = 0; i < BUFFER_SIZE; i++)
{
if (ac_red_buffer[i] > max_red) max_red = ac_red_buffer[i];
if (ac_red_buffer[i] < min_red) min_red = ac_red_buffer[i];
if (ac_ir_buffer[i] > max_ir) max_ir = ac_ir_buffer[i];
if (ac_ir_buffer[i] < min_ir) min_ir = ac_ir_buffer[i];
}
// Determine Peak-to-Peak amplitudes (AC component size)
float ac_r_p2p = max_red - min_red;
float ac_i_p2p = max_ir - min_ir;
if (ac_i_p2p > 0 && dc_r > 0)
{
// Compute the Ratio of Ratios (R)
float R = (ac_r_p2p / dc_r) / (ac_i_p2p / dc_i);
// Empirical calibration curve equation: SpO2 = A - B * R
// Generic medical constants for MAX30102 on fingertips: A = 104.0, B = 17.0
float spo2 = 104.0f - (17.0f * R);
// Constrain to realistic physiological limits
if (spo2 > 100.0f) spo2 = 100.0f;
if (spo2 < 60.0f) spo2 = 60.0f;
// Print output to UART or send to an integrated OLED display
printf("Calculated SpO2: %.2f %%\r\n", spo2);
}
}
Calibrating the SpO₂ Curve for Wrist Placement
The default linear equation used above (SpO2 = 104.0 - 17.0 ⋅ R) is calibrated for fingertips, where light easily reflects off dense, shallow capillary beds. Leaving this unchanged for a wrist monitor will yield inaccurate, drifting numbers.
To fix this, developers utilize a second-degree polynomial calibration curve:
Calibration Procedure:
- Attach a certified, medical-grade reference pulse oximeter to the subject's fingertip.
- Mount your STM32-driven MAXREFDES117 device securely to their wrist, outputting the raw, uncalibrated values of R over UART.
- Have the subject safely induce a minor drop in oxygen saturation (e.g., holding their breath for 30–40 seconds until the medical finger oximeter registers a drop down to ~93-94%).
- Log the data pairs: the true SpO2 from the medical device alongside the raw value of R calculated by your STM32 at that exact second.
- Import the log into Excel, MATLAB, or a Python script and apply a polynomial regression fit (Polynomial Fit / Linear Regression). This will generate custom A, B, and C coefficients unique to your custom wrist band assembly and housing pressure.
Complete Source Code (src/main.cpp)
Here is the final, stable, and production-ready C++ firmware for PlatformIO:
#include <Arduino.h>
#include <Wire.h>
#include "MAX30105.h"

MAX30105 particleSensor;

// Pulse detection and BPM averaging variables
unsigned long lastBeat = 0;
long lastFilteredIR = 0;
int beatAvg = 0;
const int RATE_SIZE = 8;
byte rates[RATE_SIZE];
byte rateSpot = 0;

// Digital filter variables (DC Removal / High-Pass Filter)
float dcVal = 0;
const float alpha = 0.95; // Smoothing factor for IIR filter

// Startup stabilization (Warm-up phase)
unsigned long fingerTouchTime = 0;
bool isFilterStable = false;

// Transmission interval control
unsigned long lastPrintTime = 0;
const long printInterval = 500; // Send JSON frame every 500 ms

void setup() {
  Serial.begin(115200);
  delay(1000);
  Serial.println("--- STM32 PULSE OXIMETER SYSTEM (MAX30102) ---");

  Wire.begin();

  // Initialize MAX30102 sensor via I2C
  if (!particleSensor.begin(Wire, I2C_SPEED_FAST)) {
    Serial.println("{\"error\": \"MAX30102 not found! Check wiring.\"}");
    while (1);
  }

  // Sensor configuration:
  // LED Brightness = 60, Sample Averaging = 4, Mode = 2 (Red + IR),
  // Sample Rate = 400 Hz, Pulse Width = 411 us, ADC Range = 4096
  particleSensor.setup(60, 4, 2, 400, 411, 4096);
  Serial.println("{\"status\": \"Sensor ready. Place your finger.\"}\n");
}

void loop() {
  // Process sensor FIFO buffer in a non-blocking manner
  particleSensor.check();

  if (particleSensor.available()) {
    long rawIR = particleSensor.getIR();
    long rawRed = particleSensor.getRed();
    particleSensor.nextSample();

    // 1. Check finger presence on sensor
    if (rawIR < 50000) {
      if (millis() - lastPrintTime > 1000) {
        Serial.println("{\"status\": \"No finger on sensor\"}");
        lastPrintTime = millis();
      }
      beatAvg = 0;
      isFilterStable = false;
      dcVal = 0; // Reset filter state when finger is removed
      return;
    }

    // 2. Filter warm-up stabilization phase after finger contact (1.5 seconds)
    if (!isFilterStable) {
      if (fingerTouchTime == 0) {
        fingerTouchTime = millis();
        dcVal = rawIR; // Seed the filter state with initial raw reading
      }

      // Warm up filter state in the background
      dcVal = (alpha * dcVal) + ((1.0 - alpha) * (float)rawIR);

      if (millis() - fingerTouchTime > 1500) {
        isFilterStable = true; // Warm-up complete, ready for pulse detection
      }
      return;
    } else {
      fingerTouchTime = 0;
    }

    // 3. Motion Artifact Detection (sudden amplitude delta monitoring)
    static long previousRawIR = rawIR;
    long irDelta = abs(rawIR - previousRawIR);
    previousRawIR = rawIR;

    if (irDelta > 8000) { // Safety threshold for sudden movement/jerk
      if (millis() - lastPrintTime > 500) {
        Serial.println("{\"status\": \"Motion detected - keep finger still\"}");
        lastPrintTime = millis();
      }
      return; // Skip sample to prevent corrupted BPM readings
    }

    // 4. Digital High-Pass Filter (DC Removal)
    dcVal = (alpha * dcVal) + ((1.0 - alpha) * (float)rawIR);
    float filteredIR = (float)rawIR - dcVal;

    // 5. Peak Detection & Moving Average BPM Calculation
    unsigned long currentTime = millis();
    static bool falling = false;
    static float peakValue = 0;

    if (filteredIR > lastFilteredIR) {
      if (falling) falling = false;
      if (filteredIR > peakValue) peakValue = filteredIR;
    } else if (filteredIR < lastFilteredIR) {
      if (!falling && (peakValue - filteredIR > 10.0)) { // Peak threshold limit
        falling = true;

        long delta = currentTime - lastBeat;
        if (delta > 300 && delta < 2000) { // Valid HR pulse interval (30 to 200 BPM)
          long beatsPerMinute = 60000 / delta;
          if (beatsPerMinute > 45 && beatsPerMinute < 180) { // Plausible HR range
            rates[rateSpot++] = (byte)beatsPerMinute;
            rateSpot %= RATE_SIZE;

            beatAvg = 0;
            for (byte x = 0; x < RATE_SIZE; x++) {
              beatAvg += rates[x];
            }
            beatAvg /= RATE_SIZE;
          }
        }
        lastBeat = currentTime;
        peakValue = filteredIR;
      }
    }
    lastFilteredIR = filteredIR;

    // 6. Empirical SpO2 Estimation based on Red/IR Ratio
    int estimatedSpO2 = 0;
    if (rawIR > 100000 && rawRed > 50000) {
      float ratio = (float)rawRed / (float)rawIR;
      float spo2Calc = 110.0 - (25.0 * ratio);

      if (spo2Calc > 95.0 && spo2Calc <= 100.0) estimatedSpO2 = 98;
      else if (spo2Calc > 90.0) estimatedSpO2 = 96;
      else estimatedSpO2 = 93;
    }

    // 7. Data streaming via USB CDC in JSON format every 500 ms
    if (millis() - lastPrintTime >= printInterval) {
      Serial.print("{\"bpm\": ");
      Serial.print(beatAvg > 0 ? beatAvg : 0);
      Serial.print(", \"spo2\": ");
      Serial.print(beatAvg > 0 ? estimatedSpO2 : 0);
      Serial.print(", \"filtered_ir\": ");
      Serial.print(filteredIR, 2);
      Serial.println("}");

      lastPrintTime = millis();
    }
  }
}
Output Data Stream Example
Structured JSON formatting allows seamless integration with external dashboard apps or Python visualization scripts:
JSON

{"bpm": 73, "spo2": 98, "filtered_ir": 4425.22}
{"bpm": 73, "spo2": 98, "filtered_ir": 3095.70}
{"status": "Motion detected - keep finger still"}
{"bpm": 73, "spo2": 98, "filtered_ir": 935.17}
Impact of Sensor Application Site on PPG Signal Quality and SpO₂ Measurements
Placing the MAXREFDES117 sensor (based on the MAX30102 photoplethysmography (PPG) chip) on different parts of the body has a crucial impact on the accuracy, signal strength, and stability of heart rate and pulse oximetry (SpO2) results. Since the sensor operates on a reflective method (reflection of red and infrared light from blood vessels), the results directly depend on skin thickness, the degree of blood perfusion (tissue perfusion), and the susceptibility of a given site to movement.
Below is an overview of how specific locations affect measurements:
1. Fingertip – Highest Accuracy
- Impact on results: Provides the strongest and most stable PPG signal. Fingertips are densely vascularized (high perfusion), and capillaries are located close to the skin's surface
- Characteristics: An ideal location for calibration and algorithm testing.
- Disadvantages: Highly susceptible to motion artifacts. Any finger twitch drastically falsifies the heart rate and SpO2 readings. Requires remaining motionless and maintaining constant, light pressure (too much pressure blocks blood flow, resulting in a zero reading).
2. Earlobe – Great Alternative
- Impact on results: Yields a very clean pulse signal, comparable in quality to the finger.
- Characteristics: The earlobe has thin skin and no muscle tissue, minimizing interference caused by muscle contractions. It is also less susceptible to whole-body movements than the hand.
- Disadvantages: Harder to attach the sensor (requires a clip). In low temperatures, rapid vasoconstriction occurs here, which can drastically reduce signal amplitude and make SpO2 readings impossible.
3. Forehead – High Clinical Precision
- Impact on results: Studies show that placing the MAX30102 sensor on the forehead achieves over 99% accuracy in SpO2 measurements compared to stationary devices.
- Characteristics: Blood circulation in the forehead area (supratrochlear artery) is exceptionally stable and less prone to weakening during shock or body cooling. This site works great for sleep monitoring systems.
- Disadvantages: Requires thorough cleansing of the skin from sebum and complete blocking of ambient light (the sensor must be covered, e.g., with a headband).
4. Wrist and Forearm – Most Problematic
- Impact on results: The signal is significantly weaker (low amplitude), and heart rate and blood oxygenation results are most susceptible to errors
- Characteristics: Although this is the default location for smartwatches, skin on the wrist is thicker, and arteries and capillaries lie deeper.
- Disadvantages: The standard, simplified algorithm provided by the manufacturer for Arduino/mbed boards (which processes small data packets at a sampling rate of 25–100 samples per second) typically fails to read SpO2 on the wrist. To obtain correct results here, it is necessary to apply advanced digital filters to filter out noise and press the strap very firmly against the skin.
Summary of Physical Parameters of the Application Site:
| Body Part | Signal Strength (Perfusion) | Susceptibility to Interference (Motion) | Suitability for Default MAXREFDES117 Algorithm |
| Fingertip | Very High | High | Ideal (Recommended for testing) |
| Earlobe | High | Low | Very Good |
| Forehead | High | Very Low | Very Good (Requires light isolation) |
| Wrist | Low | Very High | Poor (Requires code modification and noise filtering) |
Main rule: If you are building a prototype using the default source code from Analog Devices / SparkFun libraries, stick to the finger or earlobe. Choosing the wrist will force you to deeply modify the software and filter out noise associated with movement and tissue thickness.
Measures Implemented to Mitigate Measurement Issues
Optimization of Sensor Operating Parameters and Registers
Default settings provided by basic programming libraries (such as SparkFun or Maxim Integrated) prioritize energy saving, which results in insufficient measurement resolution. To enable light to penetrate deeper tissue layers in diagnostically challenging locations, the chip's register parameters were modified:
-
Increasing optical power and resolution: In the setup configuration section (
setup()), the LED supply current was increased (parameterledBrightnessset to0x3F, corresponding to a range of approx. 12.6 mA to 50 mA) and the pulse duration was extended (pulseWidth = 411, corresponding to 411s). This achieved the maximum 18-bit analog-to-digital converter (ADC) resolution (for comparison, the lowest resolution is 15-bit at 69s). Higher resolution is crucial for the wrist, as it allows the system to capture very small changes in light reflection that are heavily attenuated by thicker skin. -
Raising the sampling rate and hardware filtering: The sampling rate (
sampleRate) was increased to 400Hz (available ranges span from 50H to 3200Hz). A higher SPS significantly improves the precision of PPG waveform shape detection. Additionally, hardware-level sample averaging was enabled (sampleAverage = 4from available options of 1, 2, 4, 8, 16, 32). This smooths the signal and removes minor high-frequency noise before data is transferred to the microcontroller. The sensor was configured in dual mode (ledMode = 2), activating both the red and infrared LEDs, which is necessary for simultaneous heart rate and blood oxygen saturation (SpO2) measurements.
For locations like the wrist, the "golden rule" configuration adopted was sampleRate = 400 or 800 at pulseWidth = 411.
Elimination of Ambient Light Interference
Although the MAX30102 chip features a built-in hardware Ambient Light Cancellation (ALC) system—which works by measuring background light when LEDs are turned off and subtracting it from the actual measurement—strong or fluctuating illumination (e.g., sunlight or 50Hz/60Hz fluorescent flicker) can saturate the ADC. This problem was addressed through a dual-track approach:
Software Filtering (High-Pass Filter – HPF)
Both ambient light and slow movement of the sensor across the skin cause baseline wander (drift of the isoelectric line). A digital high-pass filter (IIR / simple exponential filter or Butterworth filter) with a coefficient of alpha = 0.95 (within the 0.90–0.99 range) was implemented in the code. This filter calculates the DC component (dc_offset) and subtracts it from the raw reading (raw_sample), effectively cutting off signal drift and leaving only a clean, pulsating AC component that reflects blood vessel activity.
Physical Optical Isolation
-
Dedicated 3D-printed enclosure with a partition: An enclosure printed from black, matte filament (PLA/PETG) was used, featuring a physical wall (partition) separating the emitting LEDs from the photodetector on the MAXREFDES117 board. This partition makes direct contact with the skin and completely eliminates optical crosstalk (light passing directly from the LEDs to the sensor through the plastic or the top layer of skin, bypassing blood vessels).
-
Foam sealing: A sealing ring made of thin, dense, black neoprene foam (or rubber) was placed around the sensor. When the module is pressed against the skin (e.g., on the forehead or wrist), the foam forms a tight barrier, cutting off external light ingress.
Stabilization of Sensor Pressure on the Skin
The proper pressure force of a PPG sensor follows a bell-shaped curve: too little pressure causes the sensor to register air movement, ambient light, and lose tissue contact upon motion, while too much pressure crushes capillaries and stops blood flow, leading to a complete loss of the PPG waveform.
To achieve and maintain optimum transmural pressure, three structural solutions were implemented:
-
Elastic damping strap: The rigid plastic watch strap was replaced with a neoprene or Velcro band featuring an elastic insert. The elasticity of the material compensates for sudden muscle tension (e.g., when clenching a fist), maintaining constant pressure on the skin.
-
Spring-loaded design in the housing: The sensor board was mounted inside the strap capsule on a soft spring or a piece of silicone foam. As a result, the spring generates a constant, gentle pressing force regardless of how tightly the outer strap is pulled.
-
Medical double-sided tape: For tests on the forehead and a cleaned forearm, a dedicated hypoallergenic double-sided medical tape (such as those used for CGM sensors in diabetes care) was applied. After cutting openings for the LEDs and photodetector, the sensor was taped directly to the skin, which almost entirely eliminated motion artifacts without the need for straps.
9. MAXREFDES117 – JSON Data Acquisition via USB-CDC in LabVIEW
This section describes the implementation of serial communication and data parsing for retrieving sensor telemetry from an STM microcontroller. The firmware transmits structured data frames via USB-CDC using a JSON format (e.g., {"bpm": 73, "spo2": 98, "filtered_ir": 4425.22}).
-
VISA Serial Configuration: Opens and configures the virtual COM port with a baud rate of 115,200 bps, 8 data bits, 1 stop bit, and no flow control.
-
Data Stream Cleaning: Incoming raw strings from
VISA Readare processed through the Trim Whitespace function to strip out hidden carriage return and line feed characters (\r\n), ensuring stable parsing. -
String Scanning: LabVIEW extracts numerical parameters (
bpm,spo2, andfiltered_ir) to feed real-time indicators and logging modules.
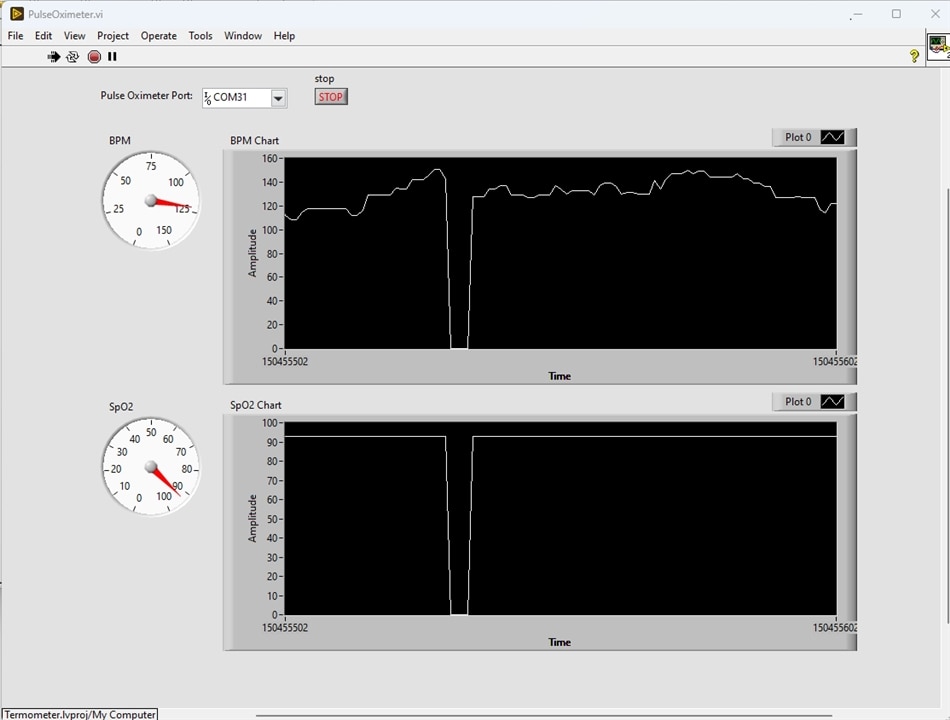
Handling Status Messages and Sensor States
To prevent parsing errors (such as Error 85: Scan failed) when the sensor sends status updates instead of numeric values (e.g., when no finger is detected on the sensor, resulting in {"status": "Brak palca na czujniku"}), specific error-mitigation strategies are applied:
-
Stream Robustness: Modernizing the firmware to output standardized numeric frames (e.g., zeros) during idle or error states ensures continuous and uninterrupted data parsing in LabVIEW.
-
Alternative Conditional Routing: Using string-matching functions (
Match Pattern) allows the application to dynamically detect status strings and safely route them to user interface warning messages without crashing the main acquisition loop.
Real-Time Telemetry Visualization
The user interface leverages native LabVIEW display elements optimized for biomedical signal monitoring:
-
PPG Waveform Monitoring: The floating-point
filtered_irsignal is routed directly into a Waveform Chart, providing a continuous, scrolling historical plot of the photoplethysmogram (PPG) heart pulse wave. -
Vital Signs Indicators:
-
Heart Rate (BPM): Displayed via numeric indicators or custom gauge meters for immediate numerical feedback.
-
Blood Oxygen Saturation (SpO2): Configured with a strict numerical range scaled from 0 to 100 (
Maximum = 100) to accurately reflect standard percentage-based clinical boundaries.
-
Front Panel
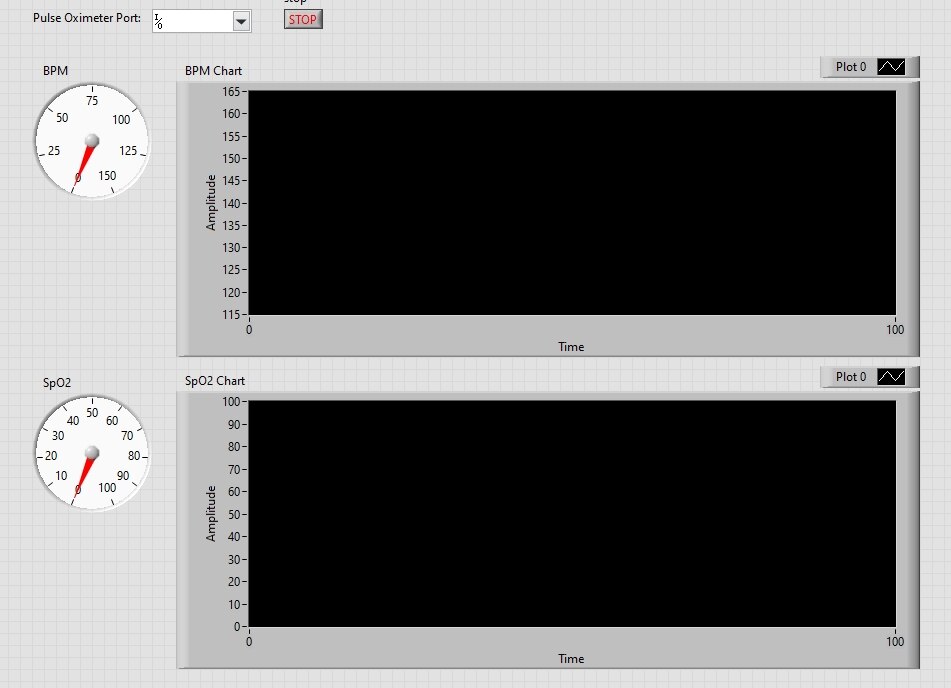
Block Diagram
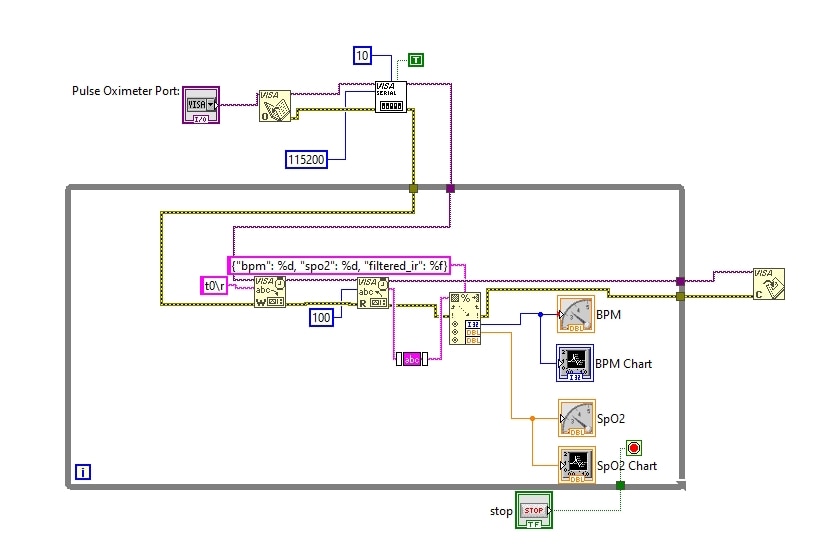
10. Building a Real-Time Sensor Data Visualizer for MAXREFDES117 / USB CDC
When developing embedded systems, Internet of Things (IoT) devices, or biomedical monitoring tools (such as pulse oximeters using the MAXREFDES117 optical sensor), developers frequently encounter a common bottleneck: visualizing telemetry data streaming from a microcontroller. Relying solely on serial console logs or terminal windows is insufficient for diagnostic evaluation, signal processing validation, or user-interface prototyping.
To bridge this gap, a cross-platform desktop application was engineered using C++ and the Qt Framework. The architecture is structured around a decoupled event-driven model that handles serial communication asynchronously, parses lightweight JSON payloads, manages dynamic data buffers, and renders real-time graphical representations using Qt Charts.
Rather than dumping raw text to the screen, the application offers an interactive dashboard featuring live numerical readouts, independent multi-parameter rolling-window charts, layout adaptability, and fault-tolerant parsing mechanisms.
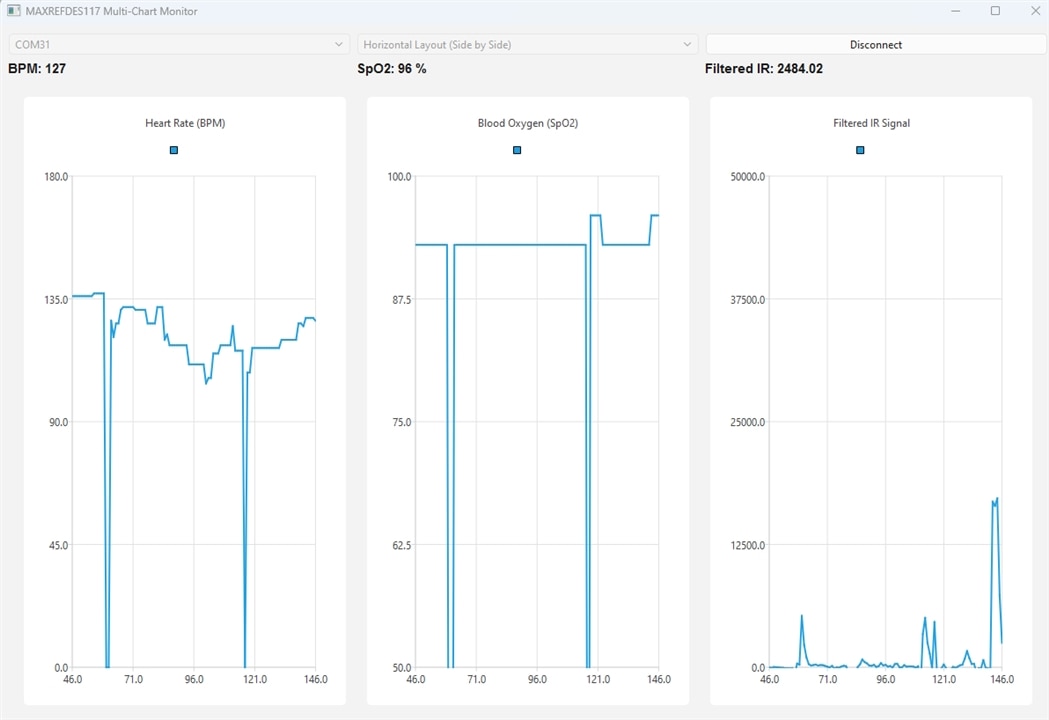
Core Modules and Component Breakdown
The codebase is modularized cleanly into configuration files, header definitions, and implementation logic:
-
MaxRefdesReader.pro(The Build Specification): Configured viaqmake, the project links against essential Qt modules—specificallycore,gui,widgets,serialport, andcharts. It mandates modern C++17 standards to ensure safe memory handling, efficient STL utilization, and clean syntax. -
MainWindowClass (mainwindow.h/mainwindow.cpp): Acting as the central controller, this class inherits fromQMainWindowand orchestrates lifecycle management, user interface layout switching, hardware connectivity states, and serial stream processing.
Key Technical Features & Implementation Details
A. Asynchronous Serial Port Management & Robust Framing
Communication with the target microcontroller occurs over a virtual COM port established via USB CDC (Communications Device Class).
-
Port Discovery: Upon startup, the application queries
QSerialPortInfo::availablePorts()to dynamically populate a dropdown menu with all active hardware and virtual serial interfaces available on the host operating system. -
Stream Handling & Buffer Accumulation: Serial data does not always arrive in neat, atomic packages; packets can be fragmented or batched together. To prevent data corruption or missing frames, the application implements a line-buffered parsing algorithm. Incoming byte arrays are appended to a persistent
QByteArraybuffer (buffer). The application scans this buffer for a newline delimiter (\n), extracts complete lines individually, and strips them from the buffer, ensuring uninterrupted telemetry streams.
B. JSON Deserialization and Data Extraction
The microcontroller transmits sensor data packets formatted as JSON strings (e.g., {"bpm": 72, "spo2": 98, "filtered_ir": 1621.45}).
-
Once a full line is isolated from the serial buffer, it is passed through
QJsonDocument::fromJson(). -
The parser validates whether the document successfully evaluates to a JSON object containing the required keys (
bpm,spo2, andfiltered_ir). -
Validated parameters are extracted as double-precision floating-point numbers, instantly driving both the text label updates and the graphic plotting pipelines.
C. Multi-Chart Architecture with Rolling Windows
To prevent visual clutter, the system avoids plotting conflicting scales on a single chart (since raw/filtered infrared signals span thousands of units, whereas heart rate and blood oxygen operate in much tighter numerical ranges). Instead, it implements three independent charts:
-
Heart Rate (BPM): Tailored for standard physiological ranges.
-
Blood Oxygen (SpO2): Constrained to monitor oxygen saturation shifts.
-
Filtered IR Signal: Configured with a wider dynamic range to capture raw photoplethysmogram (PPG) waveforms.
-
Rolling Window Buffer Mechanism: To prevent memory bloat and application slowdowns over long monitoring sessions, a
pointCountertracks total incoming samples. Once the sample count exceeds 100, the X-axis range dynamically shifts usingaxisX->setRange(pointCounter - 100, pointCounter), creating a real-time sliding-window oscilloscope effect.
D. Dynamic Layout Switching (User Adaptability)
Flexibility in workspace organization is achieved through a dynamic layout manager. Users can toggle a dropdown menu to instantly rearrange the visual presentation:
-
Vertical Layout (Stacked): Positions the three chart views neatly on top of one another, which is ideal for widescreen monitors or detailed waveform inspection.
-
Horizontal Layout (Side by Side): Arranges charts horizontally, maximizing horizontal space resolution.
-
The Underlying Mechanism: When a layout switch is triggered, the application safely detaches the
QChartViewinstances from the active layout container, destroys the old layout manager, instantiates the alternative layout manager, re-inserts the chart widgets, and forces a UI refresh (show()) without losing existing serial connections or historical plot data.
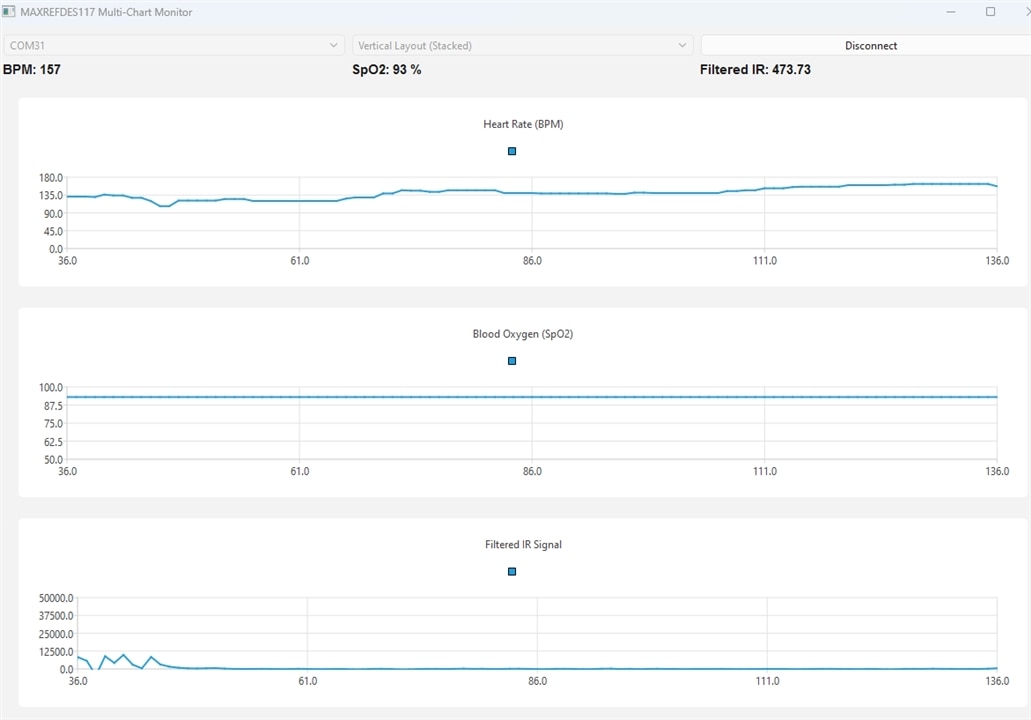
Summary of Benefits & Extensibility
By leveraging Qt's mature graphics rendering pipeline and robust hardware abstraction layers (QSerialPort), this application transforms a basic microcontroller sensor setup into a professional-grade telemetry suite.
The architecture is deliberately built for extension. Future enhancements can easily integrate features such as:
-
Data Logging: Exporting buffered stream arrays directly into CSV files for post-processing in Python or MATLAB.
-
Threshold Alerts: Triggering visual or auditory alarms if
bpmorspo2breach critical safety margins. -
Automatic Y-Axis Scaling: Implementing dynamic auto-scaling algorithms for adaptive signal tracking.
11. Research Workstation System Architecture
The stationary research workstation is designed for precise, simultaneous, real-time monitoring of selected human physiological parameters (photoplethysmography, heart rate, oxygen saturation, and clinical-grade body temperature).
The system integrates high-performance biomedical sensor modules, each managed by its own dedicated microcontroller (STM32 for the optical sensor and the MAX32630FTHR ARM Cortex-M4F board for the temperature sensor), combined with a hybrid PC software architecture:
-
LabVIEW handles multi-channel data acquisition, synchronization, and real-time Digital Signal Processing (DSP).
-
Qt provides a modern, responsive Desktop User Interface (UI/UX), database management, and session reporting tools.
Hardware Architecture (Hardware Layer)
The measurement layer is split into two independent embedded subsystems that stream data to the host PC:
-
Subsystem 1: MAXREFDES117 + STM32 Microcontroller:
-
Sensor: MAXREFDES117 (integrating the MAX30102 optical sensor for Red and IR photoplethysmography).
-
MCU: An STM32 microcontroller communicating with the sensor via I2C.
-
Function: Samples optical reflections at high frequency (100 Hz – 400 Hz), buffers the raw PPG data, and streams formatted packets over its dedicated USB Virtual COM port.
-
-
Subsystem 2: MAX30208EVSYS + MAX32630FTHR Board:
-
Sensor: MAX30208EVSYS evaluation system featuring the MAX30208 clinical temperature sensor (+/-0.1ºC accuracy).
-
MCU: MAX32630FTHR development platform (ARM Cortex-M4F @ 96 MHz) communicating with the MAX30208 via I2C.
-
Function: Measures high-resolution contact skin temperature and transmits readings over its integrated USB Virtual COM port.
-
Overall System Block Diagram
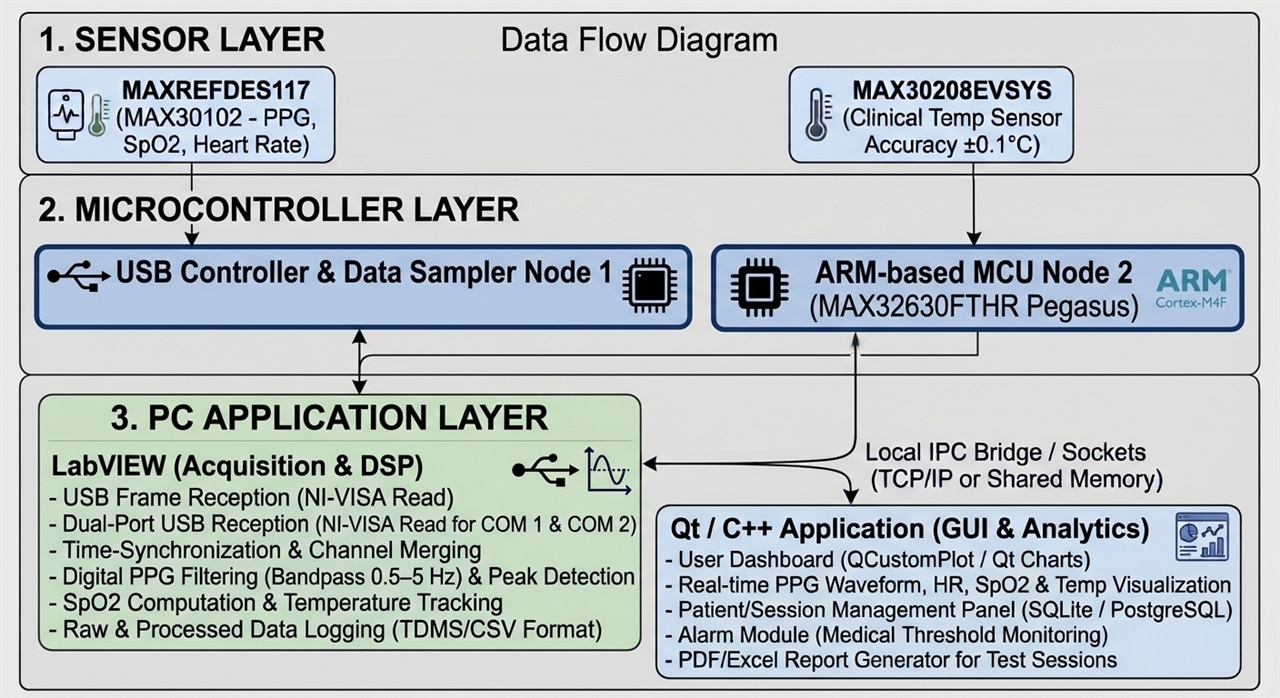
Detailed Layer Description
Layer 1: Physical / Sensor Layer (Hardware)
-
MAXREFDES117:
-
Interface: I2C.
-
Measured Quantities: Raw reflected/absorbed light intensity for Red and Infrared wavelengths.
-
Function: Provides raw optical data required to reconstruct the PPG waveform, calculate HR, and derive SpO2
-
-
MAX30208EVSYS:
-
Interface: I2C.
-
Measured Quantities: High-resolution digital body temperature (20-bit ADC).
-
Function: Delivers stable, continuous skin temperature measurement.
-
Layer 2: Conversion & Transmission (Embedded Firmware)
-
Microcontroller Tasks:
-
Polls the MAX30102 FIFO registers and MAX30208 temperature registers at a configurable sampling rate (100 Hz – 400 Hz for PPG).
-
Applies precise timestamps to each assembled data packet.
-
Formats frame payloads (e.g.,
[HEADER][TIMESTAMP][RED][IR][TEMP][CHECKSUM]). -
Transmits framed data over USB CDC (Virtual COM Port).
-
Layer 3: Acquisition & Analysis Engine (LabVIEW Backend)
-
Acquisition: Utilizes NI-VISA to read incoming serial streams from the COM port and unpack channels.
-
Digital Signal Processing (DSP):
-
Filtering: Bandpass filtering (Butterworth, e.g., 0.5–5.0 Hz) to eliminate motion artifacts, baseline wander (respiration), and high-frequency noise.
-
HR/HRV Algorithm: Detects PPG waveform peaks to determine peak-to-peak (RR/PP) intervals and Heart Rate Variability (HRV).
-
SpO2 Algorithm: Computes the AC/DC ratio of Red vs. IR signals
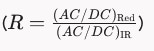
to evaluate blood oxygen saturation levels.
-
Archiving: Streams raw and processed signals into binary TDMS files optimized for high-speed time-series data.
-
-
IPC Interface: Serves processed metrics to the Qt desktop app in real time via a local TCP/IP socket.
Layer 4: User Interface & Database Layer (Qt Desktop UI)
-
TCP/IP Client (
QTcpSocket): Receives data packages from the LabVIEW server. -
Visualization (GUI):
-
Real-time rendering of PPG waveforms and temperature trends via plotting widgets (
QCustomPlot/Qt Charts). -
Numerical LCD/Gauge indicators for HR, SpO2, and Temperature.
-
-
Database Management (
Qt SQL):-
Session cataloging linked to patient IDs, timestamps, and clinical notes.
-
-
Business Logic:
-
Two-tier alarm thresholds (Warning / Critical) monitoring for bradycardia, tachycardia, hypoxia, or fever.
-
Automated generation of session summary reports (PDF export).
-
Data Flow Summary
-
Sensors continuously capture optical reflection and temperature readings.
-
Microcontrollers aggregate I2C data, timestamps packets, and streams frames over USB.
-
LabVIEW receives the stream, parses channels, filters noise, and computes physiological parameters.
-
Qt Application receives processed parameters over IPC, displays real-time plots, alerts operators to anomalies, and logs records to the database.
Summary of Subsystem Integration
| Parameter / Feature | Subsystem 1 (Optical / PPG) | Subsystem 2 (Temperature) |
| Sensor Module | MAXREFDES117 (MAX30102) | MAX30208EVSYS (MAX30208) |
| Target Controller | STM32 Microcontroller | MAX32630FTHR (ARM Cortex-M4F) |
| Physical Interface | I2C | I2C |
| PC Transport | USB Virtual COM Port 1 | USB Virtual COM Port 2 |
| LabVIEW Processing | Filtering, Peak Detection, HR/HRV, SpO2 | Moving average filter, thermal trend calculation |
| Qt UI Display | Dynamic PPG plot, numerical HR & SpO2 | Live temperature trend curve & LCD indicator |
12. Combined Pulse Oximeter & Temperature Monitoring System in LabVIEW
The culmination of this project is a unified LabVIEW application that simultaneously acquires, processes, and visualizes multi-sensor biomedical data. By merging the serial communication streams from both the STM-based pulse oximeter (USB-CDC JSON telemetry) and the MAX30208EVSYS temperature sensor, the system provides a comprehensive patient monitoring dashboard.
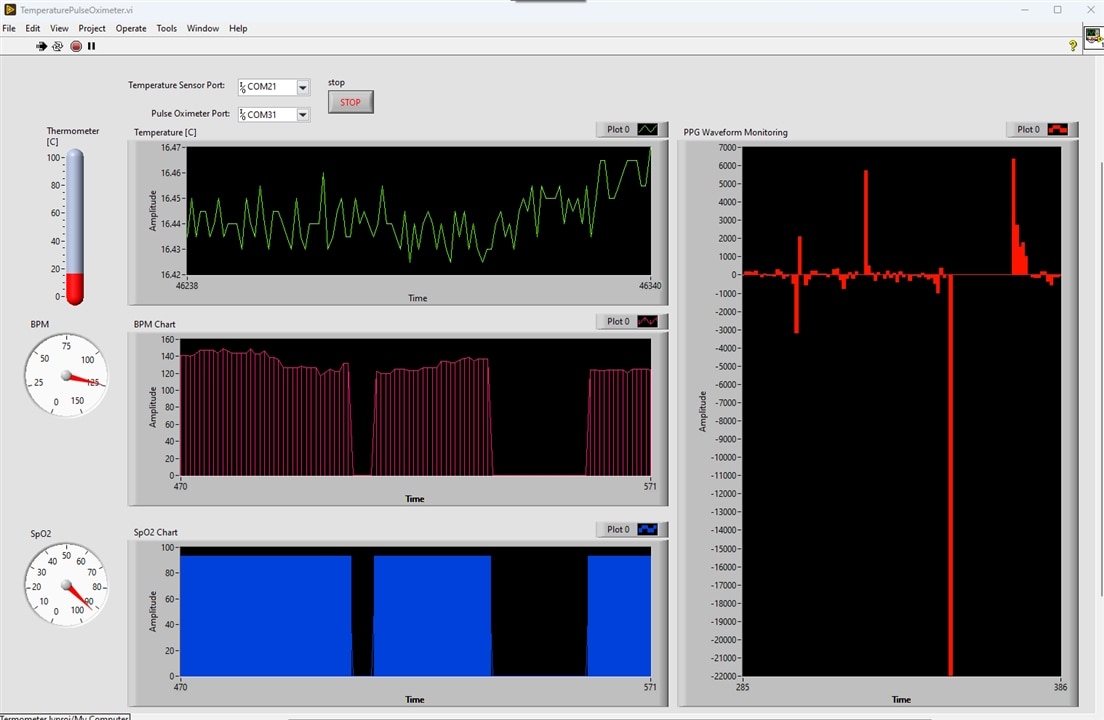
Multi-Device Architecture & Parallel Acquisition
-
Independent COM Ports: The application manages dual serial connections using NI-VISA sessions running concurrently or sequentially within a structured architecture (such as a Producer-Consumer pattern or parallel
While Loops). -
Stream Synchronization: Combines the temperature sensor's polling command (
t0\r) with the continuous JSON data stream ({"bpm": ..., "spo2": ..., "filtered_ir": ...}) sent by the STM microcontroller.
Data Parsing & Robustness
-
Unified String Cleaning: Both input streams utilize Trim Whitespace to strip hidden carriage return and line feed characters (
\r\n), preventing parsing faults. -
Error Prevention: Firmware optimizations ensure that idle or error states (such as missing sensor contact) output standardized numeric frames instead of text strings, eliminating Error 85 (Scan Failed) occurrences.
Combined Front Panel & Analytics Dashboard
-
Dual Visualization:
-
Displays real-time photoplethysmogram (PPG) waveforms (
filtered_ir) alongside continuous body temperature trends on synchronized Waveform Charts. -
Features dedicated vital signs indicators, including digital gauges for Heart Rate (BPM), SpO2 percentage scaled from 0 to 100, and precise temperature readouts.
-
-
Statistical Processing: Utilizes internal Formula Nodes and shift registers to calculate real-time statistical averages, minimums, and maximums for thermal data.
Front Panel
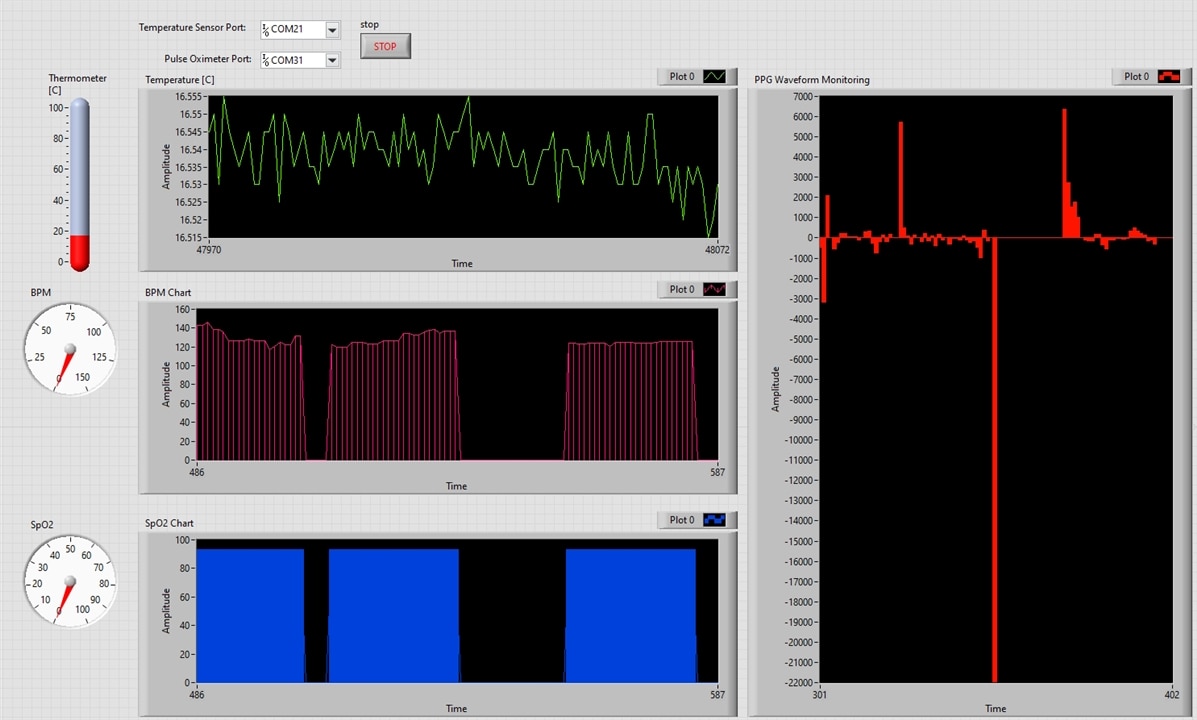
Block Diagram
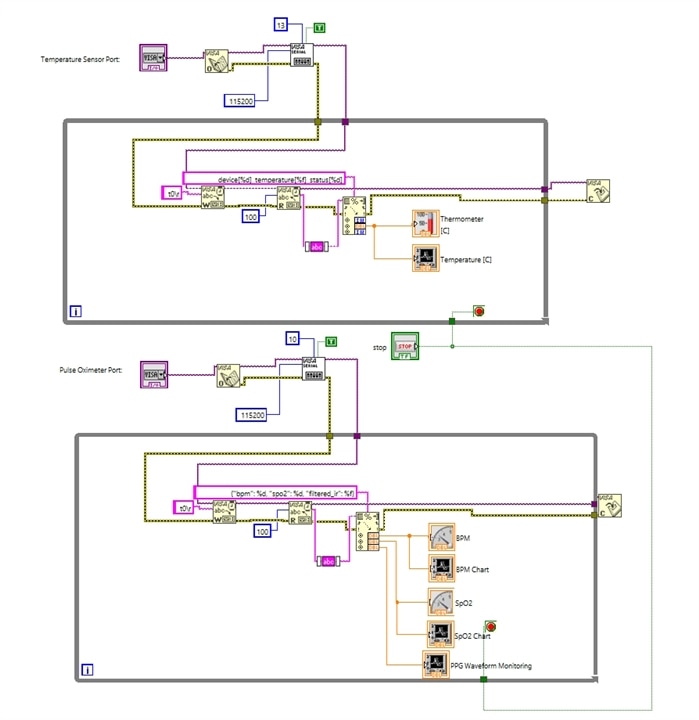
13.Dual-Port Biomedical Telemetry Dashboard - Integrating STM32 (MAXREFDES117) and MAX30208EVSYS in C++ and Qt
In this part, we will explore how to design and implement a robust, multi-threaded cross-platform desktop application using C++ and Qt 6. This application manages two independent serial ports simultaneously, parses real-time JSON payloads, implements the authentic MAX30208 command-line protocol, and renders responsive, live multi-parameter charts.
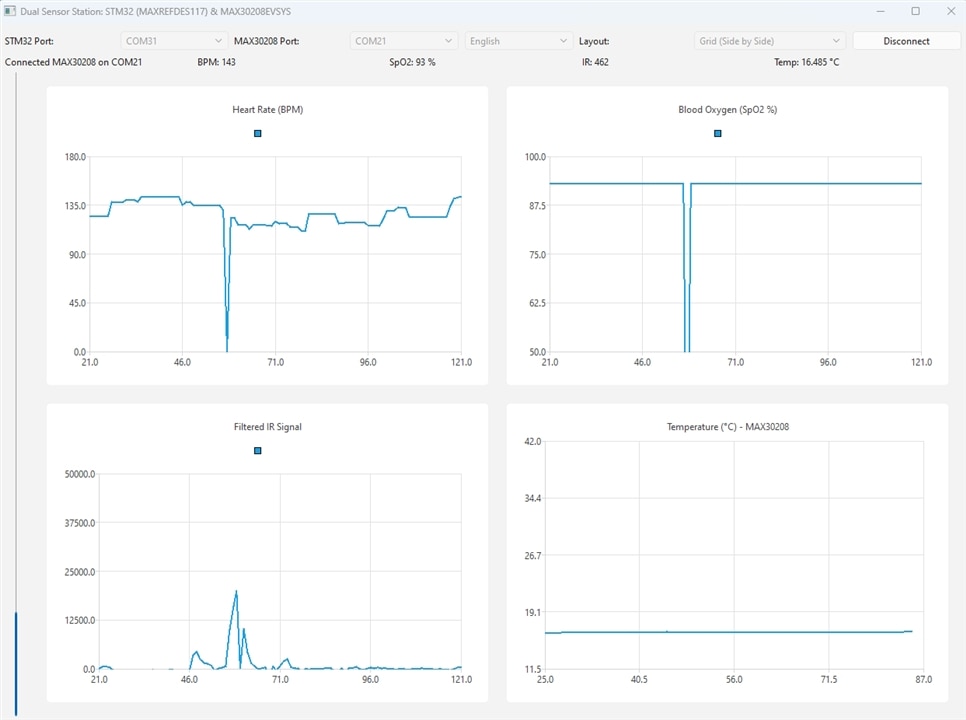
A prime example of this engineering feat is a robust, cross-platform desktop application developed in C++ and Qt 6 designed to simultaneously monitor, parse, and visualize telemetry data from two independent hardware sensor modules over separate serial ports.
At the core of this system lies a sophisticated Dual-Port Asynchronous Architecture. The STM32 / MAXREFDES117 stream operates asynchronously on the main GUI thread via QSerialPort::readyRead, continuously capturing and parsing high-frequency JSON packets containing Heart Rate (bpm), Blood Oxygen (spo2), and Filtered Infrared (filtered_ir) signals. In parallel, the MAX30208EVSYS protocol link is managed inside a dedicated background QThread using a thread-safe SerialWorker class. This module communicates via a command-based protocol (s, t, r, w) to fetch precise thermal metrics via a non-blocking QTimer, effectively isolating blocking operations and maintaining optimal UI frame rates.
Beyond backend communication, the application excels in Real-Time Multi-Parameter Visualization powered by Qt Charts. It features four independent live charts tracking BPM, SpO2, Filtered IR, and Temperature, all equipped with a sliding-window buffer that automatically shifts the X-axis after a set threshold of samples. To augment the graphical representation, a vertical thermometer progress bar provides operators with instant visual feedback on thermal variations. Furthermore, Dynamic UI Layout Customization empowers users to switch the dashboard layout at runtime between a Vertically Stacked arrangement and a 2x2 Side-by-Side Grid layout using an intuitive dropdown control.
Usability and data management are further elevated through thoughtful software design patterns. The application incorporates Bilingual Localization (PL / EN), implementing seamless runtime language switching between Polish and English via a dynamic retranslation mechanism (retranslateUi). This instantly updates all interface elements, tooltips, buttons, and chart titles. Concurrently, automated data persistence is handled by CsvLogger, which automatically initiates a timestamped CSV session upon successful device connection, logging elapsed time, device indices, temperatures, and hardware status flags for subsequent post-processing analysis.
Architectural Overview: Two Independent Data Streams
To ensure low latency, thread safety, and freedom from data blockages, the application architecture splits telemetry handling into two distinct pathways:
-
The Sensor Stream (STM32 / MAXREFDES117): Configured via standard USB CDC (115200 baud) nad operates asynchronously on the main GUI thread via
QSerialPort::readyRead, continuously capturing and parsing high-frequency JSON packets containing Heart Rate (bpm), Blood Oxygen (spo2), and Filtered Infrared (filtered_ir) signals. -
The Temperature Protocol Link (MAX30208EVSYS): Based on the evaluation kit's firmware protocol (operating at 115200 baud, 8 data bits, no parity, 1 stop bit). Managed inside a dedicated background
QThreadusing a thread-safeSerialWorkerclass. It communicates via a command-based protocol (s,t,r,w) to fetch precise thermal metrics via a non-blockingQTimer
Technical Implementation
Robust Serial Port Management and Enumeration
The application leverages hardware identification filters to locate devices accurately. For the MAX30208 evaluation kit, the serial layer looks up specific vendor and product IDs (VID_0B6A and PID_0042) using Windows Management Instrumentation (WMI) queries, ensuring reliable plug-and-play identification.
Implementing the MAX30208 Evaluation Kit Protocol
Derived directly from the evaluation kit's firmware communication structure, the custom OT07Serial class maps all core hardware interaction commands:
-
s(Search Command): Scans the I²C bus for connected sensors, returning the device count, I²C addresses, and unique 64-bit ROM codes formatted inside bracketed strings (e.g.,[Index] [Address] [RomCode]). -
t(Temperature Read): Requests active temperature conversions for individual or ranged device indices, parsing floating-point Celsius values and status flags. -
Register Control (
r,w,g): Provides low-level read, write, and bulk configuration dumps across the 24-register memory map of the MAX30208 sensor.
Real-Time Multi-Chart Visualization (Qt Charts)
Plotting high-frequency physiological signals alongside low-frequency thermal data on a single axis causes scaling distortion. To solve this, the application provisions three independent chart panels:
-
Rolling Window Buffer: A sample counter tracks incoming frames. Once limits exceed 100 samples, the X-axis dynamically shifts (
axisX->setRange(...)), creating a clean, sliding oscilloscope effect. -
Layout Adaptability: Users can instantly switch between a vertical stacked layout and a side-by-side horizontal arrangement via an intuitive dropdown menu.
-
Features four independent live charts (BPM, SpO2, Filtered IR, and Temperature) equipped with a sliding-window buffer that automatically shifts the X-axis after a set threshold of samples.
-
Includes a vertical thermometer progress bar providing instant visual feedback on thermal variations.
Dynamic UI Layout Customization
-
Users can switch the dashboard layout at runtime between a Vertically Stacked arrangement and a 2x2 Side-by-Side Grid layout using an intuitive dropdown control.
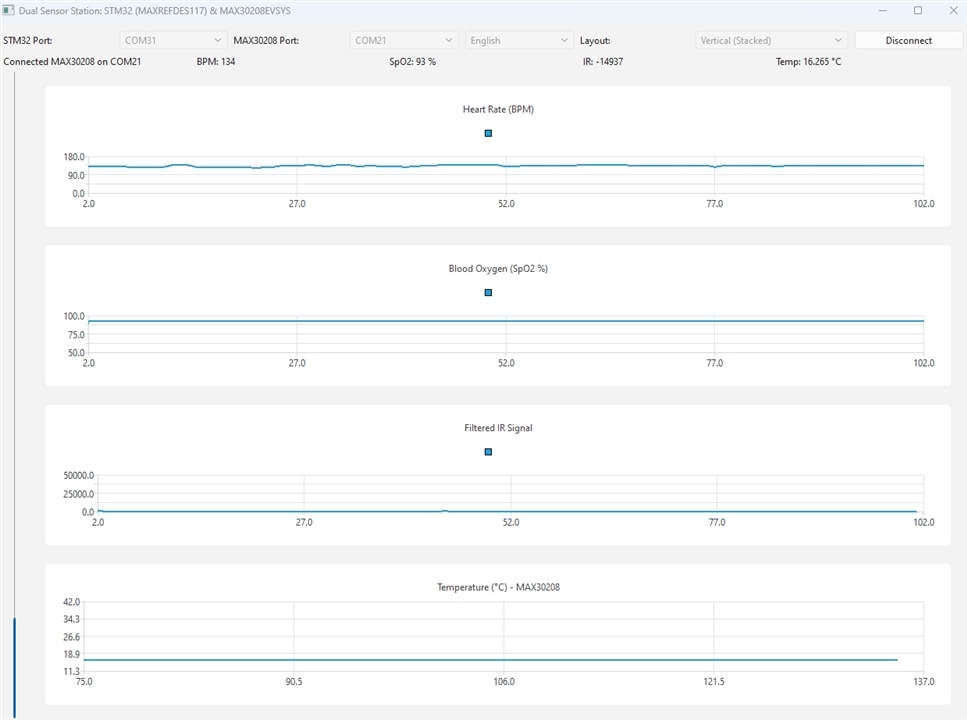
Bilingual Localization (PL / EN)
-
Implements seamless runtime language switching between Polish and English using a dynamic retranslation mechanism (
retranslateUi), instantly updating all interface elements, tooltips, buttons, and chart titles.
Automated Data Logging (CsvLogger)
-
Automatically initiates a timestamped CSV session upon successful device connection, logging elapsed time, device indices, temperatures, and hardware status flags for post-processing analysis.
Integrating disparate hardware protocols into a single, cohesive desktop environment highlights the flexibility of modern C++ and Qt. By separating asynchronous JSON data acquisition from polled command-line protocols, developers can scale telemetry systems easily—transforming raw microcontroller evaluation kits into professional-grade diagnostic dashboards.
14. Effect of Thermal Interface Materials on MAX30208 Temperature Measurements
When evaluating the MAX30208 temperature sensor, it is important to distinguish the sensor's specified measurement accuracy from the performance of the complete measurement assembly. Mechanical mounting, thermal contact, PCB construction, and heat transfer between the sensor and the measured object can all influence the final reading.
The 3M 8810 thermally conductive adhesive transfer tape is one example of a material that may be considered when designing a sensor mounting arrangement. According to the manufacturer's datasheet, the tape is 0.25 mm thick and has a typical thermal conductivity of 0.60 W/(m·K), with a reported thermal impedance of 5.8 °C·cm²/W.
Although the tape facilitates heat transfer and provides mechanical bonding, introducing an additional material layer changes the thermal path between the measured surface and the sensor. Depending on the mounting geometry and environmental conditions, this may affect both the transient response and the temperature difference between the sensor reading and the target surface.
At the same time, a compliant adhesive layer may improve physical contact by reducing microscopic air gaps between surfaces. Its overall effect therefore depends on the complete mechanical and thermal design rather than on thermal conductivity alone.
For the VitalSense project, these considerations highlight the importance of evaluating the temperature sensor as part of the assembled measurement system. Any additional temperature offset or response delay should be determined experimentally under controlled conditions rather than assumed in advance. Calibration or compensation should only be introduced when supported by measurement results.
The MAX30208's specified accuracy of ±0.1°C over the 30°C to 50°C range should therefore be treated as a sensor specification, not as a guarantee of equivalent accuracy for the complete mounted system.
15. Work Completed and Current Results
The development of the VitalSense Desktop R&D Workbench has established the technical foundation for integrating sensor evaluation platforms with PC-based measurement, visualization, and analysis software.
The project focuses on two evaluation platforms from Analog Devices: the MAX30208EVSYS temperature-sensing evaluation system and the MAXREFDES117 optical heart-rate and pulse-oximetry reference design based on the MAX30102 sensor. Together, these platforms provide the basis for investigating temperature measurement and photoplethysmography (PPG) signal acquisition.
Hardware Integration and Communication Architecture
The proposed workstation uses two independent USB-connected interfaces to communicate with the temperature-sensing and optical measurement platforms. This architecture separates the communication channels and allows the two data streams to be investigated independently.
Work on the communication architecture includes examining the methods required to access measurement data, understand device behavior, and establish reliable communication between the evaluation platforms and the host computer.
LabVIEW-Based Instrumentation and Data Acquisition
National Instruments LabVIEW has been used as an instrumentation-oriented environment for investigating communication with the evaluation platforms and exploring measurement data acquisition.
This work supports the examination of device communication, temperature readings, and the requirements for collecting and analyzing sensor data. LabVIEW also provides an environment for developing and evaluating measurement procedures and for investigating alternative approaches to instrument control and data visualization.
The experience gained through LabVIEW-based development provides a useful reference for the design and verification of the dedicated desktop application.
Temperature Measurement
The MAX30208EVSYS provides the temperature-sensing component of the workstation. The work includes investigating the communication interface and the methods required to retrieve, interpret, visualize, and record temperature measurements.
An important consideration is the distinction between the sensor's specified accuracy and the accuracy of the complete measurement system. The latter depends on factors such as the evaluation board, thermal coupling, environmental conditions, measurement procedure, and system-level validation.
PPG Signal Acquisition and Processing
The MAXREFDES117, based on the MAX30102 optical sensor, provides the optical measurement component. Its red and infrared channels are used to acquire PPG signals that can be investigated for heart-rate and blood oxygen saturation (SpO₂) estimation.
The development work includes examining the acquisition of optical samples and the firmware and signal-processing requirements for extracting useful physiological information.
Further development will focus on signal conditioning, heart-rate estimation, signal-quality assessment, and evaluation of SpO₂ estimation algorithms. These algorithms must be validated against appropriate reference measurements before their accuracy can be established.
C++/Qt Desktop Application
A dedicated desktop application is being developed using C++ and Qt to provide a unified environment for measurement acquisition, visualization, data logging, and experimental analysis.
The intended software architecture includes independent communication interfaces, real-time waveform displays, measurement monitoring, and tools for recording experimental data. The application is designed to support systematic investigation of the complete measurement chain, from sensor communication to signal processing and result presentation.
LabVIEW and Qt serve complementary roles in the project: LabVIEW provides an instrumentation-oriented environment for communication and measurement experiments, while Qt offers a flexible foundation for a dedicated desktop research workstation.
Data Logging and System Verification
Reliable data recording is essential for comparing measurement results and evaluating signal-processing algorithms. The workstation's planned data-handling capabilities include preserving measurement records for subsequent analysis and supporting repeatable experimental procedures.
The main verification areas identified for further work include:
-
Communication reliability and recovery from connection errors.
-
Correct acquisition and interpretation of sensor data.
-
Signal quality and the robustness of signal-processing algorithms.
-
Measurement repeatability and response time.
-
Data integrity during continuous acquisition and logging.
-
The distinction between individual sensor specifications and complete-system measurement performance.
These verification activities will help identify system limitations and establish a documented basis for assessing the workstation's performance.
Current Status and Next Steps
The work carried out so far has established the main technical direction for the VitalSense Desktop R&D Workbench, including the selection of measurement platforms, the communication architecture, LabVIEW-based instrumentation work, and the design of a dedicated C++/Qt application.
The next development stage will focus on completing and verifying the data acquisition paths, improving firmware and application robustness, and collecting repeatable measurement results. Additional work will address the evaluation of temperature measurements, PPG signal processing, and the performance of heart-rate and SpO₂ estimation algorithms.
VitalSense remains an experimental engineering research project rather than a clinically validated medical device. The accuracy of the complete measurement system and the reliability of physiological parameter estimates must be established through documented testing and appropriate validation procedures, rather than inferred from individual component specifications.
Future Potential and Applications
Beyond its current scope, VitalSense has the potential to evolve into a modular physiological measurement and signal analysis platform for embedded systems research, biomedical electronics prototyping, and experimental healthcare technology development.
By combining real sensor evaluation hardware with a dedicated PC-based analysis environment, the platform could support the development and testing of signal-processing algorithms, sensor-fusion techniques, data acquisition methods, and embedded firmware for next-generation wearable and remote-monitoring devices. Its modular architecture could also allow additional sensors, microcontroller platforms, and communication interfaces to be integrated as new research requirements emerge.
Potential applications include the evaluation of wearable health-monitoring devices, comparative testing of physiological sensors, development of real-time signal-quality assessment algorithms, investigation of low-power embedded monitoring systems, and prototyping of connected healthcare solutions.
An important long-term objective is to establish a reproducible experimental workflow in which raw sensor data can be acquired, visualized, processed, recorded, and compared against independent reference measurements. This would make VitalSense useful not only as a demonstration platform, but also as a practical engineering workbench for investigating the reliability, limitations, and performance of physiological sensing technologies.
VitalSense is not intended to replace certified medical equipment or provide clinical diagnoses. Instead, its primary goal is to bridge the gap between sensor evaluation boards, embedded firmware development, and PC-based research tools, providing a foundation for future experimentation in biomedical electronics and intelligent health-monitoring systems.
16. Conclusion
The VitalSense Desktop R&D Workbench is being developed as a modular platform for investigating physiological sensors, measurement techniques, and signal-processing algorithms. By combining the MAX30208EVSYS temperature-sensing evaluation system and the MAXREFDES117 optical measurement reference design with PC-based instrumentation and software tools, the project establishes a foundation for systematic experimentation in biomedical electronics.
A key aspect of VitalSense is its focus on the complete measurement chain, including sensor communication, data acquisition, signal visualization, data logging, and algorithm evaluation. Rather than treating sensor readings as final results, the project emphasizes measurement quality, repeatability, and verification against appropriate reference instruments.
Ultimately, VitalSense aims to bridge the gap between sensor evaluation hardware, embedded systems development, and PC-based measurement and analysis tools. Its long-term potential lies in providing a reusable engineering workbench for prototyping, comparing, and experimentally evaluating physiological monitoring technologies.
VitalSense is an experimental engineering research platform, not a clinically validated medical device. Any claims regarding measurement accuracy or diagnostic performance must be supported by appropriate testing and validation.
17. Future Research: Multi-Site Physiological Monitoring
During the development and experimental evaluation of VitalSense, an interesting research direction emerged from observations concerning the influence of sensor placement on optical measurement quality. The performance and stability of PPG signals may vary depending on the anatomical site where the sensor is positioned. This can affect heart-rate estimation and the quality of the signal used for SpO₂ estimation.
This observation raises an important research question: could simultaneous measurements from multiple anatomical sites provide a more comprehensive picture of signal quality and physiological measurement performance?
One possible approach would be to develop a multi-sensor monitoring system in which several optical sensor modules are placed at different locations on the body. Each module would acquire PPG data independently, while a central PC-based workstation would collect, synchronize, visualize, and record the incoming data streams.
The proposed system would enable comparative analysis of measurements obtained from different locations under the same experimental conditions. The research could investigate which sensor positions provide more stable signals, how signal quality changes during movement or changes in sensor contact, and whether information from multiple measurement sites could help identify unreliable readings.
The workstation could also support the development of signal-quality indicators and algorithms for comparing measurements across channels. Heart-rate and SpO₂ estimates would need to be evaluated independently against appropriate reference equipment before any conclusions could be drawn about their accuracy or reliability.
Implementing this concept would introduce additional engineering challenges, including multi-channel data acquisition, synchronization of measurement timestamps, communication with multiple sensor interfaces, motion-artifact analysis, and comparative signal processing.
This multi-site approach is a proposed direction for future research, not a feature currently implemented in VitalSense. It represents a possible next step in the evolution of the project: from a desktop workstation for investigating individual sensor platforms to a research environment for studying how sensor placement influences physiological signal acquisition and measurement reliability.
The objective would not be to assume that more sensors automatically produce better results, but to investigate experimentally whether simultaneous measurements from different anatomical locations can provide useful information that would not be available from a single sensor alone.
