Table of Contents
Part 1: System Concept and Architecture
Part 2 : Sponsored Kit Overview
Part 3 : Alternatives for Heart Rate, SpO₂, and Temperature Sensing
Part 4 : MAX30208EVSYS Evaluation System – Technical Overview & Operation
Part 5 : Reverse-Engineering the MAX30208EVSYS Communication Protocol
Part 6 : Communicating with the MAX30208EVSYS in LabVIEW
Part 7 : Building a Cross-Platform Qt6 Desktop Application for the MAX30208EVSYS Temperature Sensor
Part 8 : STM32 Pulse Oximeter & Heart Rate Monitor (MAXREFDES117 + USB CDC)
Part 9 : MAXREFDES117 – JSON Data Acquisition via USB-CDC in LabVIEW
Part 10 : Building a Real-Time Sensor Data Visualizer for MAXREFDES117 / USB CDC
Part 11 : Research Workstation System Architecture
Part 12 : Combined Pulse Oximeter & Temperature Monitoring System in LabVIEW
Part 13 : Dual-Port Biomedical Telemetry Dashboard - Integrating STM32 (MAXREFDES117) and MAX30208EVSYS in C++ and Qt
Creating a project in LabVIEW that reads data from sensors connected via USB in CDC mode (Communications Device Class – i.e., as a Virtual Serial / COM Port) is a standard task. In the operating system, such a device (e.g., Arduino, ESP32, or a dedicated microcontroller) is recognized as a serial port (COMx on Windows or /dev/tty... on Linux/macOS). In LabVIEW, the NI-VISA library is used to handle such ports. Designing such an application proceeds in a few steps.
Step 1: Prerequisites
Before writing code in LabVIEW, make sure you have the required software installed:
-
LabVIEW (any modern version).
-
NI-VISA Driver – a free package from National Instruments that enables communication with serial, USB, and GPIB ports (can be downloaded via the NI Package Manager).
-
USB CDC Device Driver – the device must be visible in Device Manager (Windows) under Ports (COM & LPT), for example, as a USB Serial Device (COM3).
Step 2: Step-by-Step Project in LabVIEW
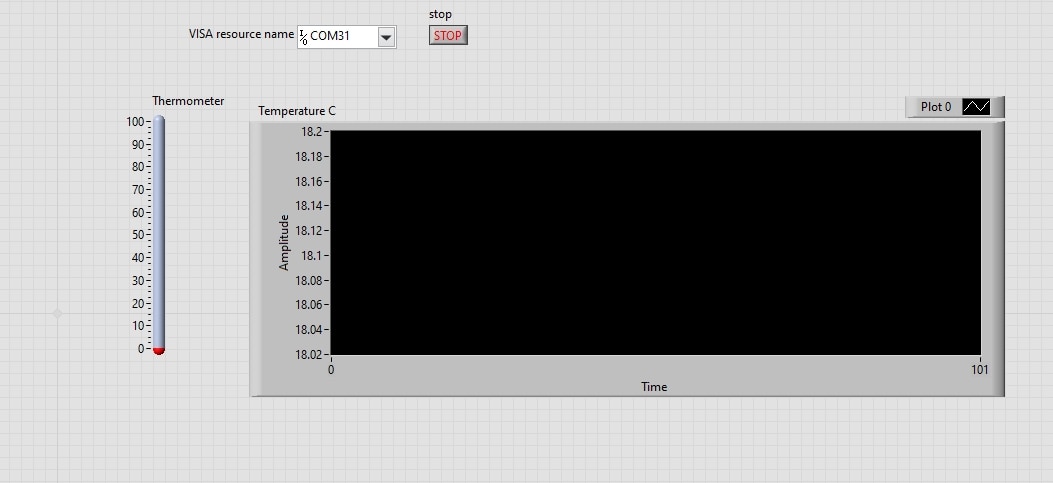
Front Panel (User Interface)
We designed a simple interface to control the connection and visualize the data:
-
VISA Resource Name (Control): A drop-down list allowing you to select the appropriate COM port (e.g.,
COM3). -
Baud Rate: Specifies the transmission speed (e.g.,
9600or115200– must match the microcontroller settings). -
Stop (Button): A button to stop the read loop.
-
Data Out / String / Graph (Indicator): A String indicator for raw data or a Waveform Chart/Graph to present sensor readings.
Block Diagram (Program Logic)
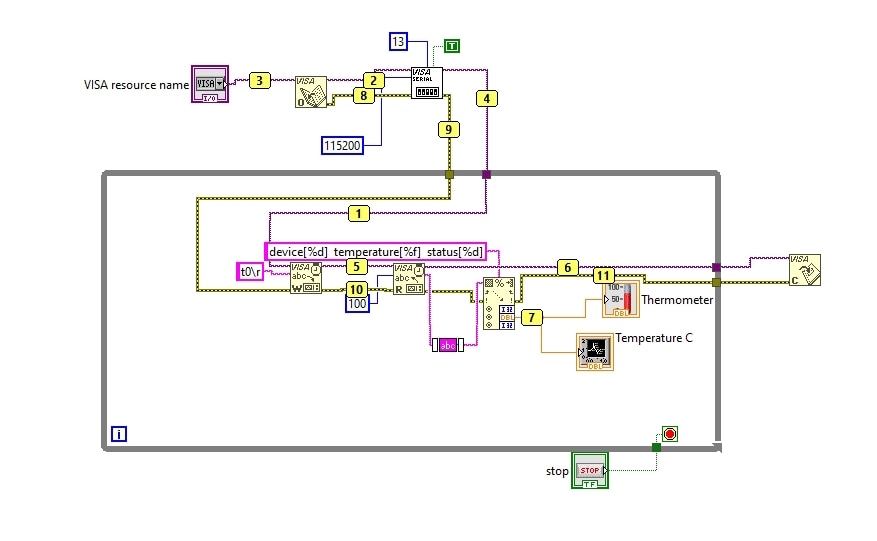
The standard structure for reading data from a COM port relies on a While Loop and functions from the Instruments I/O Serial palette.
Implementation steps in code:
-
VISA Open: Opens a connection to the selected port (input receives the VISA Resource Name control, output yields the VISA session).
-
VISA Configure Serial Port (optional, but recommended): Allows you to explicitly set the Baud Rate, data bits, stop bits, and flow control.
-
While Loop:
-
VISA Read: Reads a specified number of bytes. The Byte Count input specifies how many bytes to read (e.g., as many as the sensor typically sends in a single frame, or a fixed-size buffer like
256). -
Error Cluster: Passed through the entire pipeline.
-
Wait: It is best to include a short delay inside the loop (e.g.,
ms to wait = 10-50 ms) to prevent 100% CPU utilization.
-
-
VISA Close: Placed outside the While Loop (executed when shutting down the program) to properly release the COM port resource.
Step 3: Data Parsing (Processing)
Sensors typically send data in text format separated by newline characters (e.g., Temp:23.5, Hum:60\n or simply a numeric value as a string).
To convert the read string into numbers:
-
We used the Scan From String function if the data follows a fixed format (e.g.,
%f,%f). -
If data is transmitted in JSON or CSV format, you can use built-in LabVIEW string functions (such as Match Pattern or Spreadsheet String To Array) to extract the desired sensor parameters.
Evaluation Kit Context
The MAX30208EVSYS evaluation kit consists of the high-accuracy MAX30208 digital temperature sensor, the MAX32630FTHR microcontroller (which handles I²C communication with the sensor and provides a virtual COM port over USB CDC), and a flexible printed circuit (Flex PCB).
Below is the description of how to create a LabVIEW project to read data from this evaluation board via USB CDC:
Communication Architecture
The MAX32630FTHR board, connected via a Micro-USB cable, communicates with the computer using the USB CDC class (Virtual COM Port). Windows detects the board as a COMx port. The microcontroller transmits measurement data in text (ASCII) format, ending each frame with a carriage return/newline character (\r).
Here are the key takeaways from the code analysis:
Serial Transmission Parameters (USB CDC)
The OT07Serial.cs class shows how the host opens and configures the serial port:
-
Baud Rate: 115,200 baud.
-
Frame Format: 8 data bits, no parity (
Parity.None), 1 stop bit (StopBits.One). -
Flow Control: None (
Handshake.None). -
Control Lines: DTR and RTS signals are active (
DtrEnable = true,RtsEnable = true).
Text Command Protocol (CLI / Firmware Communication)
The application communicates with the microcontroller (e.g., MAX32630FTHR) using simple text commands sent and terminated with a carriage return (\r). Responses are also textual, often with lines ending in newline characters.
Main commands used in the code:
-
s– Device Search. Returns the number of sensors found, followed by lines with I²C addresses and ROM codes. -
t[index]ort [start] [end]– Temperature reading for a specific device index or a range of devices. -
r[index] [addr]orr[index] [start_addr] [end_addr]– Read a register or a range of registers from a given I²C sensor. -
g[index] 0– Read all registers (register map) for the indicated device. -
w[index] [addr] [data]– Write data (data) to a register (addr) of the selected sensor (index).
Response Format and Data Parsing
In response to commands, the firmware returns data enclosed in square brackets, e.g., [index] [value] [status].
-
Temperature reading example:
[0] [23.500] [0](where the first is the device index, the second is the temperature in °C, and the third is the status – e.g.,0means successful connection / no errors). -
Register values are read in hexadecimal format (e.g.,
0x10).
MAX30208 Sensor Register Structure
The Form1.cs class defines the complete register map of the MAX30208 chip (addresses from 0x00 to 0xFF):
-
0x00 (STATUS): Contains measurement readiness flags (
TEMP_RDY), alarm thresholds (TEMP_HIGH,TEMP_LO), and FIFO buffer full status (A_FULL). -
0x01 (INTERRUPT ENABLE): Configuration for enabling interrupts.
-
0x10 - 0x13: High and low temperature alarm thresholds (MSB and LSB).
-
0x20 (TEMP SENSOR SETUP): Contains the
CONVERT_Tbit (writing1triggers a single temperature measurement).
Raw Temperature Data Conversion
The code implements a method for converting 16-bit register values into degrees Celsius:
-
The sensor resolution is 0.005 per bit (0.005'C).
-
Negative values are handled by checking for a 16-bit overflow (32768).
-
Temperature formula:

How to use this knowledge in LabVIEW?
When creating your own LabVIEW program to handle this kit via USB CDC, instead of writing an advanced I²C protocol parser from scratch, you can send the exact same text commands to the serial port (e.g., sending the string "s\r" to detect devices or "t0\r" to read the temperature from device #0) and receive text responses using the VISA Read function.
Implementation process
The implementation process carried out in LabVIEW consists of the following phases:
Step 1: Serial Transmission Configuration (NI-VISA)
Before reading data, the serial port was correctly configured in LabVIEW using the VISA Configure Serial Port function to match the parameters extracted from the C# source code (OT07Serial.cs):
-
Baud Rate: 115,200
-
Data Bits: 8
-
Parity: None
-
Stop Bits: 1
-
Flow Control: None
-
Termination Character: Enabled (TRUE), set to \r (Return / 0x0D).
Step 2: LabVIEW Project Architecture (Block Diagram)
A sequential logic structure was established to mirror the text command mechanism of the original application, utilizing a While Loop for continuous data acquisition:
-
Initialization (Before the Loop):
-
The VISA Open function was used to open a connection to the selected COM port (e.g.,
COM3). -
The VISA Configure Serial Port function was applied with the parameters defined in Step 1.
-
-
Measurement Loop (While Loop Execution):
-
Command Transmission (VISA Write): Sent text commands terminated with a carriage return \r) using a string constant (e.g., sending
t0\rto request a temperature reading from device index 0). -
Response Acquisition (VISA Read): Read the text buffer returned by the firmware, which encapsulates output data inside square brackets (e.g.,
[0] [23.500] [0]representing the device index, temperature in °C, and status code). -
Data Parsing (Scan From String / Regex): Processed the incoming string using pattern-matching functions to extract the numerical temperature value.
-
Data Visualization: Routed the parsed temperature value to a numeric indicator and a Waveform Chart.
-
Loop Timing (Wait ms): Integrated a 1,000 ms (1 second) delay to match the native refresh rate of the original software and prevent 100% CPU utilization.
-
-
Resource Cleanup (After the Loop):
-
Upon pressing the stop button, the loop terminates and the VISA Close function executes to properly release the COM port resource in the operating system.
-
Step 3: Advanced Command Support (Maxim Protocol Reproduction)
To replicate the full feature set of the original application, the LabVIEW architecture was expanded to handle multiple CLI commands:
-
s\r: Initiates a device search across the I²C bus, returning the number of detected sensors along with their ROM codes and addresses. -
t0\r: Requests a direct temperature conversion and reading from the sensor at index 0, returning the formatted string[0] [23.500] [0]. -
r0 10\r: Reads register address0x10from device number 0, returning the hexadecimal value. -
w0 10 1F\r: Writes data (0x1F) into register0x10of device number 0, yielding a confirmation response.
Best Practices Implemented:
-
Error Handling (Error Cluster): The error cluster wire is daisy-chained continuously through every VISA operation (
Open->Configure->Write/Read->Close) to ensure robust exception handling and prevent application freezing if the USB cable is abruptly disconnected.
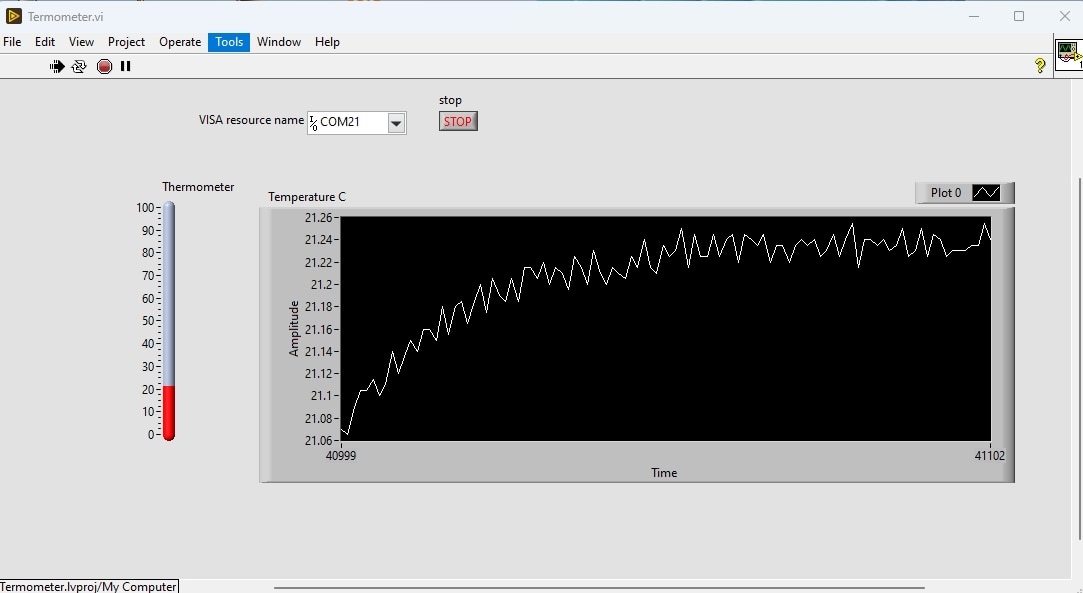
To display real-time temperature data from the MAX30208EVSYS sensor on a LabVIEW chart, the Waveform Chart element is the recommended choice.
The configuration process in the project involves the following steps:
1. Front Panel Configuration
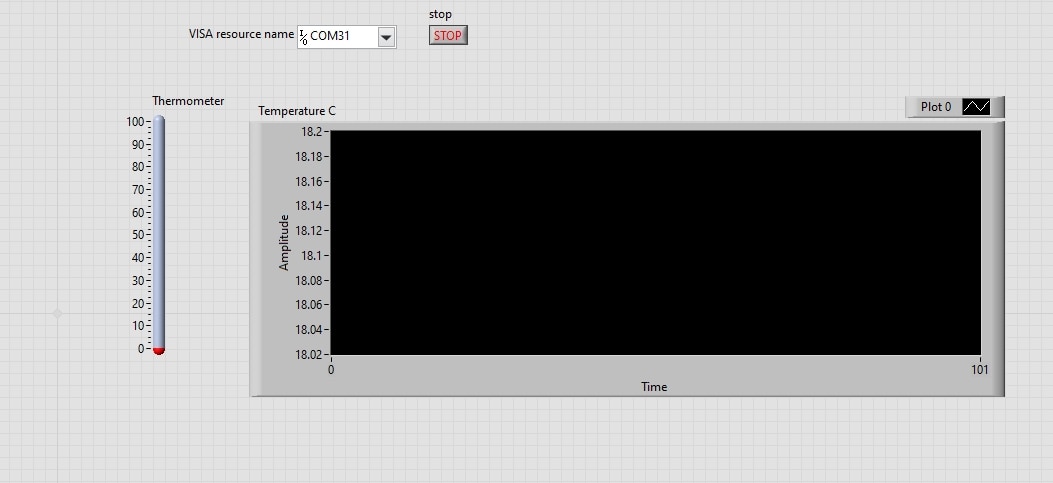
From the Controls Palette, navigate to Graph -> Waveform Chart and place it on your user interface:
-
Chart vs. Graph Selection: The Waveform Chart was chosen over a standard Graph because it automatically maintains a history buffer of incoming data points and scrolls over time. A Graph, by contrast, would require manual array management to store and update historical data with every new temperature reading.
-
Labeling: The indicator is designated as Temperature History.
-
Axis Precision: Because the MAX30208 sensor provides high-precision data down to thousandths of a degree, the Y-axis formatting was adjusted via Right-Click -> Format and Precision (setting Digits of Precision to at least 3) to properly display floating-point values with multiple decimal places.
2. Block Diagram Implementation
Inside the primary While Loop where data is acquired from the device:
-
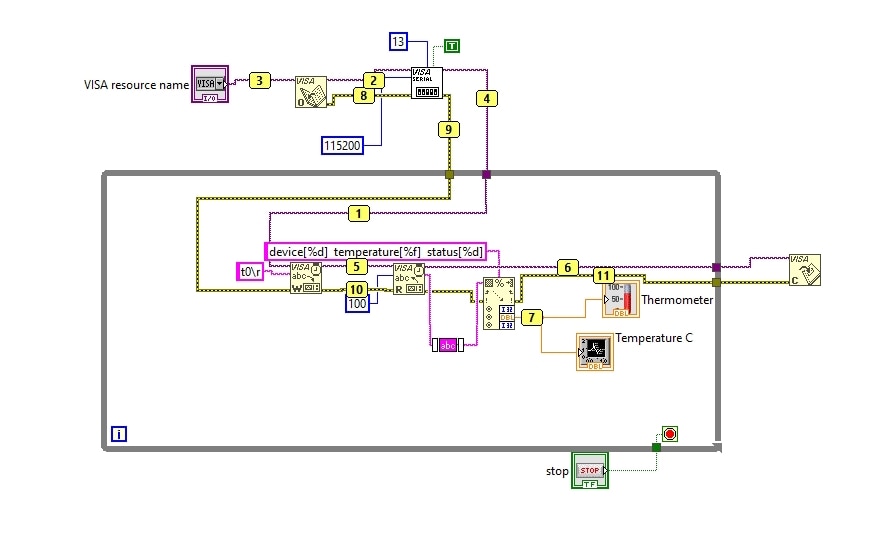
Data Acquisition & Parsing: After receiving the serial string via VISA Read (e.g.,
[0] [23.500] [0]) and extracting the numeric temperature value as a Double-precision float, a single sample is ready for plotting. -
Data Wire Connection: The numeric data wire is connected directly to the Waveform Chart terminal located on the loop boundary (or inside it). LabVIEW automatically appends the new sample to the chart's internal history buffer.
3. Timeline and Smoothness Optimization
To ensure the chart clearly visualizes temperature variations over time:
-
Loop Timing (Wait ms): A Wait (ms) function is embedded inside the While Loop, configured to a 1,000 ms delay (1 second per reading), matching the default refresh rate of the native application.
-
X-Axis (Time Scale): Through PropertiesScales Time, the time formatting can be customized (e.g., displaying hours, minutes, and seconds).
-
History Length: By default, a Waveform Chart retains the last 1,000 points. To extend the retention window (e.g., covering several hours of data), Data History can be modified by right-clicking the chart and increasing the buffer size.
4. Sensor Communication in LabVIEW
The MAX30208EVSYS evaluation board streams a raw text frame over the virtual COM port whenever a measurement command is triggered. The received data string typically follows this format:
device[00] temperature[18.090] status[0]
To successfully parse this string and extract the temperature value in LabVIEW, the implementation follows these steps:
-
Trimming Hidden Characters: Serial devices often append hidden carriage return and line feed characters (
\r\n) at the beginning or end of the incoming data stream. Before any parsing takes place, the raw string is passed through LabVIEW’s Trim Whitespace function. Trimming the text removes these stray control characters and whitespace, preventing matching errors and ensuring the string format is clean and predictable. -
Parsing and String Matching: Once the text is properly trimmed, LabVIEW uses pattern matching or the Scan From String function to locate the
temperature[...]block. It isolates the characters nested inside the square brackets. -
String-to-Number Conversion: The isolated floating-point number (e.g.,
18.090) is converted from text into a numeric data type (Double format). This yields a clean numerical temperature value ready to be displayed on indicators, plotted on real-time charts, fed into the statistical analysis engine, or logged to a CSV file.