element14 Community
element14 Community
    Register Log In
  • Site
  • Search
  • Log In Register
  • Community Hub
    Community Hub
    • What's New on element14
    • Feedback and Support
    • Benefits of Membership
    • Personal Blogs
    • Members Area
    • Achievement Levels
  • Learn
    Learn
    • Ask an Expert
    • eBooks
    • element14 presents
    • Learning Center
    • Tech Spotlight
    • STEM Academy
    • Webinars, Training and Events
    • Learning Groups
  • Technologies
    Technologies
    • 3D Printing
    • FPGA
    • Industrial Automation
    • Internet of Things
    • Power & Energy
    • Sensors
    • Technology Groups
  • Challenges & Projects
    Challenges & Projects
    • Design Challenges
    • element14 presents Projects
    • Project14
    • Arduino Projects
    • Raspberry Pi Projects
    • Project Groups
  • Products
    Products
    • Arduino
    • Avnet Boards Community
    • Dev Tools
    • Manufacturers
    • Multicomp Pro
    • Product Groups
    • Raspberry Pi
    • RoadTests & Reviews
  • Store
    Store
    • Visit Your Store
    • Choose another store...
      • Europe
      •  Austria (German)
      •  Belgium (Dutch, French)
      •  Bulgaria (Bulgarian)
      •  Czech Republic (Czech)
      •  Denmark (Danish)
      •  Estonia (Estonian)
      •  Finland (Finnish)
      •  France (French)
      •  Germany (German)
      •  Hungary (Hungarian)
      •  Ireland
      •  Israel
      •  Italy (Italian)
      •  Latvia (Latvian)
      •  
      •  Lithuania (Lithuanian)
      •  Netherlands (Dutch)
      •  Norway (Norwegian)
      •  Poland (Polish)
      •  Portugal (Portuguese)
      •  Romania (Romanian)
      •  Russia (Russian)
      •  Slovakia (Slovak)
      •  Slovenia (Slovenian)
      •  Spain (Spanish)
      •  Sweden (Swedish)
      •  Switzerland(German, French)
      •  Turkey (Turkish)
      •  United Kingdom
      • Asia Pacific
      •  Australia
      •  China
      •  Hong Kong
      •  India
      •  Korea (Korean)
      •  Malaysia
      •  New Zealand
      •  Philippines
      •  Singapore
      •  Taiwan
      •  Thailand (Thai)
      • Americas
      •  Brazil (Portuguese)
      •  Canada
      •  Mexico (Spanish)
      •  United States
      Can't find the country/region you're looking for? Visit our export site or find a local distributor.
  • Translate
  • Profile
  • Settings
Test & Tools
  • Technologies
  • More
Test & Tools
Blog Keithley DMM6500: How to Create a Bitmap for a Custom App
  • Blog
  • Forum
  • Documents
  • Files
  • Members
  • Mentions
  • Sub-Groups
  • Tags
  • More
  • Cancel
  • New
Join Test & Tools to participate - click to join for free!
  • Share
  • More
  • Cancel
Group Actions
  • Group RSS
  • More
  • Cancel
Engagement
  • Author Author: Jan Cumps
  • Date Created: 15 Jan 2019 12:45 AM Date Created
  • Views 3070 views
  • Likes 18 likes
  • Comments 12 comments
  • RoadTest
  • dmm6500
  • rt
  • keithley
Related
Recommended

Keithley DMM6500: How to Create a Bitmap for a Custom App

Jan Cumps
Jan Cumps
15 Jan 2019

I'm road testing the  Keithley Bench Digital Multimeter DMM6500.

The instrument can run apps, and you can roll your own (what a great time do be alive image).

In this blog, I'll show how you can show images on the display.

image


Why, Jan?


Apps make it possible to change how the instrument operates. It can give a completely different look and feel.

When you are using this for prescribed situations, or in a fixed setup, this can help to have repeatable results.


You can use this to run a set op predefined scenarios, show info in an operator friendly way, show binning info, show tag cards with instructions.

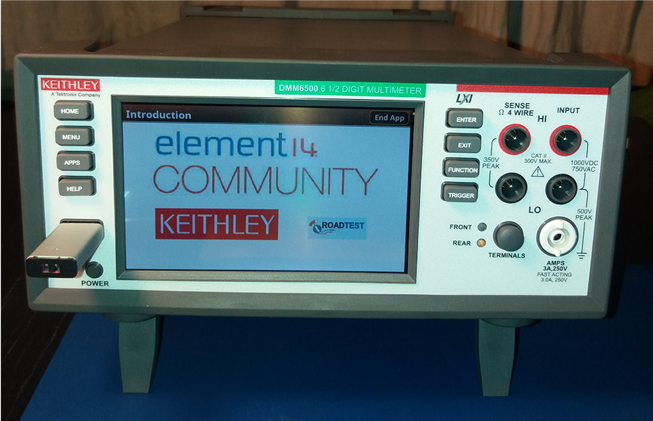
There's a pre-installed app on the device that shows such an instruction card flow, called Instructions.

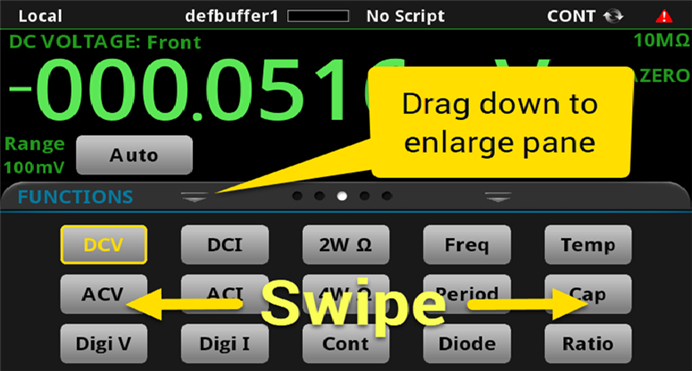
It's a set of 5 cards that you can scroll to, showing where the main user interface functions are.

Here's an example of one of the instruction cards.


image


Example


On the Keithley product page for this meter, the source for this app is available via the downloads button.

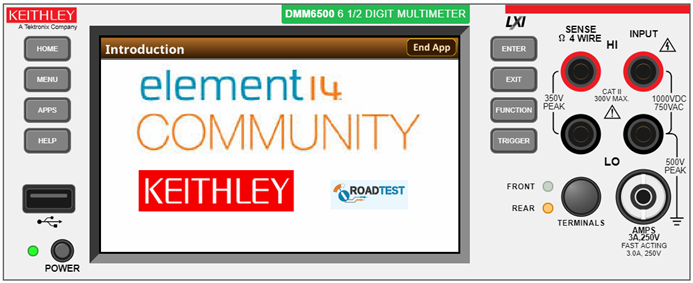
Let's change that example and replace the first card by a custom one, just to see if it works.


You need to have the image, in PNG format.

An image of 800 * 430 fills the whole width and fits under the title bar.

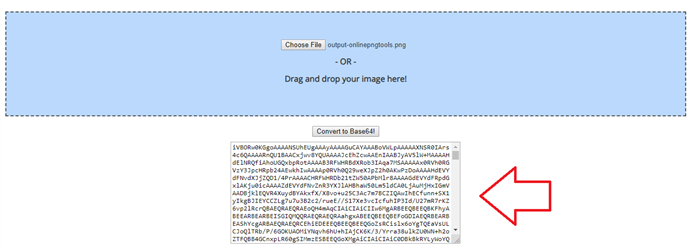
You have to convert it to BASE64.

Here's a website that can do that conversion online: https://onlinepngtools.com/convert-base64-to-png


Paste the BASE64 content in the application source file that you downloaded from Keithley's website, over the content of the first image.

image


Put it between these lines of code, replacing anything that was in there originally:


loadimage home intro_DMM
-- paste the content here
endimage
loadimage board2 intro_DMM


Save the script to a USB stick (.tspa extension). Then press the APPS button, and navigate to the USB.

Then select the app, and RUN it.

You'll see the image you created pop up first. When you press the TRIGGER button, it will navigate to the remaining original tag cards.

Home brings you back to your custom image.


image


If you want to have a look at the original images from the script, you can use this link to reverse from BASE64 to PNG:

https://onlinepngtools.com/convert-base64-to-png

Related Blog
Keithley Bench Digital Multimeter - Review
Software Control Options Pt 1 - TSP Script Builder, LabVIEW, Web Interface
TSP Script Example - Measure Power
How to Create a Bitmap for a Custom App
Verify a µCurrent Manually
Verify a µCurrent in an Automated Setup
Measure Amp-Hours of a microcontroller with a µCurrent
Trigger from External Trigger Input
Trigger from External Trigger Input in LabVIEW
Software Control Options Pt 2 - Test Commands with Communicator
App to Hold Measurements

Store Multiple Measurements Manually

Script Example - Externally Triggered Measurements
  • Sign in to reply

Top Comments

  • shabaz
    shabaz over 6 years ago +2
    It's a great feature! I couldn't resist trying this procedure out. Here's a space theme: ..and the 800x430 size .png file, for anyone who wants to use it (click on it first so that it is the correct size…
  • michaelkellett
    michaelkellett over 6 years ago in reply to Jan Cumps +2
    In a rush now so may think of something else later. The neatest thing I've done with the 7510 was to use the data acquisition mode to capture data from a low frequency filter (customer had designed it…
  • michaelkellett
    michaelkellett over 6 years ago in reply to Jan Cumps +2
    Hello Jan, I'm impressed by what you have done already - I've only ever programmed these things just enough to get the immediate job done so it's great if you do it for free To help you on your way: https…
Parents
  • shabaz
    shabaz over 6 years ago

    It's a great feature! I couldn't resist trying this procedure out. Here's a space theme:

    image


    ..and the 800x430 size .png file, for anyone who wants to use it (click on it first so that it is the correct size, then right-click and Save As):

    image

    • Cancel
    • Vote Up +2 Vote Down
    • Sign in to reply
    • More
    • Cancel
Comment
  • shabaz
    shabaz over 6 years ago

    It's a great feature! I couldn't resist trying this procedure out. Here's a space theme:

    image


    ..and the 800x430 size .png file, for anyone who wants to use it (click on it first so that it is the correct size, then right-click and Save As):

    image

    • Cancel
    • Vote Up +2 Vote Down
    • Sign in to reply
    • More
    • Cancel
Children
  • Jan Cumps
    Jan Cumps over 6 years ago in reply to shabaz

    Hey shabaz and michaelkellett, you both have access to a similar (or in case of Michael a 7510) meter. Is there anything you'd like to see me cover for the road test?

    If it is something I can do with the tools I have at hand here, I'd consider covering topics that you find important for this device.

    Something related to your real life use on a lab bench...

    • Cancel
    • Vote Up 0 Vote Down
    • Sign in to reply
    • More
    • Cancel
  • michaelkellett
    michaelkellett over 6 years ago in reply to Jan Cumps

    In a rush now so may think of something else later.


    The neatest thing I've done with the 7510 was to use the data acquisition mode to capture data from a low frequency filter (customer had designed it with bad capacitors Y5U) and was getting lots of distortion at 1 Hz or so). I exported the data to MATLAB to crunch the numbers and get FT out to see the distortion. Might be too hard to get LUA to do the FFT but may be possible.

    Another thing I do often is directly measure supply currents and show them as graphs on screen (or more like strip charts) - but you've pretty much covered that.


    MK

    • Cancel
    • Vote Up +2 Vote Down
    • Sign in to reply
    • More
    • Cancel
  • shabaz
    shabaz over 6 years ago in reply to Jan Cumps

    Hi Jan!

    I've no idea if this is possible, but something I've been curious about for years. I think the DMM6500 could do it...

    Basically, since it can measure AC RMS at audio frequencies, and at crazy low levels, and plot charts, then this is all a combination for visually seeing sound levels, if a mic is attached to the DMM6500, e.g. any electret element (and power it with a resistor and battery).


    The idea would be a workflow, where the user can set two things: the mic sensitivity (in mV/Pa) let's call it MS, and also the mic SNR in dB, lets call it MSNR. They are two values that would come from the electret element datasheet.


    Then, on a chart view, if possible, the noise floor would be drawn (in decibels) as a fixed horizontal line at:

    NF(dB) = 94 - MSNR


    Such a noise floor line could be optional, i.e. if the user does not type it in, then it isn't plotted.


    Simultaneously, the chart also plots the measured sound pressure level (SPL) in dB, i.e. same y-axis, using this formula (MV is the measured voltage in mV):

    SPL(dB) =   20Log10(MV/1000) - 20Log10(MS/1000) + 94


    If this works, then when you're silent, the chart will reveal the ambient room noise in dB. And when you talk or yell, it can be seen how loud it is in dB.


    In reality it would also be good to have ability to adjust based on frequency (in case the mic response isn't flat) but that could be a phase 2.0 feature.

    • Cancel
    • Vote Up +1 Vote Down
    • Sign in to reply
    • More
    • Cancel
  • shabaz
    shabaz over 6 years ago in reply to Jan Cumps

    In a similar vein, maybe it would be possible to build a suite of audio tools. Another one could be for frequency response.

    The workflow would automatically measure the frequency, and the amplitude, and plot a point, and keep repeating. Then all you'd need is to store a sweep of 20 to 20kHz as a WAV file on your mobile phone, perhaps over the space of a minute.

    Maybe that's handy for checking transformer response, or amplifier/filter etc.

    • Cancel
    • Vote Up +1 Vote Down
    • Sign in to reply
    • More
    • Cancel
element14 Community

element14 is the first online community specifically for engineers. Connect with your peers and get expert answers to your questions.

  • Members
  • Learn
  • Technologies
  • Challenges & Projects
  • Products
  • Store
  • About Us
  • Feedback & Support
  • FAQs
  • Terms of Use
  • Privacy Policy
  • Legal and Copyright Notices
  • Sitemap
  • Cookies

An Avnet Company © 2025 Premier Farnell Limited. All Rights Reserved.

Premier Farnell Ltd, registered in England and Wales (no 00876412), registered office: Farnell House, Forge Lane, Leeds LS12 2NE.

ICP 备案号 10220084.

Follow element14

  • X
  • Facebook
  • linkedin
  • YouTube