


EXPLORE SENSORS DATA WITH ANDROID APPLICATIONS
In the medical office the doctor will use the PC to monitor and make a remote diagnosis of the patients, but when the doctor has to go outside, he/she will use his Smartphone to perform this task. In this post I tested two Android applications, which are described below.
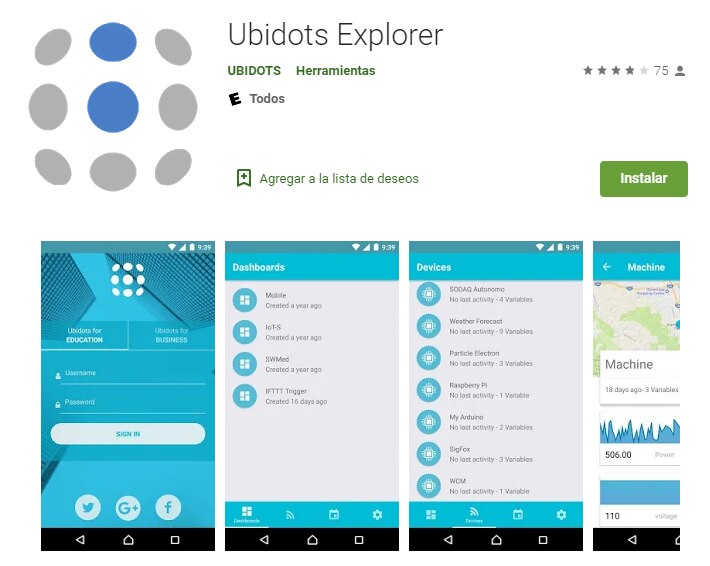
UBIDOTS EXPLORER APP
Ubidots Explorer is designed to empower existing Ubidots users to explore their sensor data on the go. You can download this application at: https://play.google.com/store/apps/details?id=com.ubidots.ubiapp&hl=es_GT
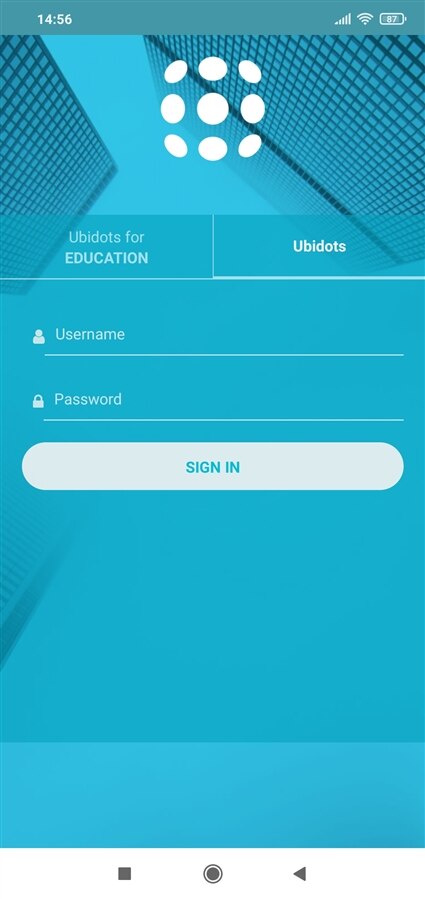
STEP 1.- Once the app is downloaded, we open it and the image below is displayed:
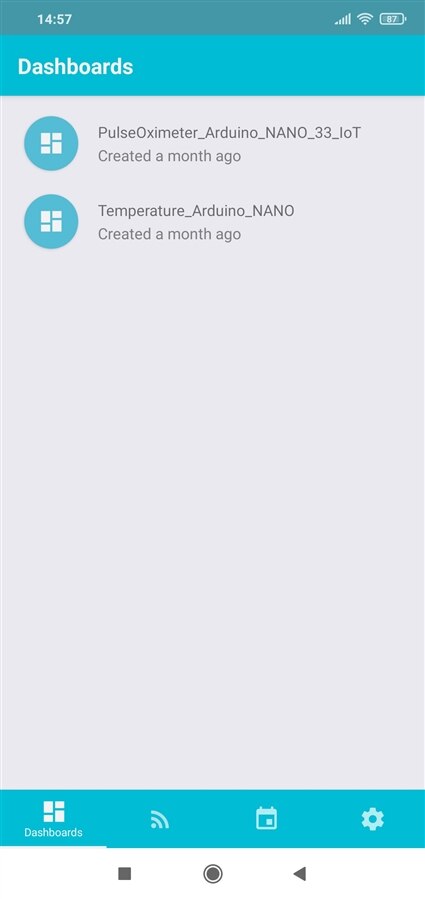
Once the credentials have been entered, the dashboards below are shown:
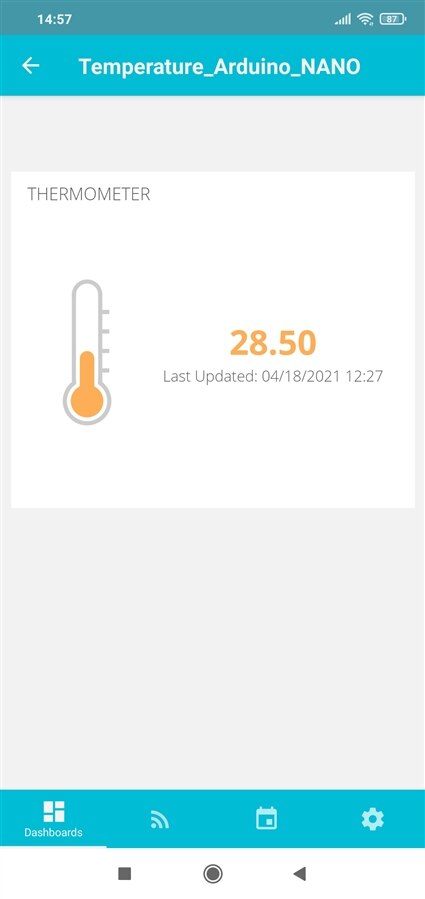
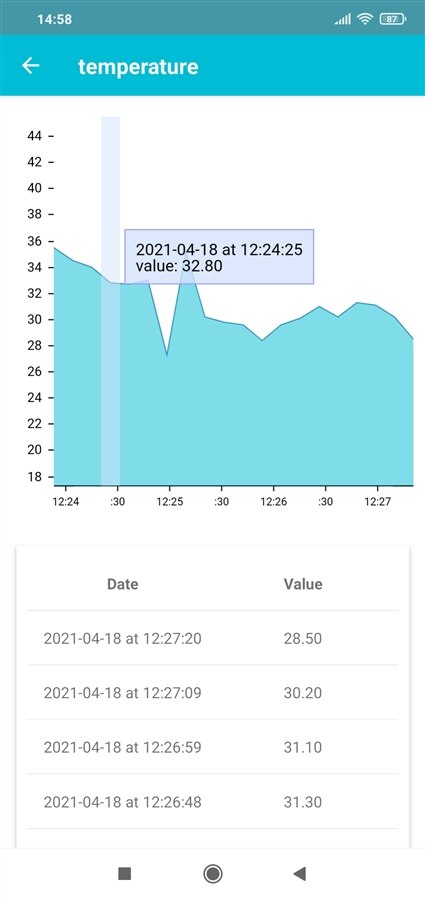
STEP 2.- If we click on the Temperature_Arduino_NANO dashboard, image below opens which corresponds to the chapters of our project:
Infrared Thermometer with Ubidots, Part 1 – Blog #3
Infrared Thermometer with Ubidots, Part 2 – Blog #4
STEP 3.- We can see the temperature data in detail in the last month if we click on "Devices", then click on the arduino-nano-33 icon and expand the temperature image.
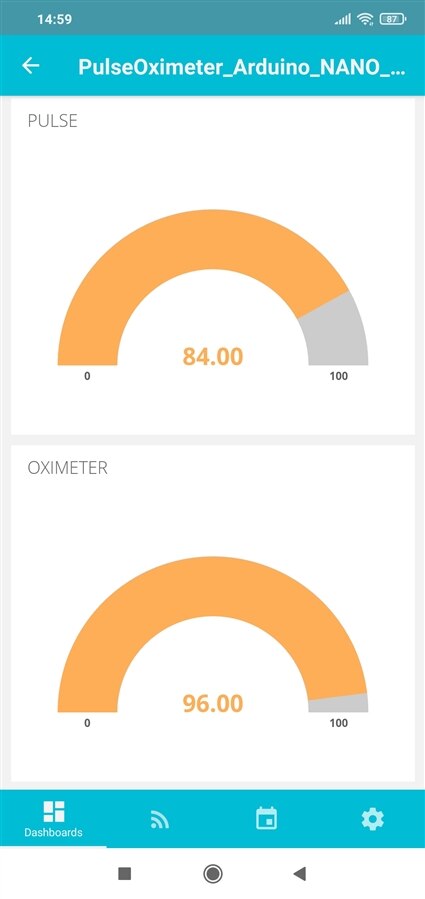
STEP 4.- And If we click on the PulseOximeter_Arduino_NANO_33_IoT dashboard, image below opens which corresponds to the chapters of our project:
Pulse Oximeter and Heart Rate Sensor with Ubidots, Part 1 – Blog #5
Pulse Oximeter and Heart Rate Sensor with Ubidots, Part 2 – Blog #6
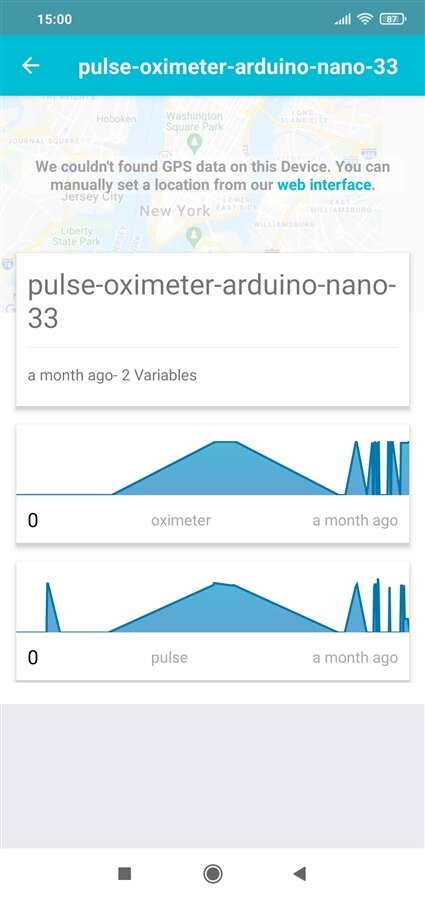
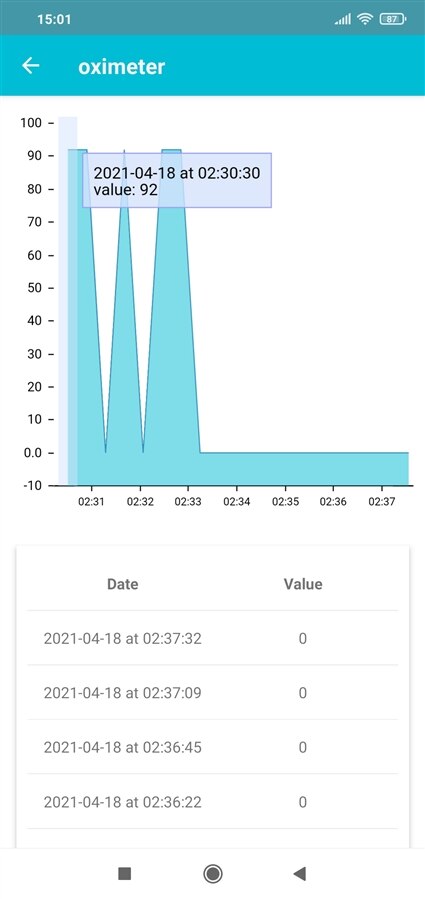
STEP 5.- We can see the pulse and oximeter information data in detail in the last month if we click on "Devices", then click on the pulse-oximeter-arduino-nano-33 icon.
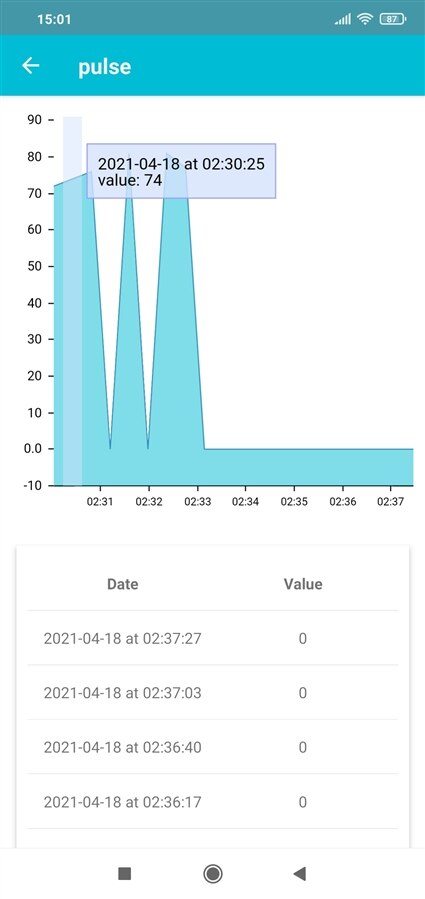
STEP 6.- We can see the pulse information data in detail in the last month if we expand the pulse image.
STEP 7.- Also we can see the oximeter information data in detail in the last month if we expand the oximeter image.
In the video below I show you the tests previously explained with the Ubidots Explorer application.
THINGVIEW APP - THINGSPEAK VIEWER
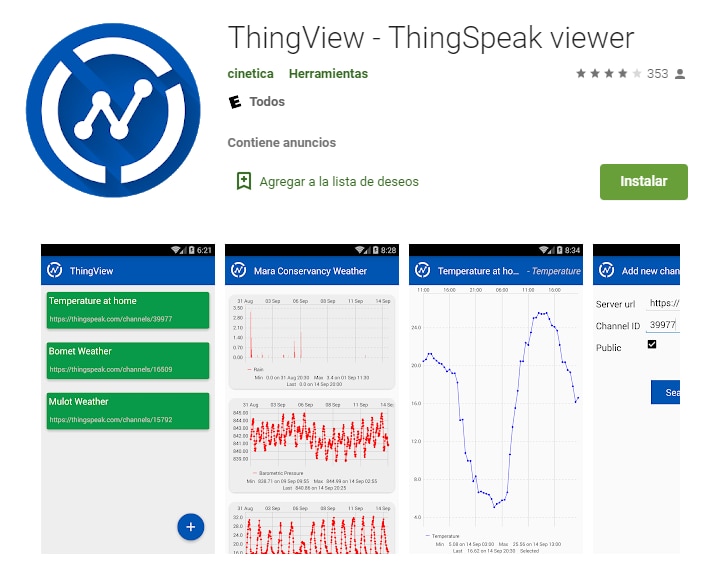
ThingView enables you to visualize your ThingSpeak channels in an easy way, just enter the channel ID and you are ready to go. You can download this application at: https://play.google.com/store/apps/details?id=com.cinetica_tech.thingview&hl=es_GT
For public channels the application will respect your windows settings: color, timescale, chart type and number of results. The current version supports line and column charts, the spline charts are displayed as line charts.
For private channels, the data will be displayed using the default settings, as there is no way to read the private windows settings with the api key only.
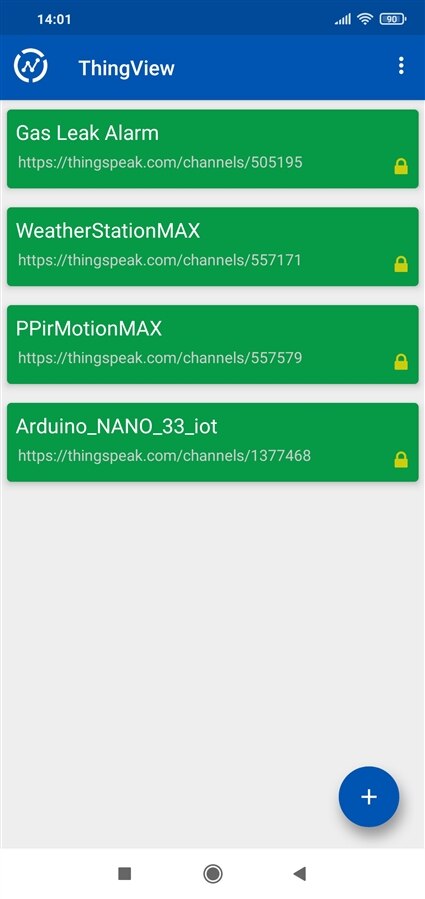
Once the app is downloaded, we open it and the credentials are entered. Finally the image below is displayed:
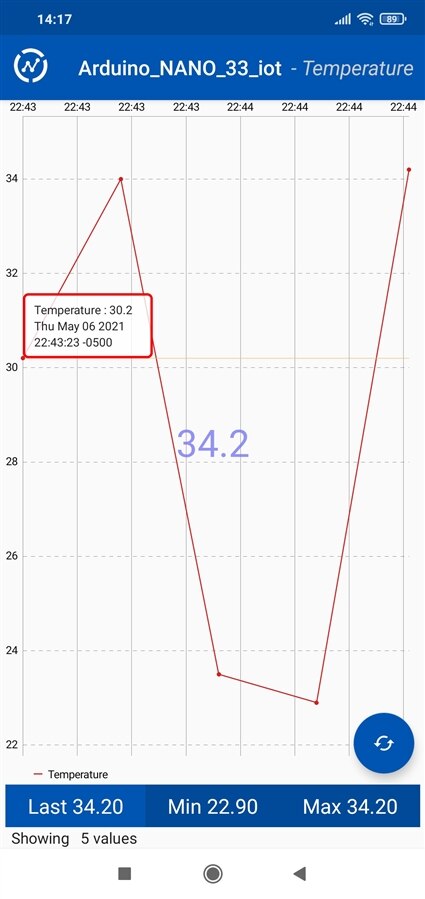
If we click on the Arduino_NANO_33_iot channel, image below opens which corresponds to the chapters of our project:
Infrared Thermometer with ThingSpeak, Part 1 – Blog #7
Infrared Thermometer with ThingSpeak, Part 2 – Blog #8
Infrared Thermometer with ThingSpeak, Part 3 – Blog #9
In the video below I show you the tests previously explained with the ThingView application.
CONCLUSION
For medical personnel, using Android applications are a good technological tool for remote monitoring and diagnosis of patients. This offers comfort for the elderly and people with disabilities, since they're often not available to visit the doctor or are at risk of being infected with some rare virus.
Personally, I prefer the Ubidots Explorer application since it has more tools for monitoring the sensors in IoT applications with our Arduino NANO 33 IoT board.
Top Comments