Panda Enclosure
Introduction
This challenge caught my interest because I live in the Pacific Northwest (Oregon, USA) and we get lots of rain during the year, so outdoor projects need to be weather-resistant. In general IP65 is sufficient for my use cases (outdoor sensors and controllers), but this challenge presented an opportunity to try a fully waterproof enclosure system with higher power electronics than I normally use. I will build and test a project that I will be able to use outdoors after the challenge is complete.
There are two aspects of the enclosure and associated hardware that I am going to test:
- Is the enclosure with the connectors installed waterproof? Check this a shallow submersion test.
- Is it practical to operate a moderate power (~6 W) SBC in a sealed enclosure without a heatsink. Check this with a thermal test.
Challenge Kit
The Waterproof Connectors Kit provided for the challenge includes the following parts:
- Hammond 9.4" x 6.3" x 3.5" Polycarbonate enclosure with a clear lid that is IP68 rated.
- DF Robot LattePanda V1 WIndows 10 SBC with 32GB of flash memory and 2GB of RAM.
- An assortment of Amphenol IP67 rated panel mounted connectors and assemblies
- USB Type A with mating connector
- RJ45 with external backshell/boot
- 4 pin Circular with mating connector
- N to SMA coaxial adapter
- SMA to MCX coaxial adapter
- TNC coaxial connector
- SMA to AMC coaxial cable assembly
The Hammond enclosure provided is customized with 6 cutouts:
- USB Type A
- RJ45
- 4 pin Circular
- Type N
- SMA (for either of the 2 types)
- TNC
The picture below shows the connectors mounted on the enclosure:

I am using 4 of the 7 connector types for my project. I am not using the Type N, TNC, or SMA/MCX connectors.
Hardware List
A list of the hardware that I am using. The RPi 4 and BME 680 are parts that I provided.
| Product Description | |
|---|---|
| 1554VA2GYCL Watertight Plastic Enclosure | Buy Now |
| DFR0418 LattePanda V1 Single Board Computer | Buy Now |
| Raspberry Pi 4 4GB (this is an existing unit running Node-Red and MQTT) | |
| Adafruit BME680 - Temperature, Humidity, Pressure and Gas Sensor - STEMMA QT | Buy Now |
| MRU-AF41-2020 USB Type A Sealed Connector | Buy Now |
| MRU-AM21-4000 USB Type A Sealed Connector | Buy Now |
| MRJ598001 Rugged RJ45 Jack | Buy Now |
| MUSBRAHD2241SK Connector Backshell, Hood, Standard USB and RJ Plug Connectors | Buy Now |
| MRDBN04M17000 Circular Connector | Buy Now |
| MRD-BG04-L13-000 Circular Connector, IP67, MRD Series, Panel Mount Receptacle | Buy Now |
| 095-902-545-250 RF / Coaxial Cable Assembly | Buy Now |
Software List
InfluxDB, Grafana, and Mosquitto MQTT are installed on the RPi 4. Node.js and Node-Red are installed on both the lattePanda and the RPi 4.
| Product Description | |
|---|---|
| Windows 10.0.19045 x64 LE - pre-installed and activated on LattePanda | |
| Arduino IDE 1.8.16 - pre-installed on LattePanda | |
| TightVNC version 2.8.79 | Link |
| Open Hardware Monitor version 0.9.6 | Link |
| Node.js version 18.16.0 | Link |
| Node-Red version 1.2.7 | Link |
| InfluxDB version 1.8.10 | Link |
| Grafana version 9.5.2 | Link |
| Mosquitto MQTT version 1.5.7 | Link |
Panda Enclosure Project Proposal
For this challenge I have the following objectives:
- Implement an environmental sensor system to monitor the temperature, humidity, pressure and gas inside the sealed enclosure using a BME680 sensor and internal & external thermistors with the lattePanda.
- Determine whether the sensor system can reliably detect water ingress into enclosure before failure is catastrophic (is humidity sufficient or is liquid sensor required).
- Characterize environmental effect of operating a moderate power (5-10W) SBC (lattePanda) in a sealed enclosure. Can it operate reliably over an extended period or are there thermal issues.
- Determine whether the enclosure and connector system can withstand submersion in water without leaking.
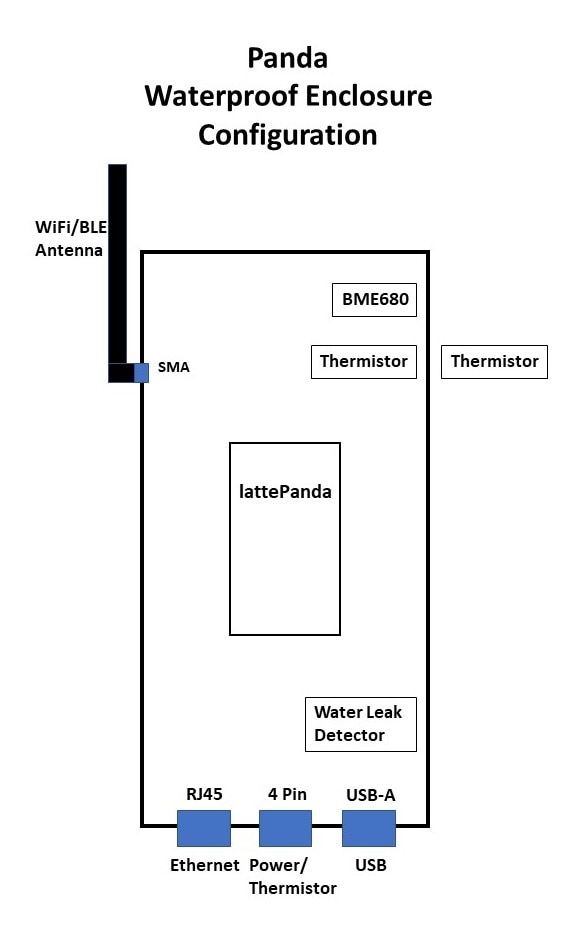
The SMA (WiFi/BLE), RJ45 (Ethernet), 4 pin circular (power/external thermistor) and USB-A (debug) connectors are used to test the enclosure. In the deployed normal operating configuration, I plan to only use the WiFi antenna and power connectors.
Below is a diagram of the enclosure setup. The unused connector holes are plugged.
Enclosure Mechanical Development
There were several additions and modifications required for the enclosure.
Baseplate for lattePanda and sensors
I 3D printed a baseplate to enable mounting the lattePanda and the BME 680 and leak sensors in the enclosure. Because the required baseplate size is at the maximum build area of my printer (205 x 205mm) I printed it in two halves and added a strip to join them.


Remove ribbing inside the enclosure in the SMA connector area
The mounting hole for the SMA connector was drilled through internal ribbing and I used a Dremel tool to clear that out so the connector could mount correctly.


Plug unused connector holes
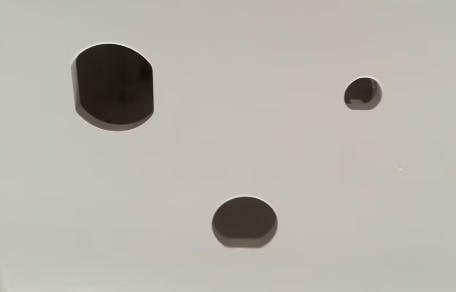
I used 12mm and 15mm rubber cable grommets to plug the holes for the N and TNC connectors that I am not using. I needed to modify the grommets with an Xacto knife to accomodate the 3.3mm thickness of the enclosure wall.


Add inserts for external RJ45 backshell assembly
The RJ45 backshell on the external cable requires threaded inserts for its captive screws. Using the rubber boot as a template, I located pilot holes, then enlarged the holes to the required 5/32" diameter and hammered in the inserts from the enclosure interior side.


The mated RJ45 assembly.

Cables and Wiring
The following cables were built and sensors wired:
- RJ45 bulkhead connector (jack) to RJ45 male (plug) pigtail
- RJ45 backshell connector (plug) pigtail to RJ45 jack
- USB-A bulkhead connector (jack) to USB-A male (plug) pigtail
- USB-A mating connector (plug) to USB-A male (plug) pigtail
- 4 pin circular male (pin) bulkhead connector to 4 discrete Dupont sockets (power and thermistor)
- 4 pin circular mating connector to microUSB socket (power only) and 2 discrete Dupont sockets (thermistor)
- BME 680 QWIIC to Arduino header (4 Dupont pins)
- 100K Thermistor (2 Dupont Sockets) (2x)
- Leak detector (2 pin Dupont F-F [sockets])
The pinout details of the connector wiring is in Panda Enclosure - Extra Credit Blog 2: Wiring the Connectors.
RJ45 connectors
T568B configuration
Terminal Block Top View

Enclosure cable assembly External backshell cable assembly


USB connectors
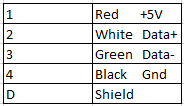
Enclosure cable assembly External cable assembly


4 pin circular connectors

Enclosure cable assembly External cable assembly


Test all cable assemblies
I did a basic continuity test of all the assemblies. In the case of the RJ45 I used a cable tester to do an automated test of the internal assembly which is shown in the video below: I also tested the mated internal and external assembly in a similar manner, but didn't record a video.
BME 680
The BME 680 sensor uses a QWIIC (Stemma QT) to Dupont pin adapter to interface with the lattePanda Arduino header.


Leak Detector
The leak detector is just a set of interleaved PCB traces. I mounted the leak detector on the underside of the baseplate. When water reaches a 1 mm depth inside the enclosure, it will change the resistivity between the traces.


Sensor to lattePanda interface proto board for leak detector and thermistors
I made a small proto board to mount the sensors to the A0-A2 pins on the lattePanda. I used the board to add the required R-C circuits. The board plugs onto the lattePanda headers and the sensors plug onto it.
L to R
Leak detector, internal thermistor,
external thermistor Thermistor wired to Dupont sockets


Wired sensor test setup

Sensor Software Development
To achieve the project objectives, I implemented the following sensors:
- lattePanda core temperature and power
- enclosure environment (temperature, humidity, pressure, gas, altitude)
- internal thermistor
- external thermistor
- water leak detector
Due to limited available space in flash memory (< 5GB on WIndows C drive), I chose a development flow that required the least amount of software installation. I elaborated on this in Panda Enclosure - Extra Credit Blog 3: Sensor Software Development.
Here are the set of tools that are used:
- TightVNC
- Open Hardware Monitor
- Arduino IDE (version 1.8.16 was already pre-installed)
- Node.js
- Node-Red
- InfluxDB (installed on RPi 4)
- Grafana (installed on RPi 4)
lattePanda Software configuration
I am not going to describe the software installation process as I just followed the instructions associated with each program. I will just elaborate on any specific configuration that was required for my setup. I installed the software in the following sequence:
- Install TightVNC
- Install Open Hardware Monitor
- Install Node.js
- Install Node-Red
lattePanda core temperature and power
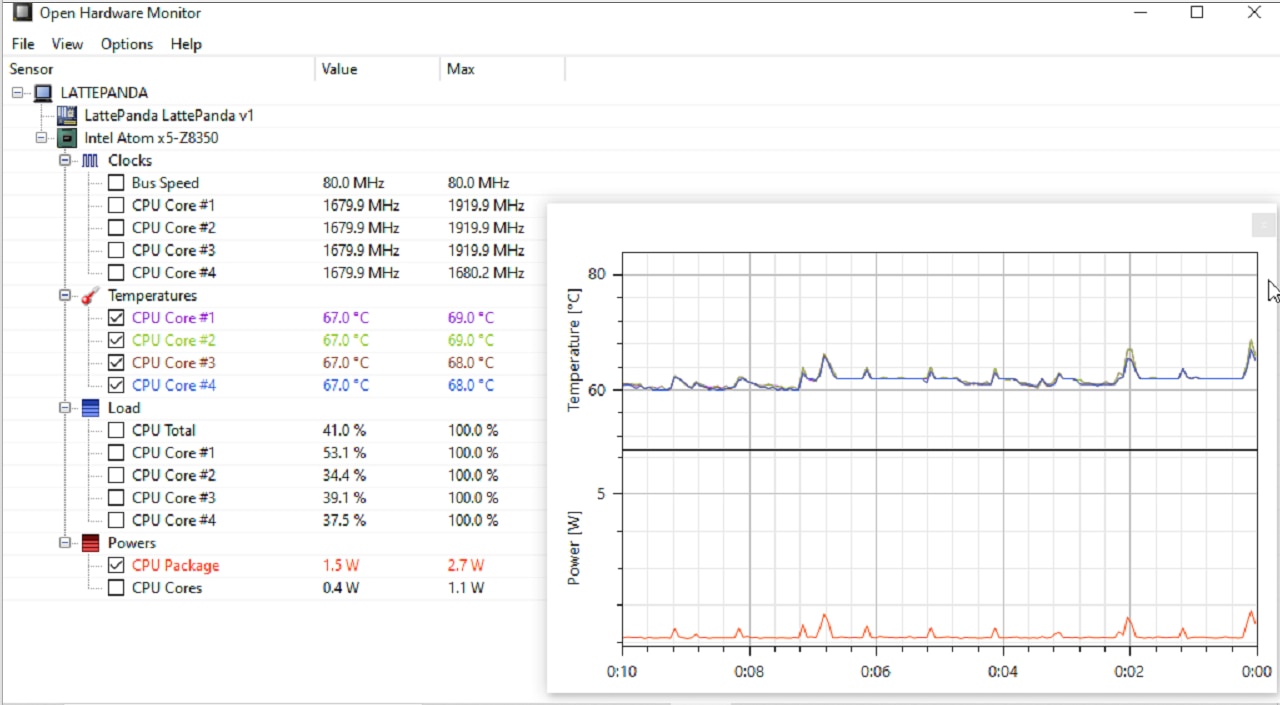
To monitor the lattePanda core temperature and power, I am using Open Hardware Monitor (OHM). I am only recording CPU Core Temperatures and CPU Total Power. OHM has a plotting option that I will be using. You just need to check (select) the items that will be monitored when the option is enabled.

BME 680, thermistors, and leak detector
I am going to an use the Arduino program to interface all of the other sensors.
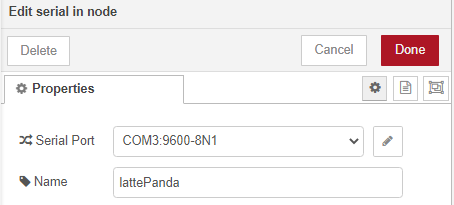
The integrated Arduino processor shows up in the IDE as a "LattePanda Leonardo" board on COM3:

The final program version:
lattepanda_sensors_v1.ino
/***************************************************************************
  This is a program for the lattePanda used in the Experimenting with Waterproof Connectors Design Challenge.
  The following sensors values will be logged in JSON format:
   BME680 Temperature
   BME680 Humidity
   BME680 Pressure
   BME680 Gas
   BME680 Altitude
   Internal Thermistor
   External Thermistor
   Internal Water Present

 ***************************************************************************/

#include <Wire.h>
#include <SPI.h>
#include <Adafruit_Sensor.h>
#include "Adafruit_BME680.h"
#include <ArduinoJson.h>

#define BME_SCK 13
#define BME_MISO 12
#define BME_MOSI 11
#define BME_CS 10

#define SEALEVELPRESSURE_HPA (1013.25)

Adafruit_BME680 bme; // I2C

void setup() {
  Serial.begin(9600);
  // while (!Serial);
  Serial.println(F("lattePanda Sensors"));

  if (!bme.begin()) {
    Serial.println("Could not find a valid BME680 sensor, check wiring!");
    while (1);
  }

  // Set up oversampling and filter initialization
  bme.setTemperatureOversampling(BME680_OS_8X);
  bme.setHumidityOversampling(BME680_OS_2X);
  bme.setPressureOversampling(BME680_OS_4X);
  bme.setIIRFilterSize(BME680_FILTER_SIZE_3);
  bme.setGasHeater(320, 150); // 320*C for 150 ms
}

void loop() {
  static auto uploadTime = millis();

  if (! bme.performReading()) {
    Serial.println("Failed to perform reading :(");
    return;
  }

  if (millis() - uploadTime >= 60000) {
    StaticJsonDocument<200> doc;
    doc["Temperature"] = bme.temperature ;
    doc["Humidity"] = bme.humidity;
    doc["Pressure"] = bme.pressure / 100;
    doc["Gas"] = bme.gas_resistance / 1000.0;
    doc["Altitude"] = bme.readAltitude(SEALEVELPRESSURE_HPA);
    doc["LeakDetector"] = map(analogRead(A0), 0, 1023, 1023, 0);
    doc["InternalThermistor"] = analogRead(A1);
    doc["ExternalThermistor"] = analogRead(A2);

    serializeJson(doc, Serial);
    Serial.println();

    uploadTime = millis();
  }
}
The key element of this code is that I am packaging the sensor data as a JSON document which gets sent to the Serial Port as a JSON string as seen below on the Serial Monitor, I am sending data once a minute. This is using the ArduinoJson library. This format makes it simple for all the subsequent tools to parse the data.
The code fragment that does this is
if (millis() - uploadTime >= 60000) {
StaticJsonDocument<200> doc;
doc["Temperature"] = bme.temperature ;
doc["Humidity"] = bme.humidity;
doc["Pressure"] = bme.pressure / 100;
doc["Gas"] = bme.gas_resistance / 1000.0;
doc["Altitude"] = bme.readAltitude(SEALEVELPRESSURE_HPA);
doc["LeakDetector"] = map(analogRead(A0), 0, 1023, 1023, 0);
doc["InternalThermistor"] = analogRead(A1);
doc["ExternalThermistor"] = analogRead(A2);
serializeJson(doc, Serial);
Serial.println();
uploadTime = millis();
}
The JSON string printed to the Serial Monitor:

Node-Red Flow
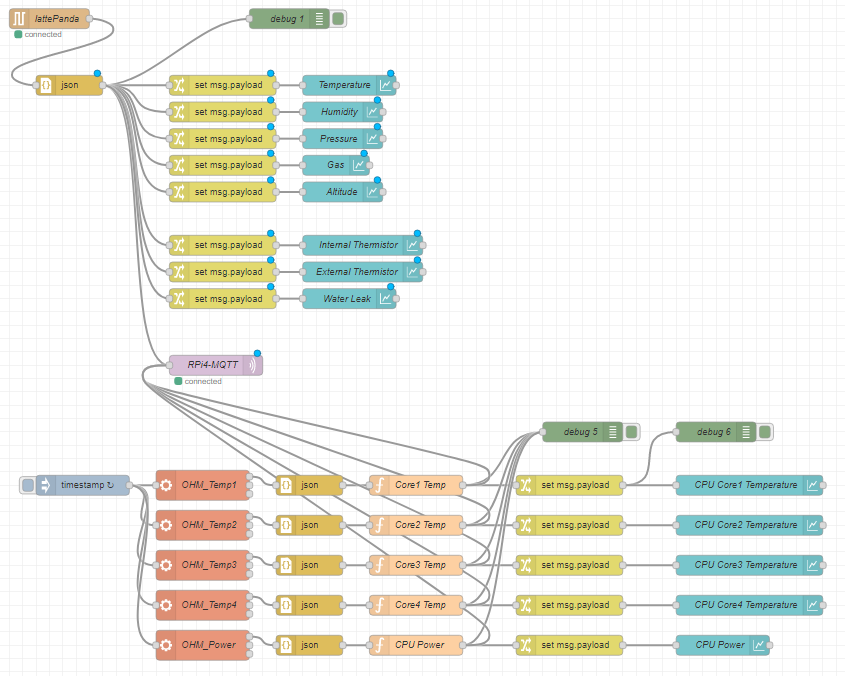
Node-Red on the lattePanda is handling the data integration from all of the sensors.
- Receive OHM data using OS exec interface
- Receive Arduino data using the serial port interface
- Display data on graphical dashboard
- Upload data to the RPi 4 via MQTT
Node-Red on the RPi 4 handles the data received from the lattePanda
- Receive lattePanda data via MQTT
- Display data on graphical dashboard (used for debug - lattePanda has primary dashboard)
- Load data into InfluxDB database
Interface Nodes
I need 3 communication interfaces (nodes) to process the sensor data:
- Serial Port to get data from the Arduino
- Exec to get data from the Open Hardware Monitor
- MQTT to upload the data to the network
Serial Port Nodes


Exec Node

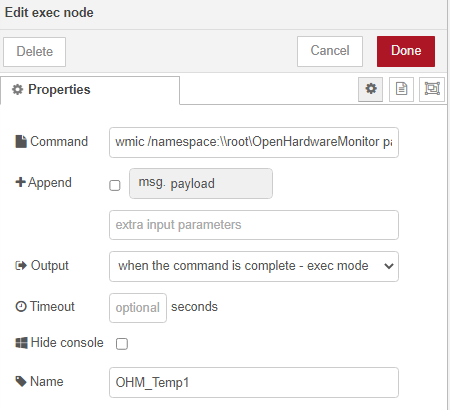

I am using WMIC (Windows Management Instrumentation command-line) to read the outputs from the Open Hardware Monitor (OHM). OHM needs to be running.
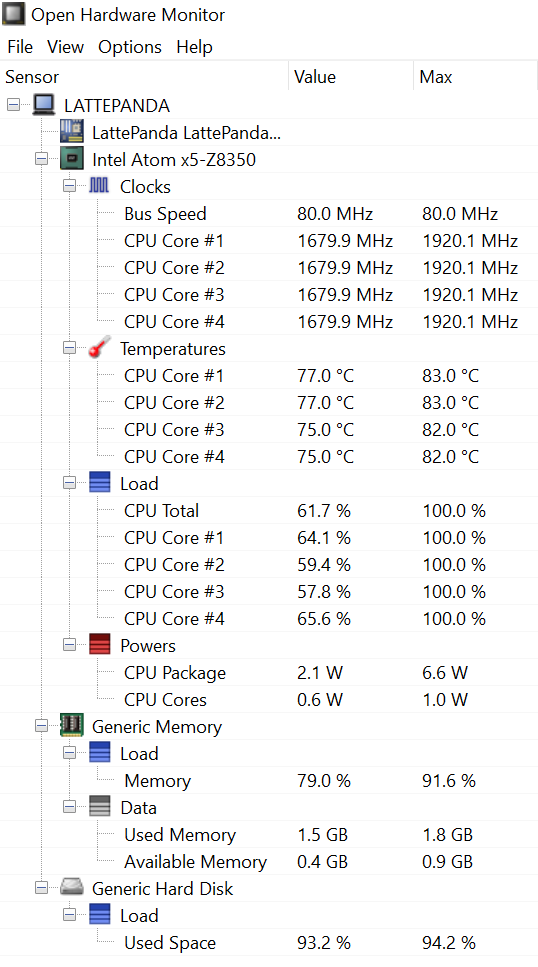
Then the following command line will e.g. extract the CPU Core #1 Temperature:
wmic /namespace:\\root\OpenHardwareMonitor path sensor where "Name like '%CPU Core #1%' and SensorType='Temperature'" get Value /value
This is the command that I am using in the exec node.
MQTT Nodes

This particular node is configured to send data to a Node-Red Dashboard that I have running on a RPi4 on my LAN.


The flow on the lattePanda:
Access to Node-Red uses a web browser connected to URL http://lattePanda:1880.
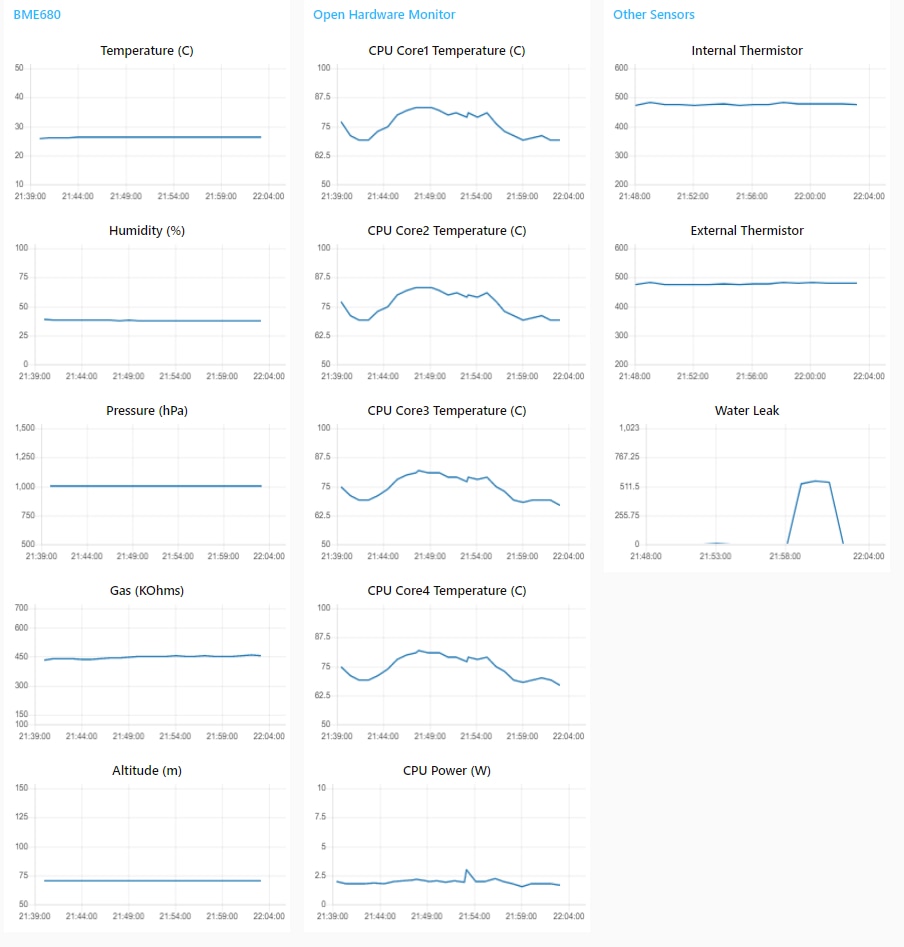
The lattePanda dashboard:
Access to Node-Red dashboard uses a web browser connected to URL http://lattePanda:1880/ui.
This was a test case to verify that I could visualize a water leak (lower right panel)
The MQTT Input Node on the RPi 4 to receive data from the lattePanda:

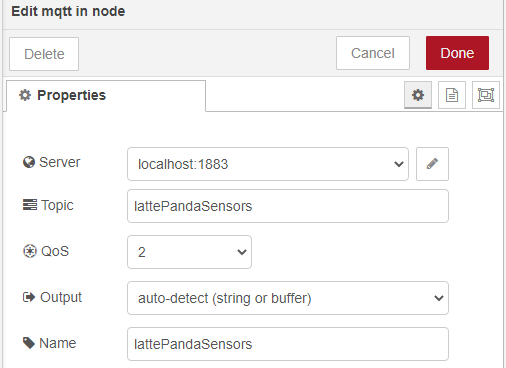
The flow on the RPi 4 including the InfluxDB node is explained in the next section.
InfluxDB
My Node-Red dashboard allows me to visualize the sensor data from the lattePanda, but for testing I need to capture the data into a database for analysis. I decided to use a local instance of InfluxDB running on the RPi4 that I'm using for the Node-Red dashboard and there is an integration (contributed nodes) available to allow me to use the current Node-Red flow and dashboard. InfluxDB is available on Port 8086 on the RPi 4.
First I need to use the influxdb cli to create the "lattepanda" database to store the sensor data.

Then I need to add the InfluxDB Interface nodes to Node-Red.
To install the InfluxDB interface - go into Pallette Manager and install node-red-contrib-influxdb.
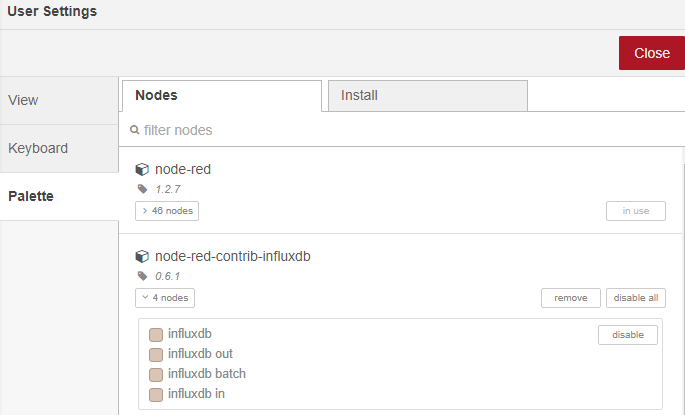
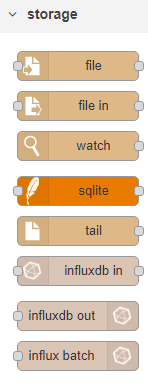
The nodes will appear in the Storage section
Add the influxdb out node to the flow to load the lattePandaSensors MQTT JSON data into the database. The JSON node is used to covert the MQTT JSON string into a JSON object to use with the graph widgets and the database.
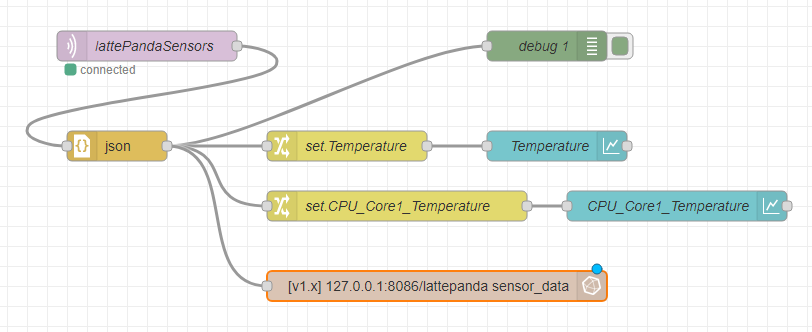
The influxdb out node is configured to send data to the "lattepanda" database. I am running the InfluxDB on the same RPi as Node-Red, so it connects to localhost using Port 8086. The measurements will be stored in a table called "sensor_data".
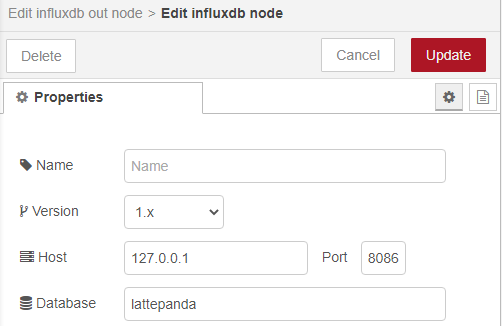
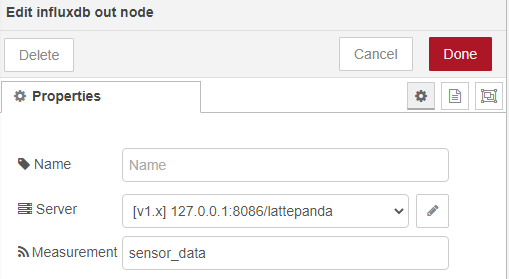
Query the database to see the measurement table.

Read a sample from the database to verify storage is working. For this example I read the time series data for the CPU Core1 Temperature.
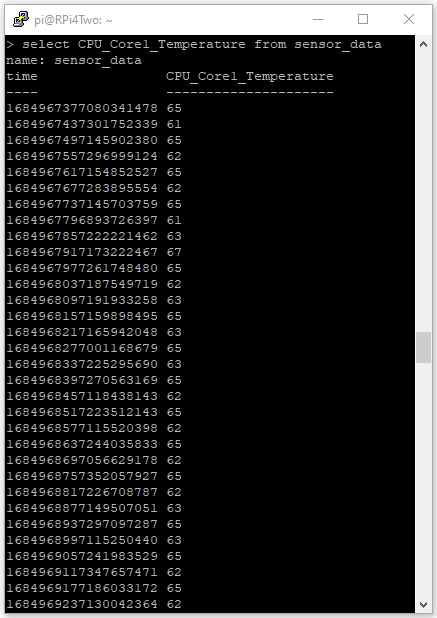
InfluxDB is now configured and receiving data.
Grafana
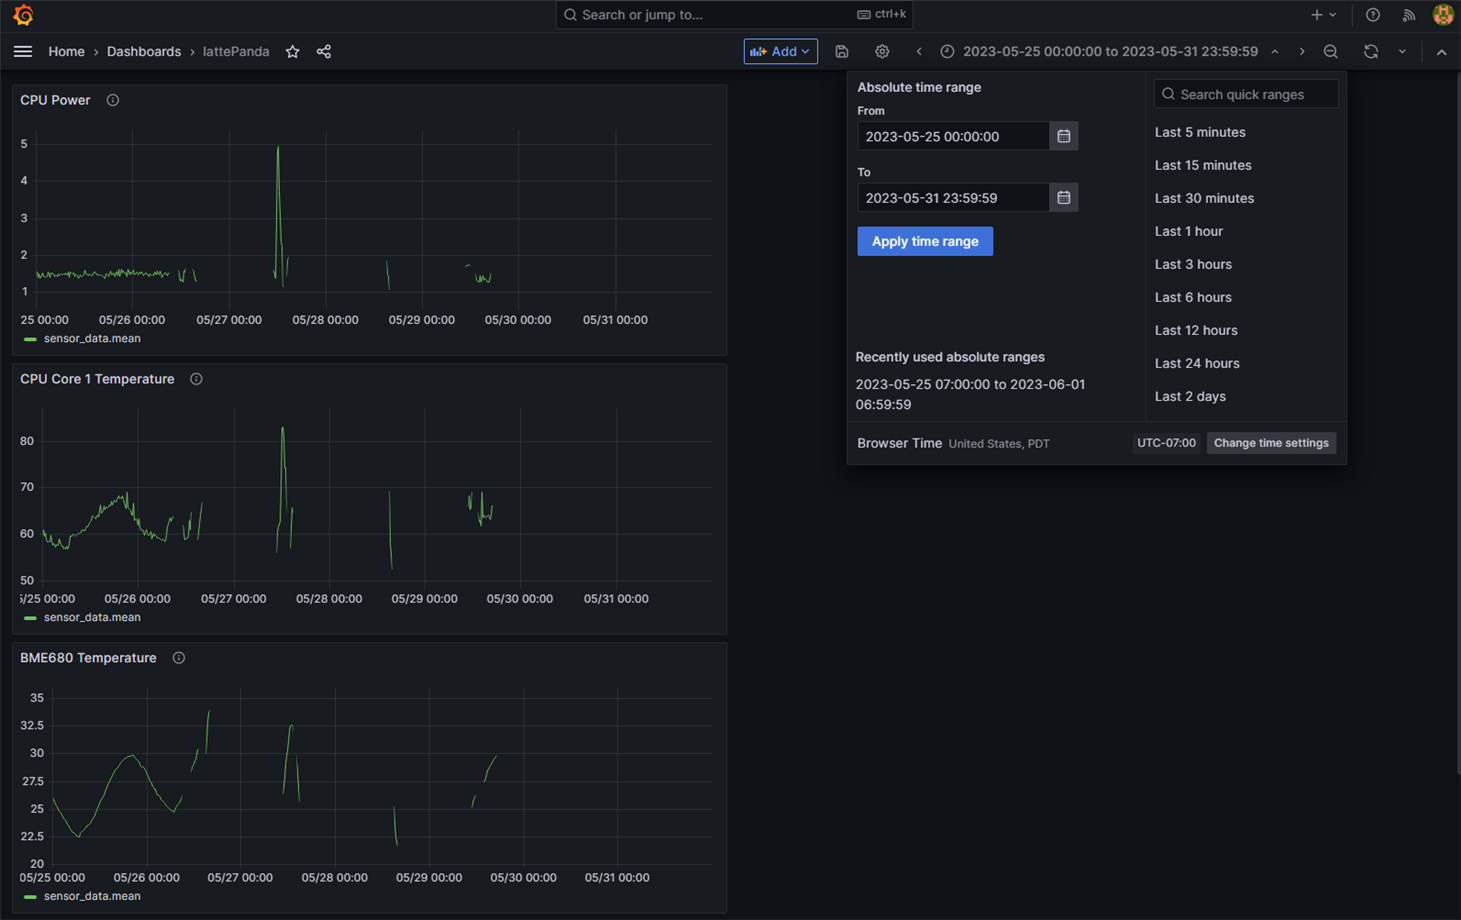
Grafana is an open source analytics and interactive visualization web application. It will allow me to visualize the sensor data in the database and select custom time range queries for that data. I am going to jump a bit out of sequence to show an example of that data visualization (the data is for the thermal test that is explained later). Grafana is accessed through Port 3000 on the RPi 4. The dashboard interface uses a web browser
Accessing Grafana at Port 3000 at the RPi 4's ipAddr will bring up the dashboard interface showing the lattePanda dashboard that I created.

Selecting that dashboard and entering a time range that spans the timeframe that I was running tests shows what data is in the database for the sensor data that I selected. You can recognize thermal test data on May 27 because of the large power spike.
I can modify the time range to zoom into that data.
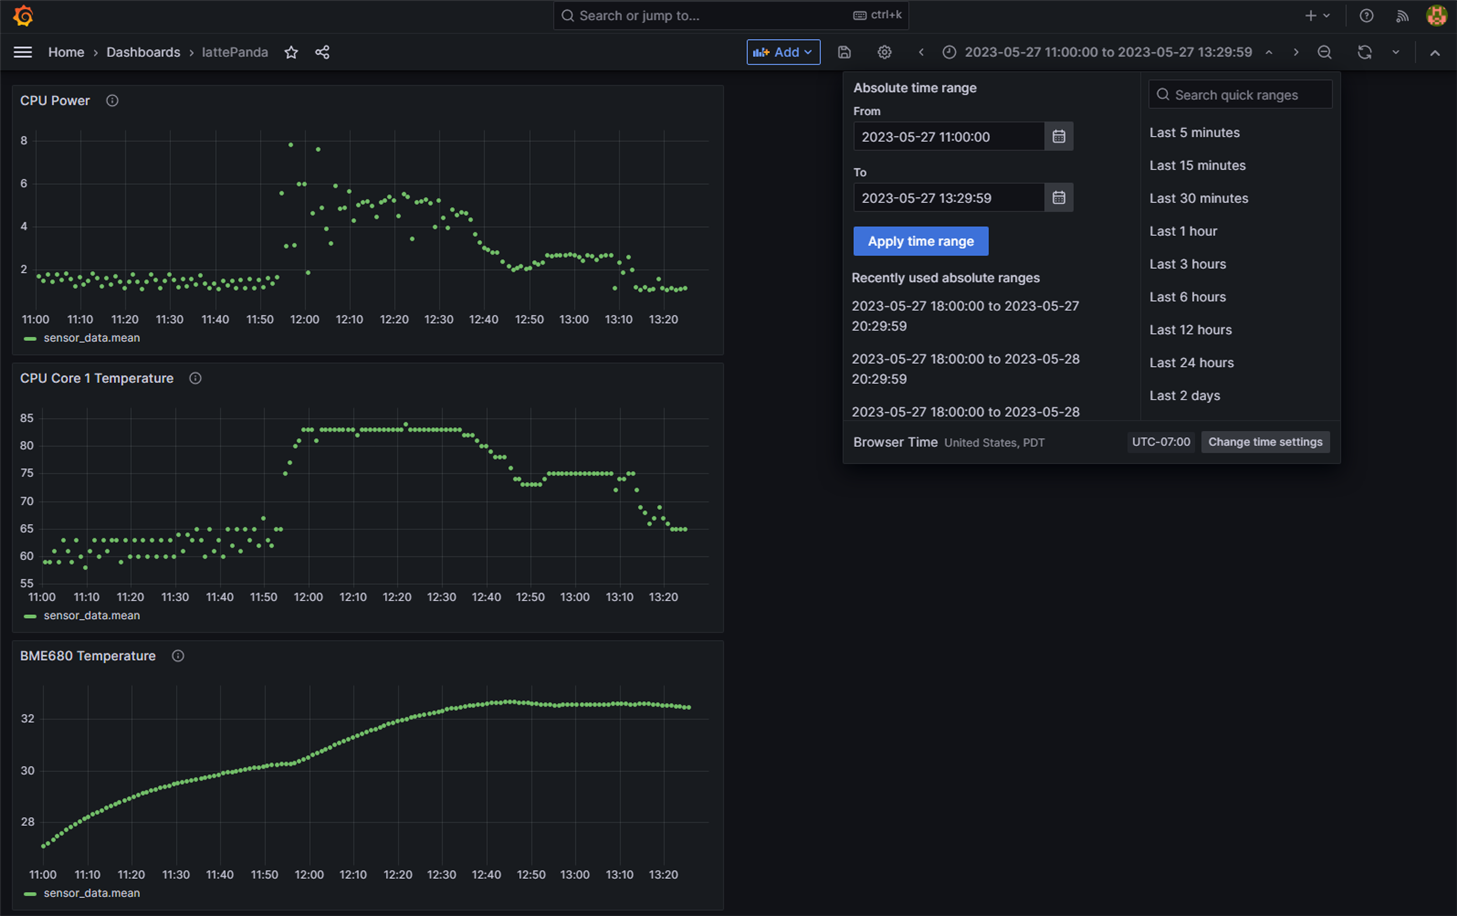
Now I have the capability retrieve and inspect test data for analysis.
Thermal Test
Since I would like to use this enclosure for a real project later, I wanted to see what power level I could operate at in the sealed enclosure. For my basic setup operating the sensors and transmitting the data via WiFi, the power requirement averages between 1.2 to 1.5W and peaks around 2.7W. Running with this configuration with an ambient of 27C, the CPU core temperature is about 62C which is about a 35C delta above ambient. Running for an hour with the enclosure sealed results in reaching an equilibrium where the internal emclosure temperature and the CPU core temperatures stabilize at 2 to 3C above their starting values (with peaks 5C higher). At this lower power level continuous operation looks good.
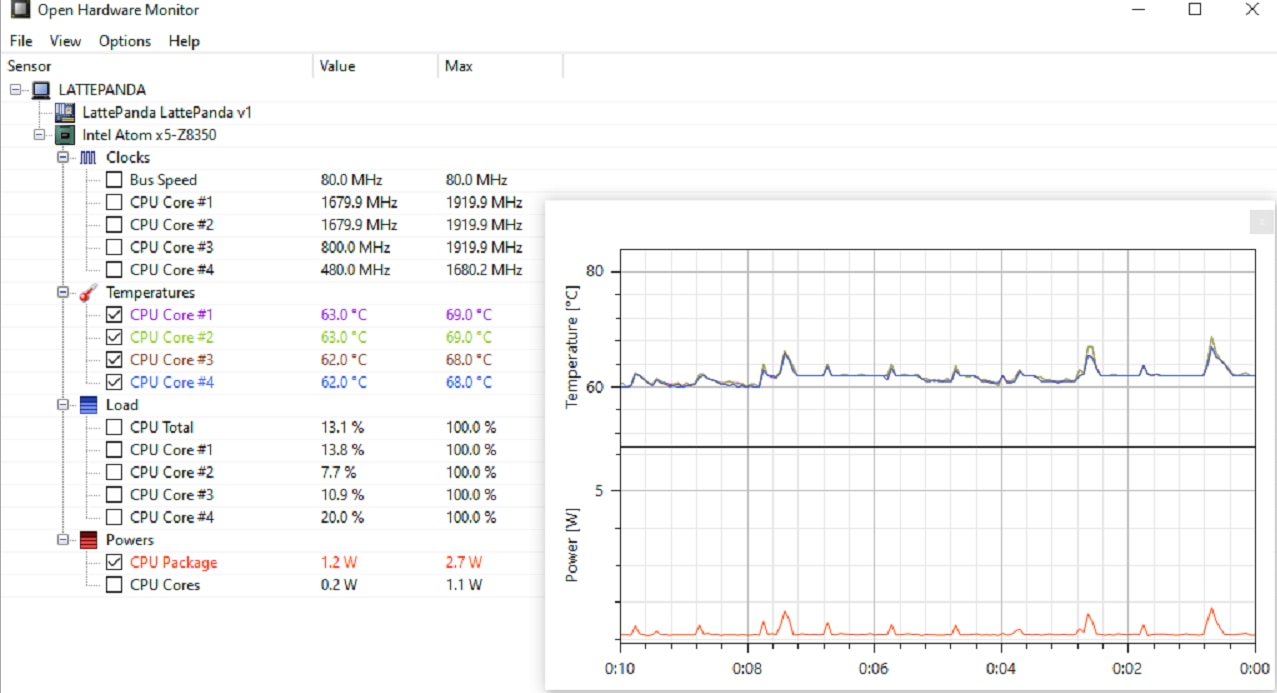
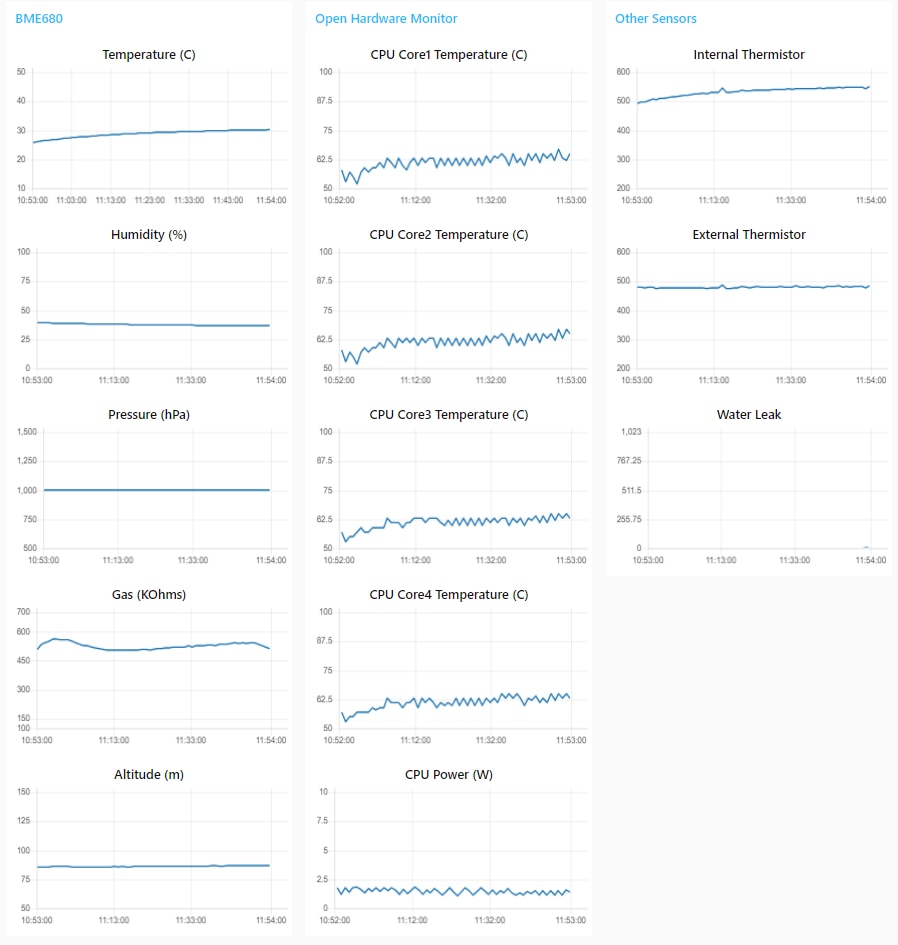
The next test is to increase the power consumption by running a continuously looping video at high resolution:
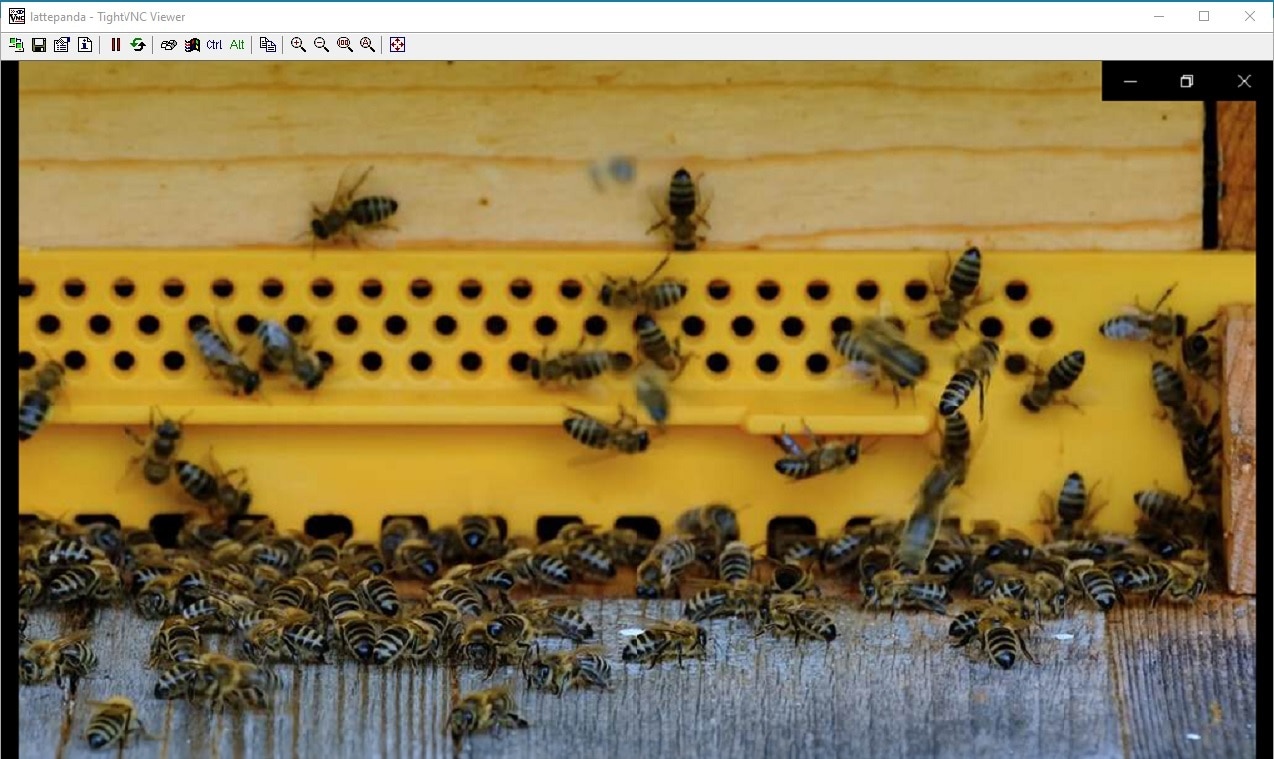
The power and temperature immediately start to increase:
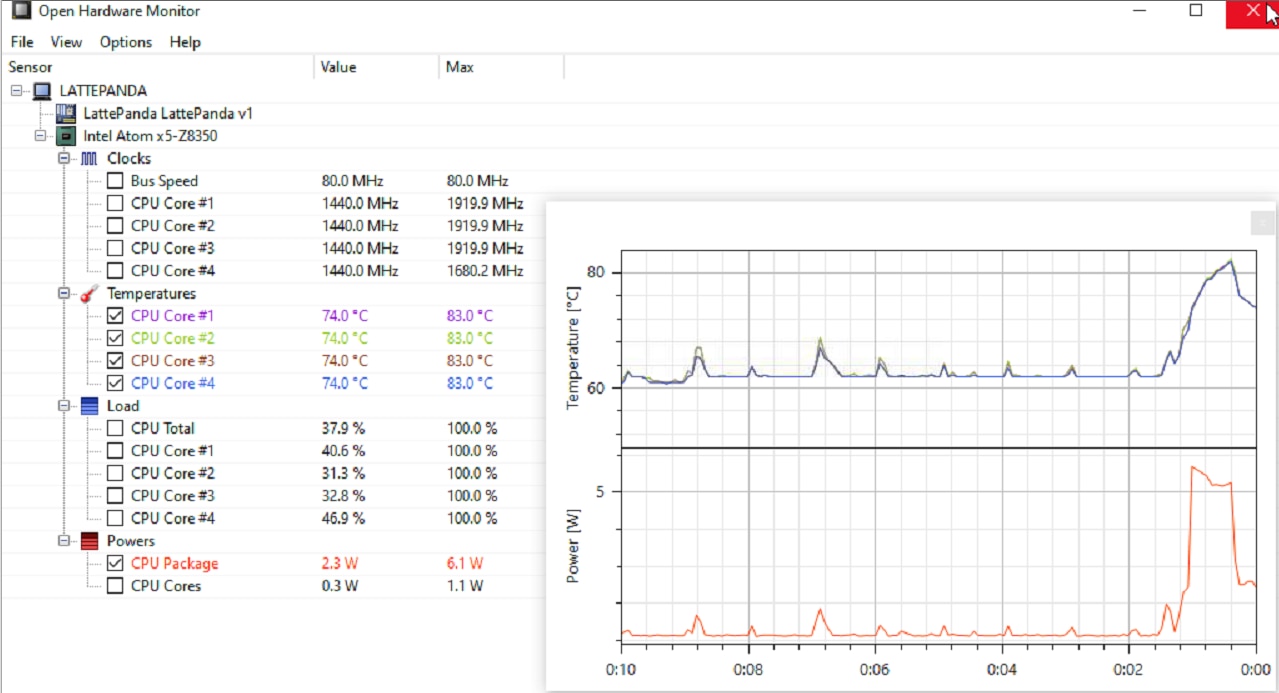
Until it reaches a peak average power of 5.8W and the CPU core temperature reaches the throttling temperature of 85C:
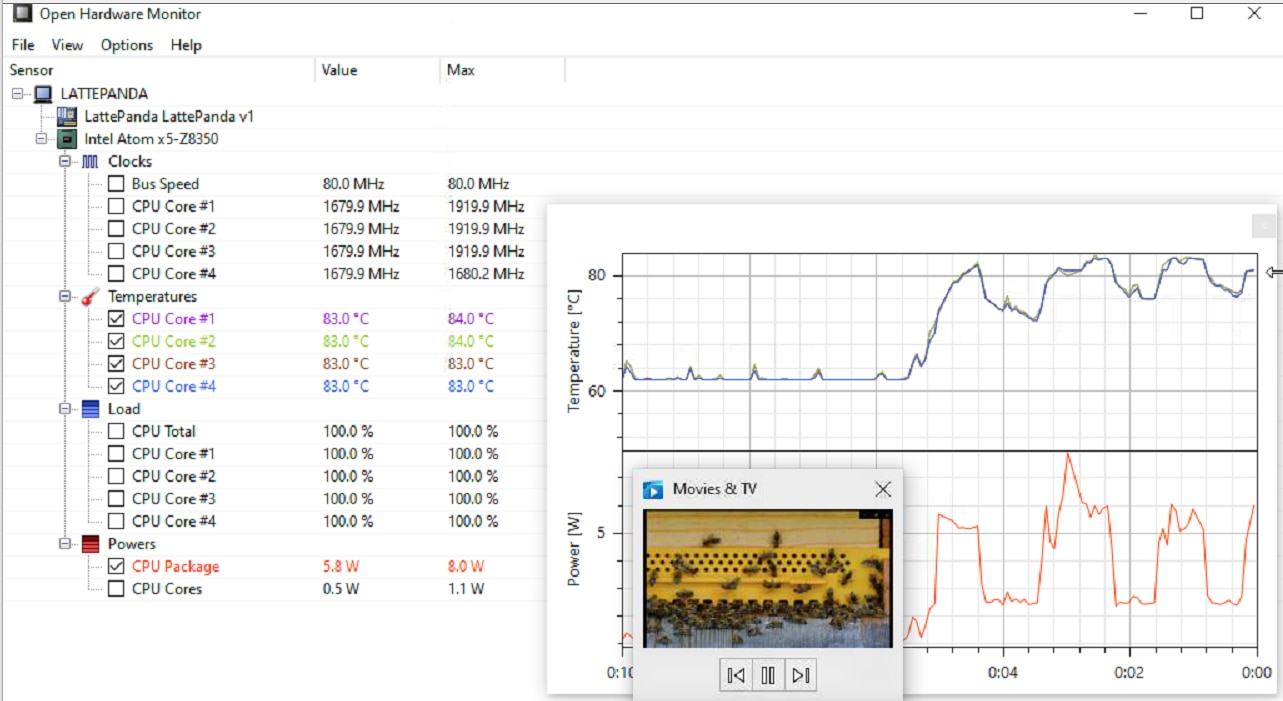
Then the clock speed starts to throttle back and the power starts to drop:
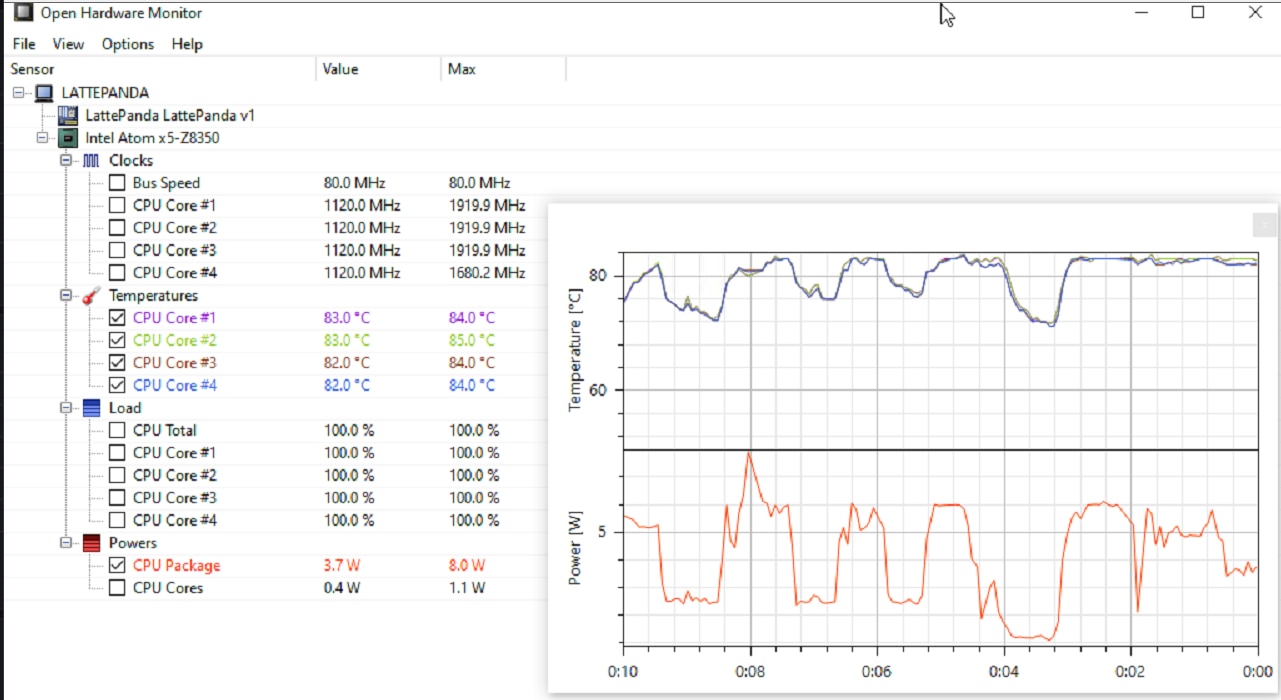
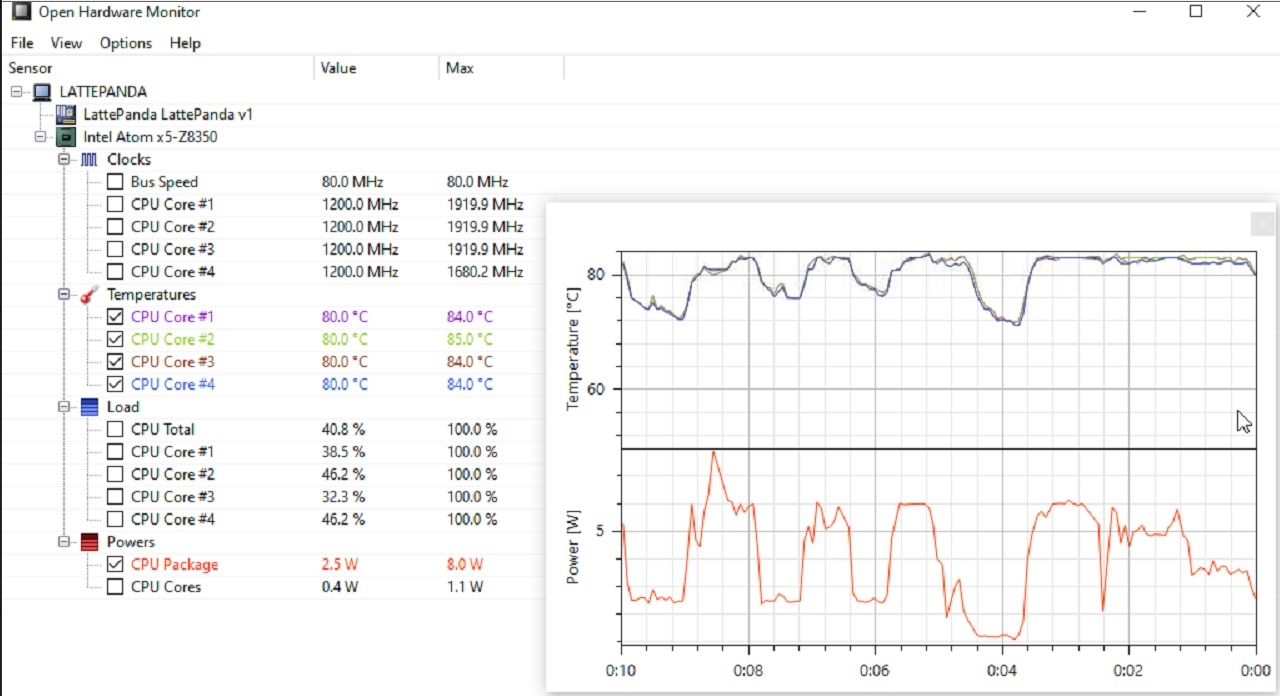
Here's the overview of the run showing the stable low power transitioning into the high power and throttling back:
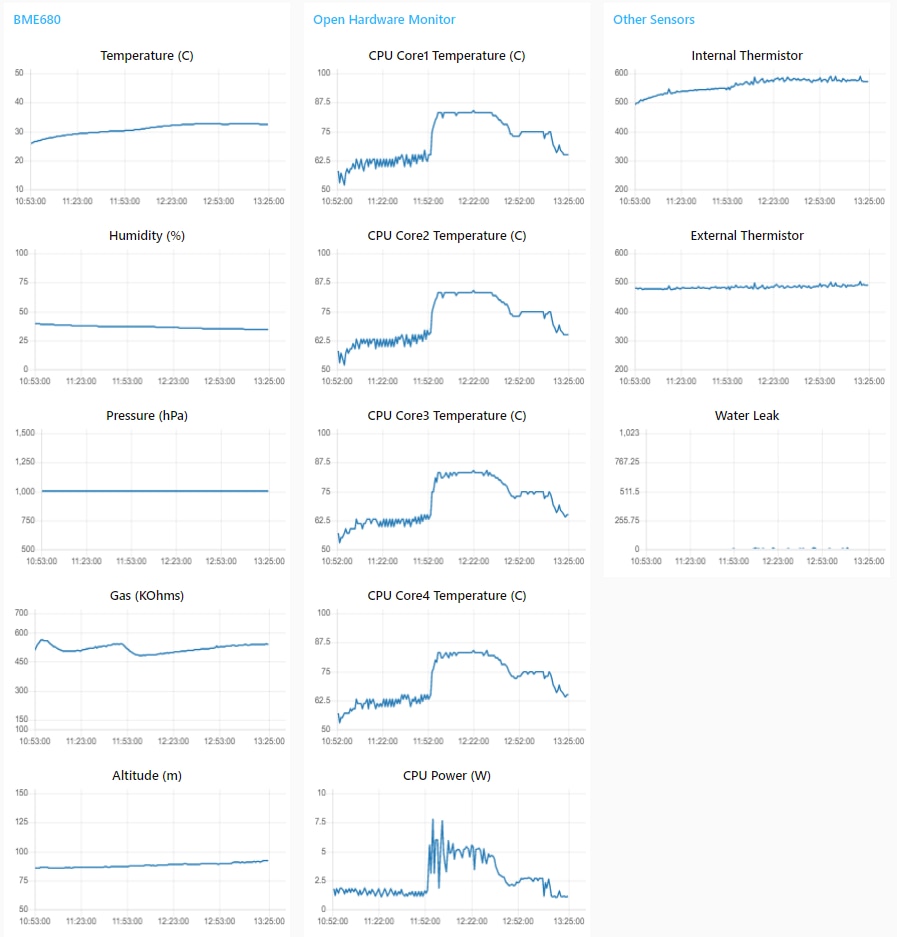
I found that in some cases if the CPU core temperature could not pull away from the 85C fast enough all the core clocks would throttle to 480MHz and at that point the throttling would "latch" and the clocks would not recover even after the load was removed. Then the only way to recover was to reboot.
With further testing I determined that to stay in the "stable" zone I needed to maintain the average power level at or below 2.5W.
Submersion Test
I am going to test the waterproof capability of the enclosure and connectors using a shallow submersion test. The top of the enclosure will be submerged 4" under the water's surface. The depth is limited by the basin that I'm using.
The frame is built using 1/2" Schedule 40 PVC pipe and adapters. The bottom assembly is shown below There are 4 holes to attach the enclosure.
The mounting holes on the bottom of the enclosure are indicated in Red. The mounting screws are inserted using channels outside the cover mounting gasket to preserve the waterproof integrity.


The enclosure attached to the bottom assembly.

The completed frame with the top assembly that brings the height to the top of the basin, so that I could clamp it in place with a couple of wood slats. I used this method to be able to quickly release the enclosure in event of failure.


The enclosure before and after cover attachment.


Positioned in the basin prior to clamping.

For the submersion test I am using the wired Ethernet, so I removed the WiFi antenna and covered the SMA connector with a plastic dust cap.

The view from my webcam (hence the fisheye distortion) prior to the start of the test. The reflection from the clear lid limits the camera visibility. You can see the reflection of the camera in the lower right.


A video of the first submersion test. My plan was to do the test in two phases. In the first phase I was just going to bring the water level above the level of the connectors and check for leaks at the connectors. If that was successful I was going to bring the water level to the top of the basin which would place the top of the lid under 4 inches of water.
At 3:09 into the video, the water reached the first phase level and I started visually looking for leaks. Unfortunately, I observed a slow drip at the RJ45 connector and after a couple of minutes decided to terminate the test. All the other connector positions and plugs looked fine.
When I dismounted the RJ45 backshell, it had water inside the rubber boot. The failure mode appears to be the inadequate seal between the rubber boot, rubber ferrule and the cable. I do not have a super tight fit between the cable and the ferrule, but I was counting on tie wraps to provide enough compression to prevent leaks (the backshell kit included a single tie wrap, but I had added a second one for good measure). Apparently I'm not getting enough compression for a good seal.

I think what surprised me is that the water inside the boot was able to get into the enclosure. The plastic backshell compresses the base of rubber boot around the screw mounting holes so that water should not be able to get from the cable area into the enclosure. It appears to be well designed with an interlocking design between the rubber boot and the backshell. It's possible that I was somehow not getting emough compression even though I had the screws as tight as I could without deforming the plastic backshell. The panel mounted RJ45 jack assembly is supposed to be watertight even in an unmated condition. I decided that I would verify that in a second immersion test.


I gasketed the backshell mounting holes and added a silicone dust plug to try to keep the contacts in the jack dry and proceeded with a second test without the backshell.

I did not video the second test so that I could keep the webcam out of my way. I instead took pictures with my iPhone at the different immersion phases.
Because I no longer had an Ethernet connection, I added a small flat WiFi antenna inside the enclosure (lower left against the inner wall) to transmit the sensor data.

At the first position with the connectors submerged, there were no leaks. I took data for 30 minutes then proceeded to the full submersion test.

Water just coming over cover:

Fully submerged: I had planned to run submerged for a couple of hours, but after an additional 30 minutes I stopped receiving data. There were no indications of leaks, so without powering down I removed the unit from the water and removed the lid. I then hooked up a portable external LCD monitor and determined that the lattePanda was still operating, but for some reason WiFi was no longer enabled. I verified that the Windows power plan configuration was set to never power down. The WiFi adapter also would not reconnect until I rebooted. I still haven't figured out what caused this failure. There was no indication that submersion caused it.

Fixture floating after I terminated the test:

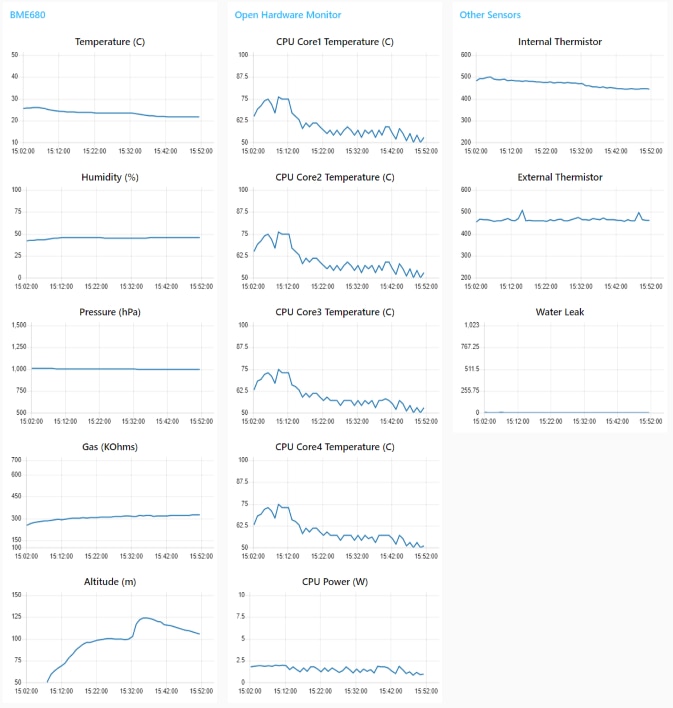
Here is the dashboard data for the hour long test run (the last 30 minutes fully submerged):
There were a few interesting things to note:
- The lower water temperature did affect the internal enclosure temperature (about -5 C over the hour)
- The CPU core temperature dropped more than the internal temperature (about -12 C) - part of this is due to a reduction in power (0.5 - 1 W, not sure what caused the power to drop)
- The Altitude (which is a value computed from pressure) has a weird response?
From a leakage perspective the second test was successful, so if I want to operate with the RJ45 connected in a submerged condition I will have to find a better method to seal the backshell.
Lessons Learned
- The first lesson learned is that the lattePanda V1 with 32GB of eMMC memory is probably not a good choice for doing development using Windows 10. This is due to the huge amount of space required by the Windows OS. The unit that I received only had 5GB of available space to start. It would be very nice to have a more portable Windows development computer than a laptop, so I'll try booting off a USB or SD drive. If that doesn't work, I'll probably switch to using Linux.
- For general purpose use, the lattePanda should have a heatsink and/or fan as it does not run without throttling above 2.5W.
- Waterproof cables should have rigid backshells. The USB and Circular mating connectors have hard plastic components and have a radially compressive structure to apply enough pressure to reliably seal the cable entry. Also, if the gasket and boot of the RJ45 assemblies had been thicker they would have provided a better seal.
A picture showing the compression mechanism to seal the cable entry on the USB external cable assembly

Summary
This was a particularly challenging challenge to document because there were so many elements and a ton of data. I think that it would have been better if I had used a video format like the E14 VCPs use, but unfortunately video production is not one of my strengths.
I did not finish with a fully waterproof assembly, but I believe that I know how to fix the problem. The easy way would be to add some silicone sealant to the RJ45 backshell/boot assembly, but that would make the cable difficult to replace. I think that if I could find a small hose clamp like they use on automotive tubing that would work well.
The thermal testing showed a practical average power limit of 2.5W for using the lattePanda without a heatsink. I think this is adequate for using it with general purpose sensors, but more processor intense operations like running ML models would probably require adding a heat sink. But using ML models might be tough to do anyway with the lack of available storage on this unit.
The Hammond enclosure was easy to work with. It is very sturdy and well designed with good fit and function. It will be interesting to see how well the polycarbonate material will perform outdoors over time. The customization of the connector cutouts was very precise. I wish that I had the ability to do that type of machining.
The Amphenol connectors in general worked very well with the exception of the RJ45 backshell which would have benefitted from a better boot design. Connectors are certainly more robust than using pass through cable glands as I have in the past, but they do require a lot more work in wiring. Using connectors has a clear advantage in portability by not having captive cables, so that probably justifies the additional work.
I did not use the Grafana visualization tool as much as I had planned because I'm early on the learning curve. I expect to use it a lot more in the future. I've found the Node-Red dashboard to be good for "in process" visualization, but I need to learn how to reload stored data.
It's been another great design challenge and opportunity for learning new products and tools. Thanks to E14 and Hammond and Amphenol for the challenge kit hardware.
Links to Project Blogs
- Panda Enclosure - Introductory Blog
- Panda Enclosure - Extra Credit Blog 1: Setting up the lattePanda
- Panda Enclosure - Extra Credit Blog 2: Wiring the Connectors
- Panda Enclosure - Extra Credit Blog 3: Sensor Software Development
- Panda Enclosure - Extra Credit Blog 4: Submersion Test Setup
- Panda Enclosure - Extra Credit Blog 5: Completion of Submersion and Thermal Monitoring Test Setups


Top Comments
-

JWx
-
Cancel
-
Vote Up
0
Vote Down
-
-
Sign in to reply
-
More
-
Cancel
-

ralphjy
in reply to JWx
-
Cancel
-
Vote Up
0
Vote Down
-
-
Sign in to reply
-
More
-
Cancel
Comment-

ralphjy
in reply to JWx
-
Cancel
-
Vote Up
0
Vote Down
-
-
Sign in to reply
-
More
-
Cancel
Children