Solar panels are prone to dust and dirt accumulation on their surface, reducing energy output by up to 50%. Solar farms have gantry robots or sprinkler systems to clean panels on a regular schedule, but for micro installations such as those on top of street lamps, remote setups, or smaller home installations, cleaning on a regular basis is not economically feasible. Simply tracking the output of the panel is not enough. local cloud patterns and weather affect output, making it unclear whether a drop is due to weather or dust accumulation. The proposal is to design a predictive system which can detect when solar panel cleaning is required before the output drops. Solar panels industry is a place where keeping them clean at the right time will differentiate good profit and loss.
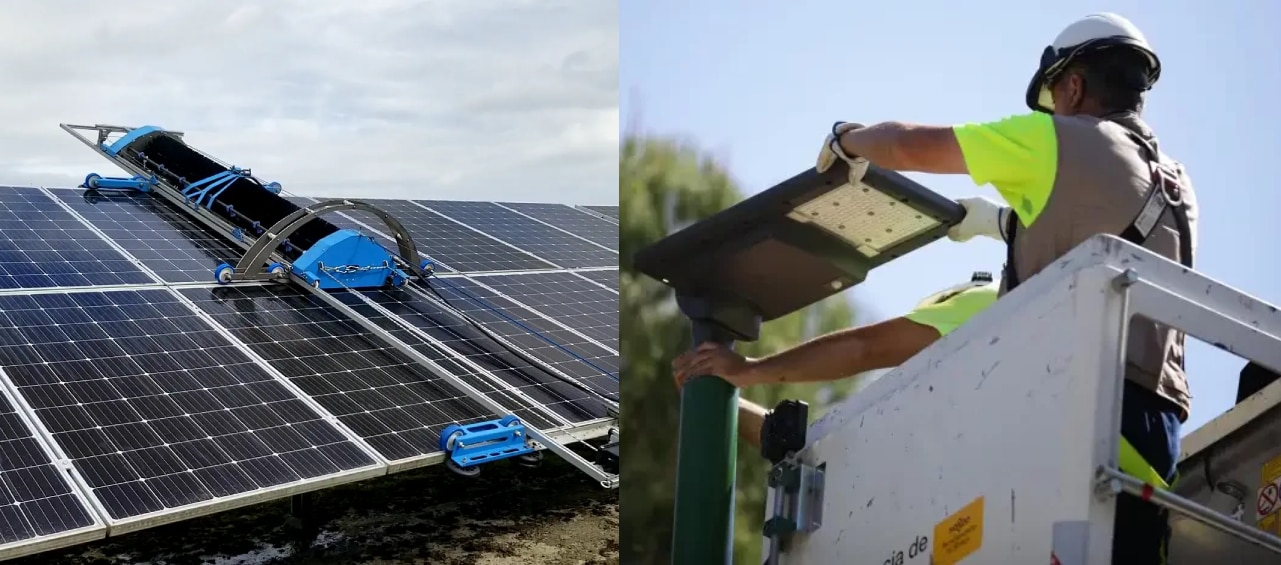
The goal is to predict when cleaning is actually needed using AI to monitor data from couple of different sensors, instead of cleaning on a fixed schedule or after the output is severely degraded. This project is close to my heart as it is part of my Masters Thesis where I developed a solar panel cleaning micro robot.
In this challenge I want to build a system where three solar panels ( 3×1W, 5.5V panels which i had previously bought from China) will have their output measured by the Arduino UNO Q alongside a suite of environmental sensors. One panel is kept mechanically clean at all times as a live reference. Whatever current it produces at any given moment is exactly what the other two panels should produce under the same sky. Any deviation is soiling is measured live, tagged automatically, no ambiguity.
Forum Posts - The Story so far
Previous posts, Read them for more in depth details of the Progress and Technical Details.
- SolarSense - Part 1 - Introduction, The POC Built and The Plan
- SolarSense - Part 2 - Can Arduino CAN?
- SolarSense - Part 3 - PCB Schematics Walkthrough
- SolarSense - Part 4 - CAN Protocol Deep Dive and Implementation
- SolarSense - Part 5 - Making an Live Dashboard using Lab View
- SolarSense - Part 6 - Reading the Heat at K Type Thermocouple using MAX31855.
- SolarSense - Part 7 - Reading the Sky - UV Sensor Interface on STM32
- SolarSense - Part 8 - Interfacing Humidity and Temperature
Part 1 is where I established the concept. I set up three solar panels with one kept pristinely clean as a reference, and the other two allowed to accumulate soiling. The idea is to divide the test panel’s output by the reference output – that ratio cancels out weather completely because both panels see the same sky. Edge Impulse AI then classifies whether a ratio drop is dust or just a passing cloud. I had a rough POC already running on a Raspberry Pi and Odroid . Running K-means anomaly detection gave 44% accuracy, a 3-class neural network got to 67%. Good enough to prove the idea.
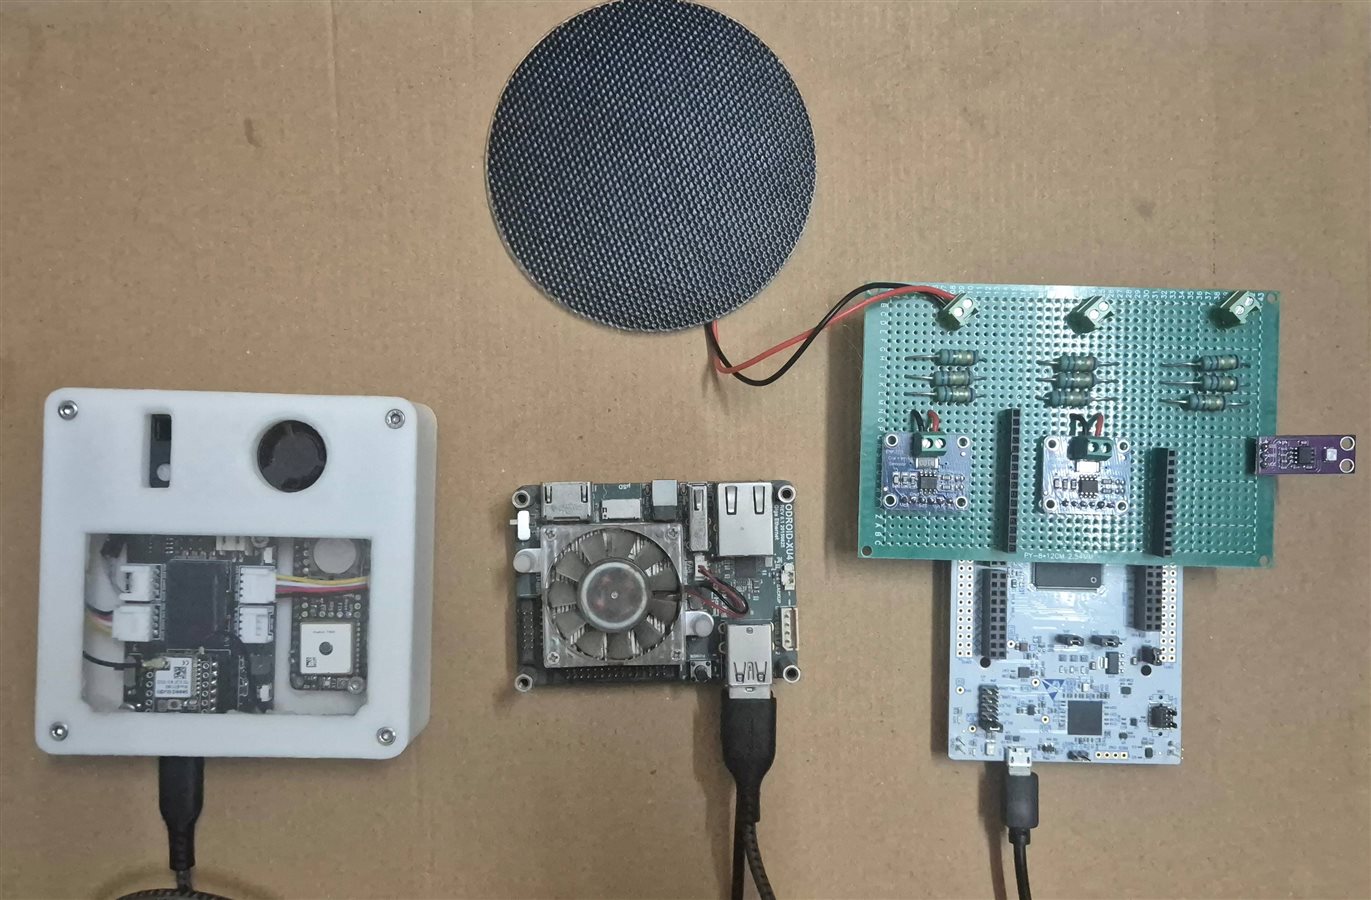
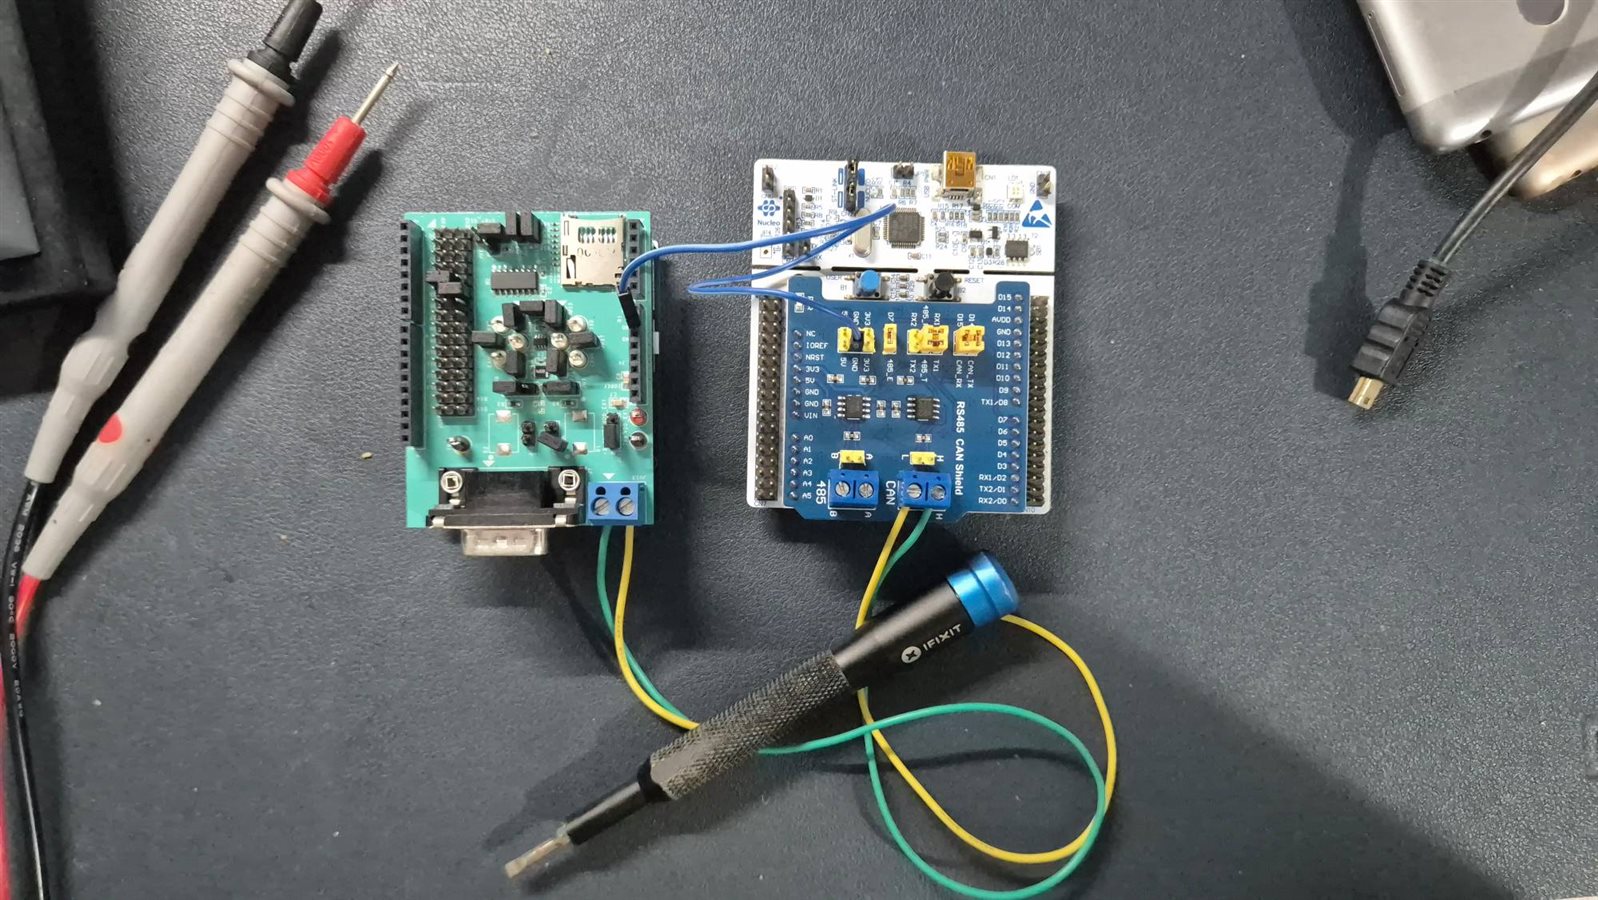
Part 2 was where the Arduino UNO Q entered the picture and starting tantrums when I tried to use the CAN peripheral and so I took control of the STM32 directly and bypass the Zephyr stack entirely. I disabled arduino-router, flashed bare metal STM32HAL firmware, got the FDCAN peripheral running, and had CAN frames showing up on the oscilloscope.

Part 3 was my PCB schematic deep-dive: INA219 per panel, MAX17048 fuel gauge, BMP280 for pressure, CN3791 MPPT solar charger, TPS61040 boost for the 12V loop, TPS63020 buck-boost for VSYS, the whole sensor ecosystem. Seven I2C devices, three SPI devices, two ADC channels, one 4-20mA current loop.

Part 4 is where I documented the CAN protocol design. I went with classic CAN at 500 kbps with 11-bit IDs, organising everything into 10 standard 8-byte frames (IDs 0x100-0x109) covering system power, three panel channels, thermocouple, BMP280, HX94C, and three air quality frames from the SEN66. B
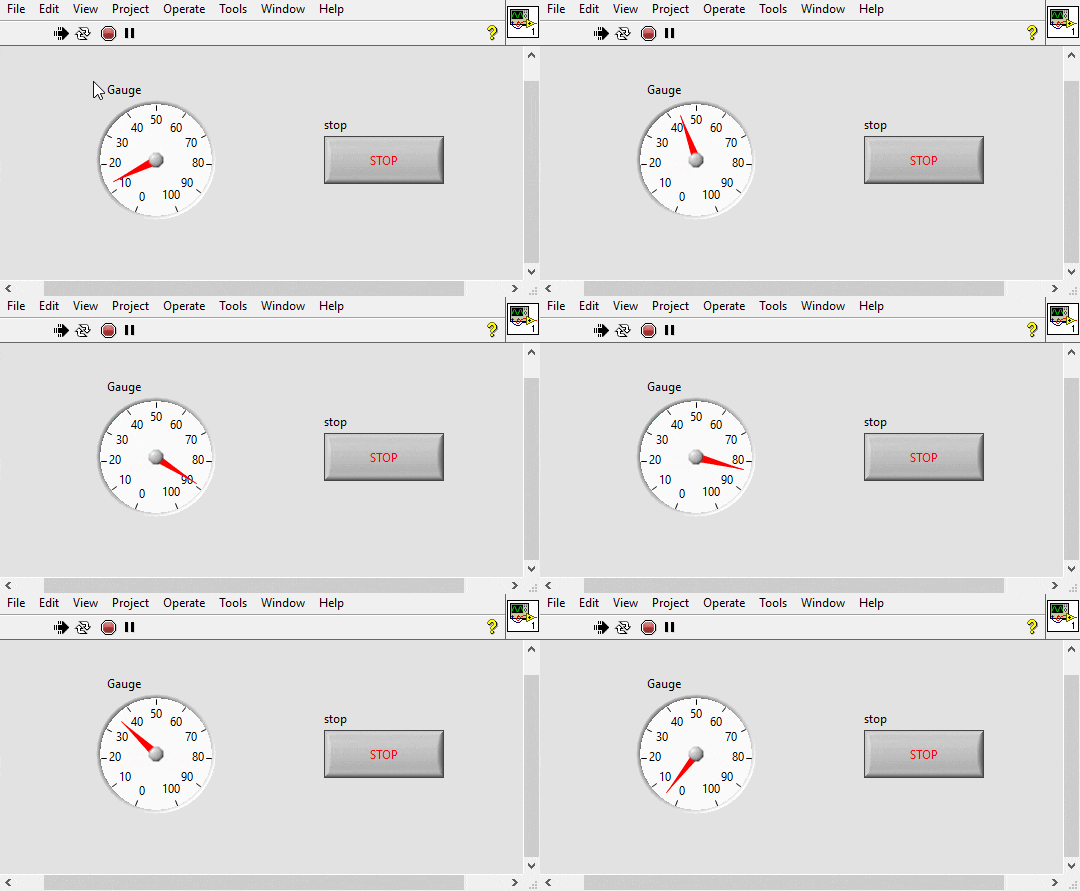
Part 5 was LabVIEW. I had not touched it since my undergrad Control Lab and I was not exactly thrilled to revisit it. The Community version turned out to be perfectly capable for what I needed - a TCP socket reader that parses JSON and drives panel gauges, soiling LEDs, UV index, AQI, humidity, temperature, and battery SOC. I ran a demo using a simulated sine wave data.
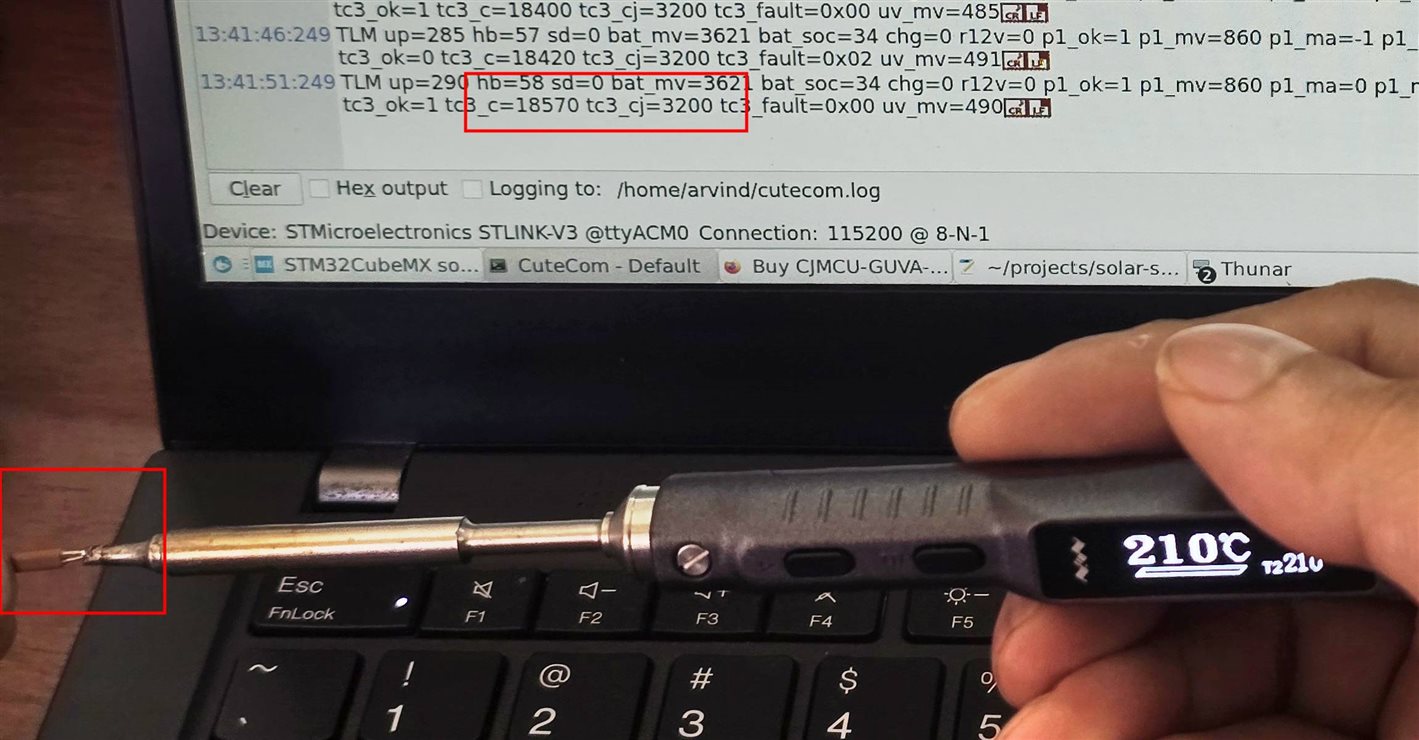
Part 6 was the MAX31855 thermocouple interface. I wired up a K-type thermocouples, to measure surface temperature.
Part 7 was the GUVA-S12S UV sensor. UV does not track visible light, a covered sky can still have a punishing UV index. Without UV in the model, I cannot distinguish “panels are running low because the sky is genuinely dark” from “panels are running low because the surface is dusty.” UV provides the context the model needs to make that distinction correctly.
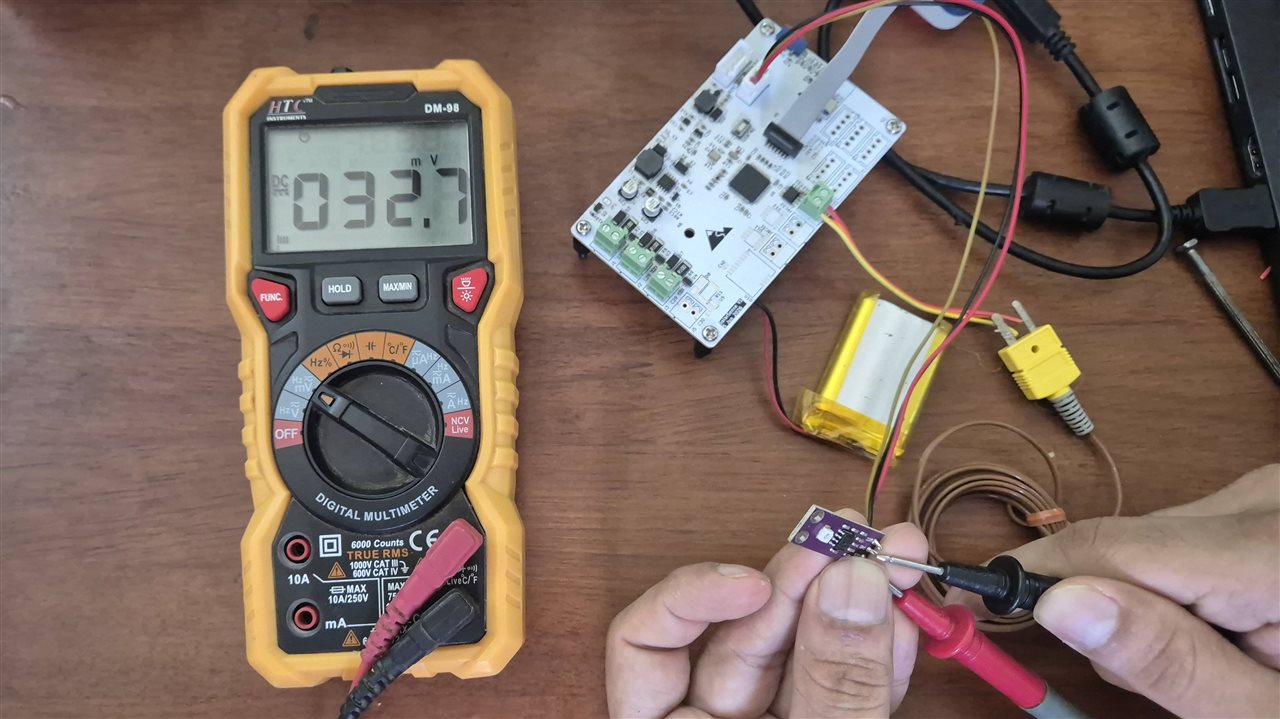
Part 8 was the HX94C 4-20mA humidity and temperature probe. 150 Ohm shunt resistor, 12V boost converter.

and the Mechanicals
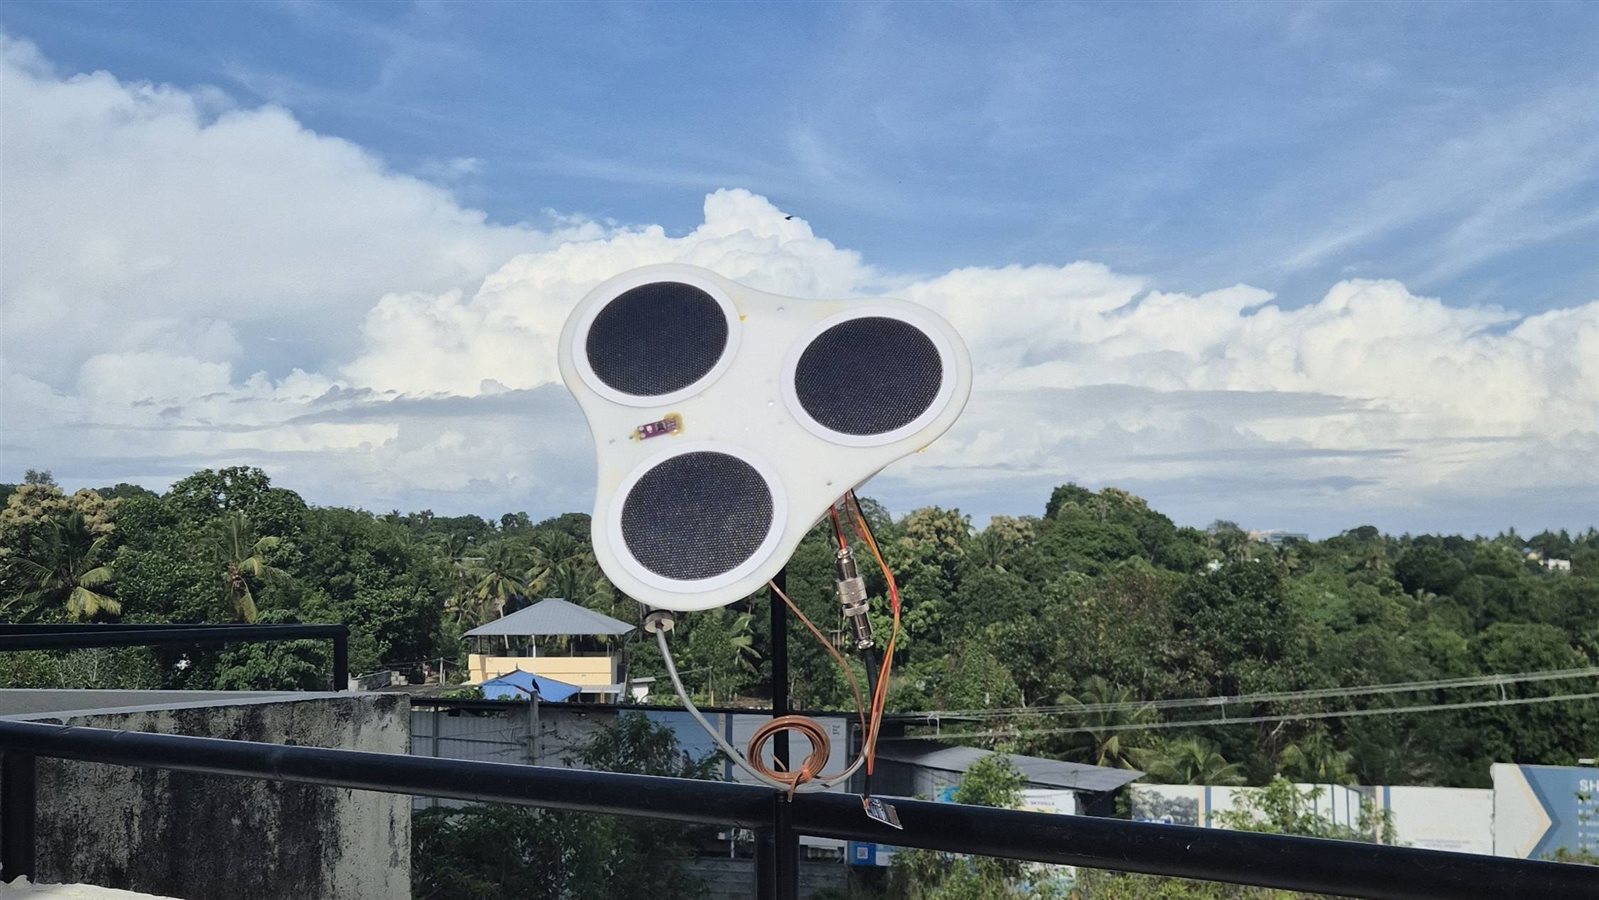
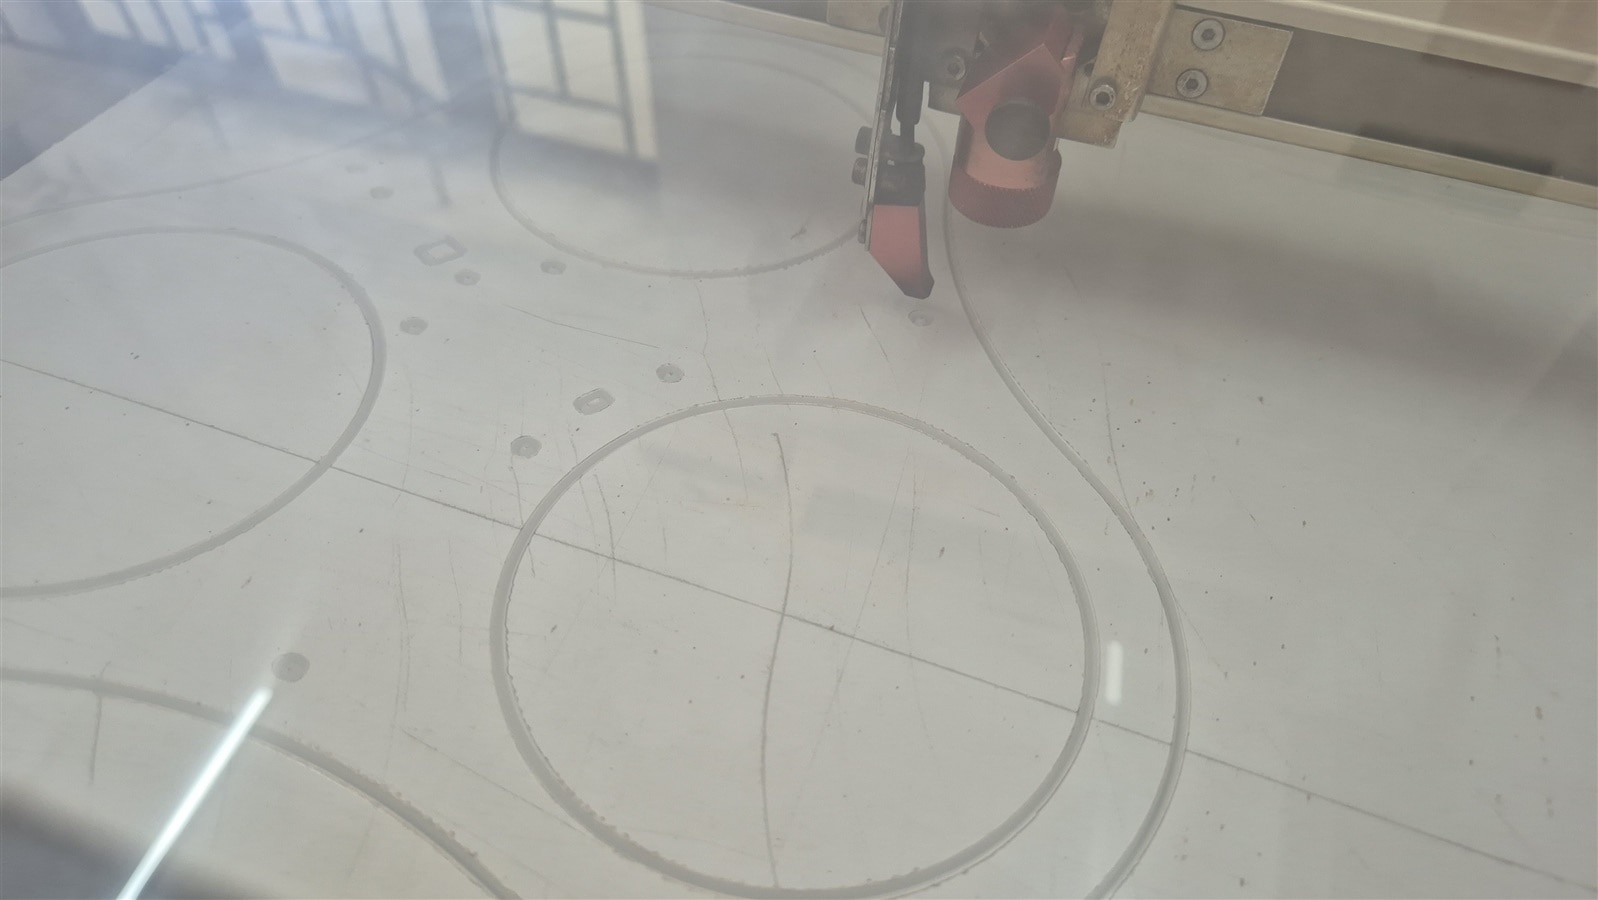
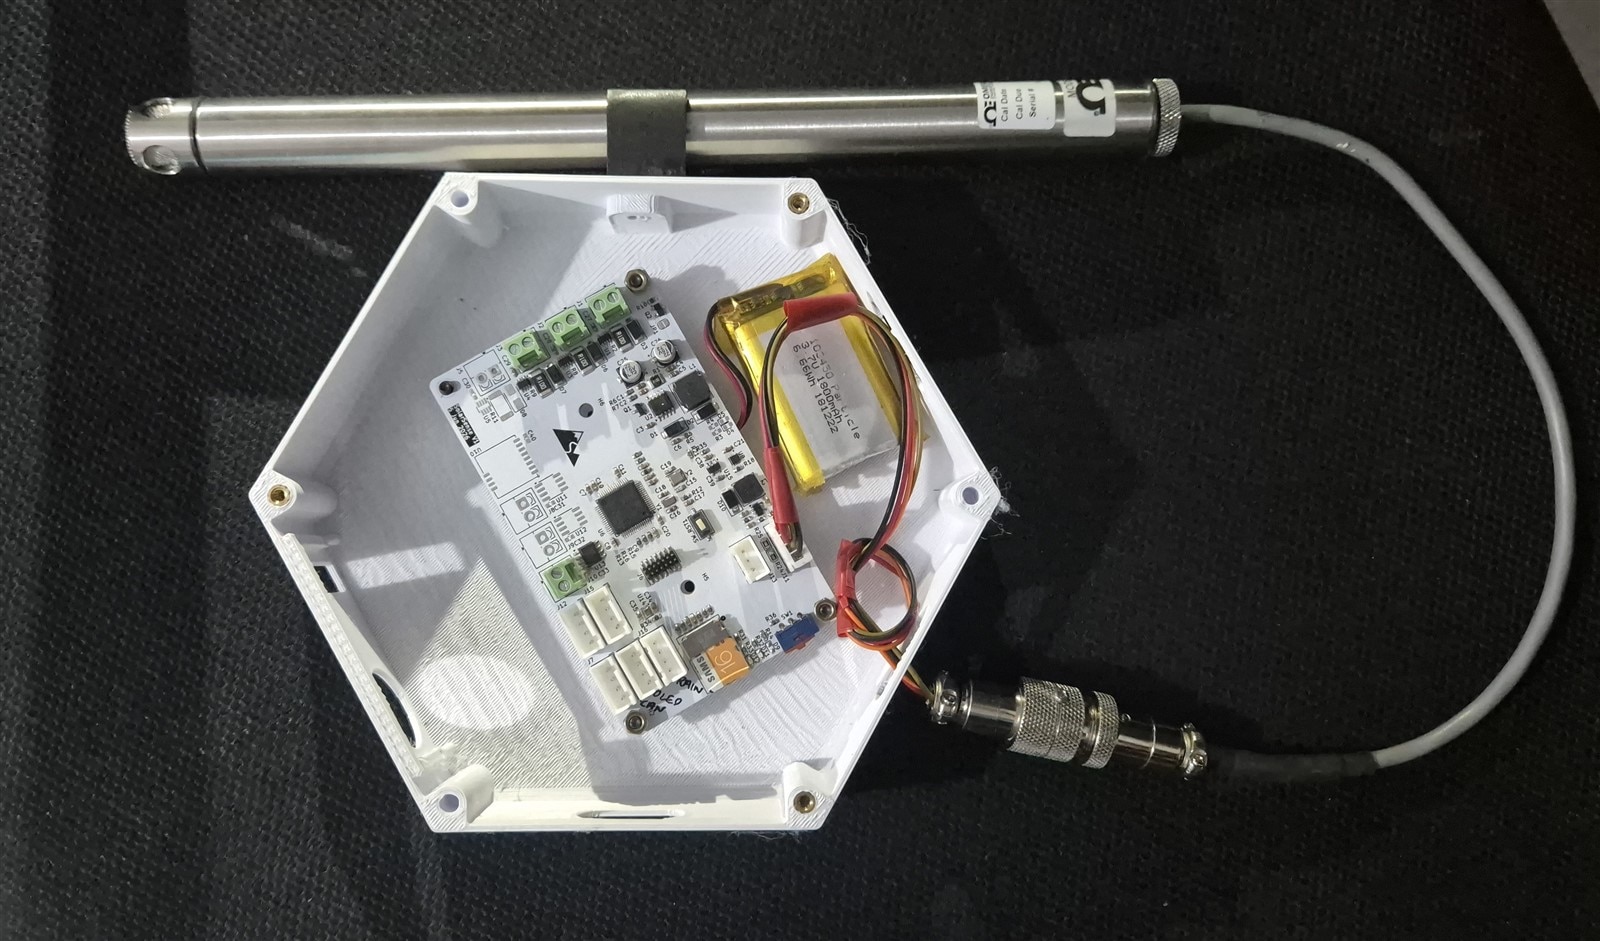
I made a White acrylic panel using Laser cutting to keep the Panels organized with a cute triangular outline. I did add in holes for the rain sensor and UV sensor and and matching box to secure my electronics. I did not have PETG filament to 3D print the box so I replaced it with PLA for the time being. Also during the laser cutting, I somehow managed to scale up the diagram that the panel did not fit in, so I had to print a 3D spacer for a snug fit. The Wall Clip that came in with the HX94C came in handy to mount the sensor on the side of the box. I am not sure if I mentioned this before, but everything is White to effectively reduce the temperature increase of the box itself by absorbing the solar heat. Even the PCB is White.
The Missing Test
I tested everything, Sensors, SD Card, CAN but What i missed was the charging of battery. It was night and so I tested using a normal Desktop Power supply.
But as i tested further, I ran into problems
The over-voltage scenario:
With the CN3791 MPPT charger in CV mode, the cell terminal climbed to 4.41V at full charge current (CV loop not yet engaged). At that point, the pack's internal PCM over-voltage protection tripped. the fuel gauge dropped from 4410 mV to 915 mV momentarily (chg flag to idle) and then the cell gracefully auto-recovered to a safe 4.216V OCV once charge was removed.
Key measurements (DMM at battery JST, supervised by toggling charge off):
| Condition | V at JST | Notes |
|---|---|---|
| Charging | 4.288 V | Terminal inflated by I·R rise |
| Charger off (rest OCV) | 4.144 V | True cell state — the safety metric |
| Voltage difference (immediate sag) | 0.144 V | Resistive drop across pack impedance |
Charge current measurement (via 0.1 Ω in-line shunt):
| Condition | Measurement | Derived |
|---|---|---|
| Charging, V across 0.1 Ω | 41.4 mV | I = 41.4 mV / 0.1 Ω = 414 mA |
| Charging, PSU current | 400 mA | External reference |
| Battery removed, PSU current | 22 mA | Board + charger idle load (confirms ~390 mA went to cell) |
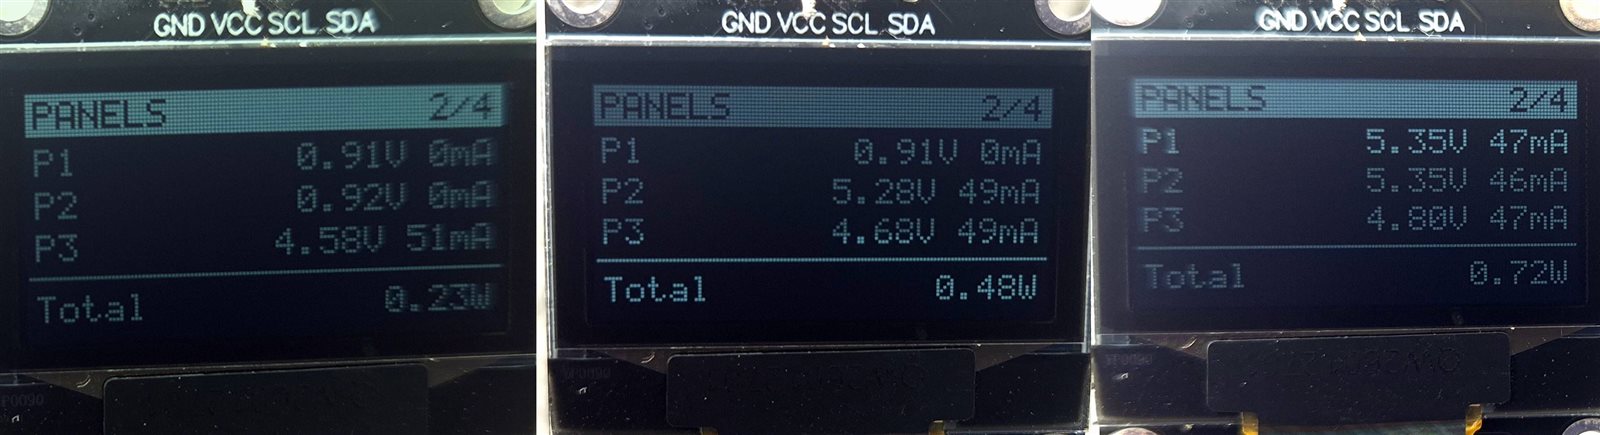
The protection circuit of the Lipo t worked exactly as designed. It caught an over-voltage excursion that the CN3791 CV feedback loop failed to prevent. I haven't been able to solve this. I have a gut feeling it could be the reverse protection circuit affecting the reading seen by CN3791. Regardless, Now that I know there is no risk to the LiPo, I went ahead and tested with the solar panels. I added one panel at a time, and It was a very over cast day and so the panels never reached their full power output of 1W each. But

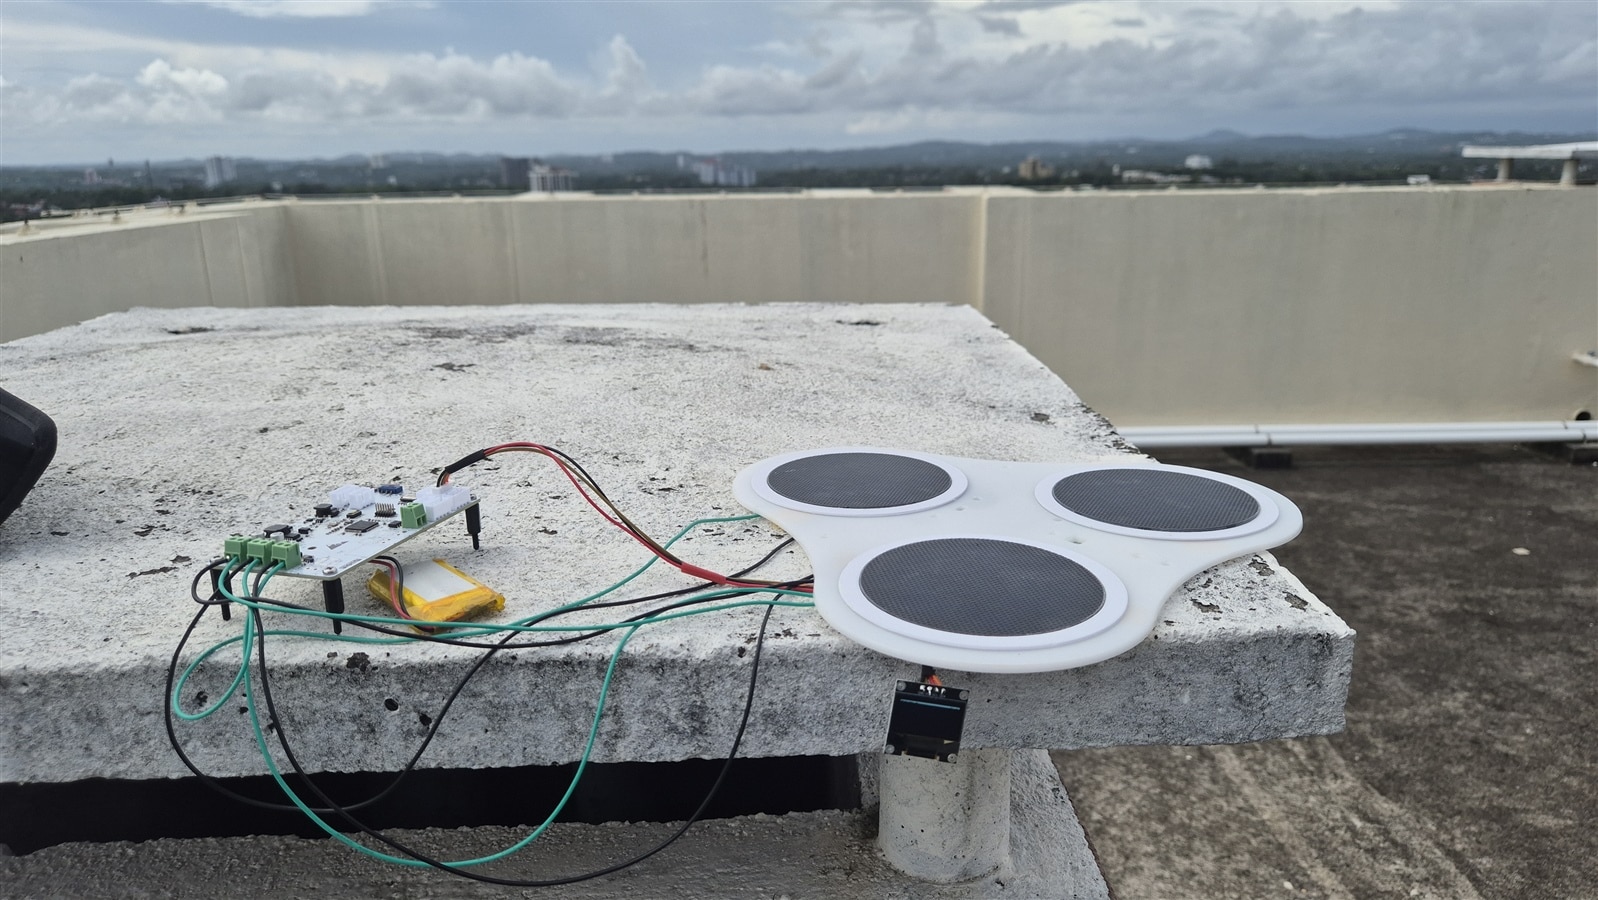
With this every unit test is completed and off to the final integration. here is the Fully wired system

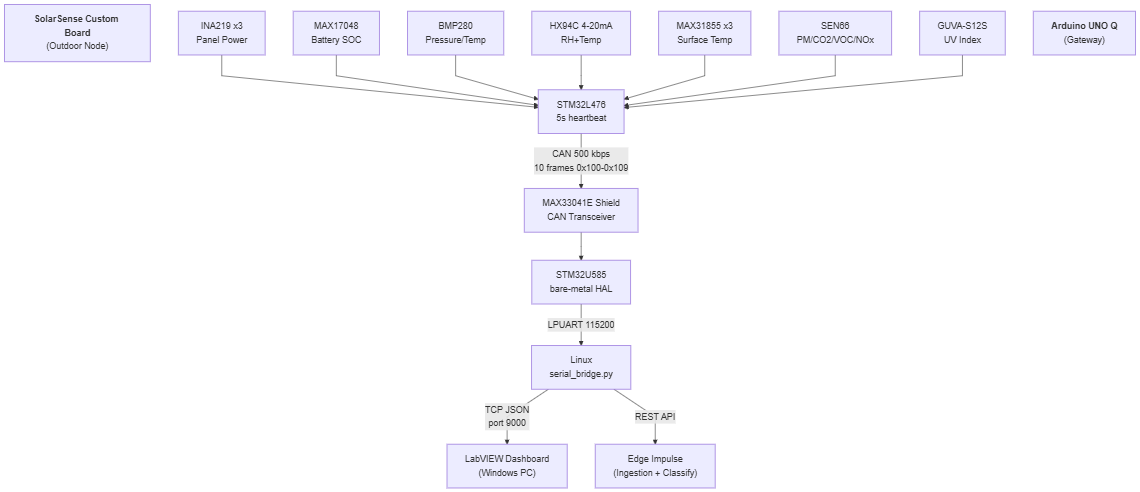
That is the full picture. Everything on the outdoor node talks to the STM32L476 over I2C, SPI, ADC, or the 4-20mA current loop. Every 5 seconds, the firmware packs all of that into 10 CAN frames and fires them out at 500 kbps. The Arduino UNO Q's STM32U585 receives those frames via the MAX33041E shield, reassembles them into a key=value text line, and ships it over to the Linux side through LPUART (/dev/ttyHS1). On the Linux side, serial_bridge.py parses that line, computes soiling ratios and UV index, and simultaneously serves a JSON dashboard to LabVIEW on TCP port 9000 while ingesting data into Edge Impulse for AI training.
The CAN Side: 10 Frames, One Snapshot
The firmware builds a SolarSenseTLM_t struct every heartbeat -- essentially a complete snapshot of every sensor at that instant -- and hands it to CAN_TLM_Send(). That function packs everything into 10 standard 8-byte frames and fires them in sequence. Each frame has a fixed ID so the receiver can decode them independently.
| ID | Name | What's inside |
|---|---|---|
| 0x100 | SYS | Battery mV, SOC, charger state, 12V rail flag, SD flag, UV mV |
| 0x101 | P1 | Panel 1: ok flag, bus mV, current (tenths mA), power mW |
| 0x102 | P2 | Panel 2: same |
| 0x103 | P3 | Panel 3 (clean reference): same |
| 0x104 | TC | Thermocouple: ok, fault, surface temp, cold junction temp |
| 0x105 | BMP | BMP280: ok, board temp, pressure Pa |
| 0x106 | HX | HX94C: ok, fault, RH (tenths %RH), temp (centi-degC), loop current |
| 0x107 | AQ-PM | SEN66: ok, PM1.0, PM2.5, PM4.0 |
| 0x108 | AQ-Gas1 | SEN66: PM10, internal RH, internal T, VOC index |
| 0x109 | AQ-Gas2 | SEN66: NOx index, CO2 ppm |
One thing I had to think about carefully: what happens when the CAN bus is not physically connected? This problem did occur when i had a loose connection with the screw terminal connector. With AutoRetransmission=ENABLE (which the HAL sets by default), an unACKed frame sits in a TX mailbox until the bus goes Bus-Off. With 10 frames per heartbeat and only 3 TX mailboxes, you can fill up the mailboxes in under 3 frames and then the next heartbeat has nowhere to put its frames. The fix is immediate drop-and-move-on. The send_frame() function checks for bus faults first -- if HAL_CAN_GetError() returns any of BOF | EPV | EWG | ACK, it returns HAL_ERROR immediately and does nothing. If no TX mailbox is free, it returns HAL_BUSY immediately rather than waiting. CAN_TLM_Send() calls send_frame() for all 10 frames and ignores individual failures -- the UART heartbeat is still the primary data stream. CAN is a bonus, not a blocker.
At boot, the firmware logs either:
CAN TLM started @500kbps
or:
CAN TLM start FAILED - CAN TX disabled
So at least you know from the serial monitor whether the bus initialised.
The Bridge: ArduinoQ's STM32 to Linux
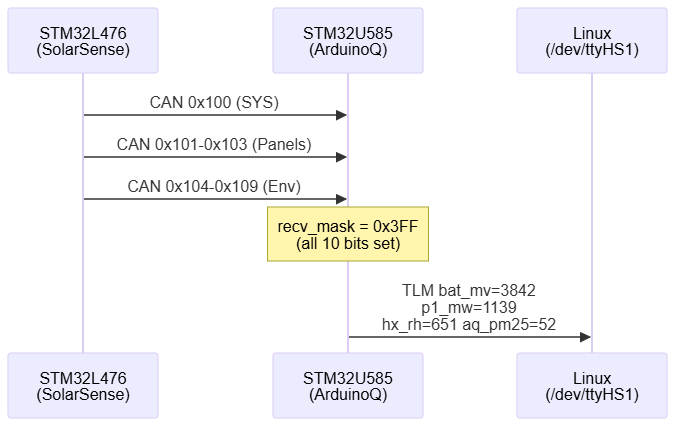
The can_bridge.c module on the Arduino UNO Q STM32 maintains a shadow struct for received frames. It has a recv_mask bitmask -- 10 bits, one per expected frame ID. Each time a matching frame arrives, the corresponding bit flips. When all 10 bits are set (or a 500ms burst timeout fires), it assembles a Telemetry text line in the same format as the SolarSense UART heartbeat and sends it to the Linux side over LPUART1 at 115200 baud. This is a simple way to keep track of the messages received via CAN bus and ensure that the latest data is made available to the system.
The Python Bridge: Serial to LabVIEW and Edge Impulse
serial_bridge.py is the brain of the ArduinoQ Linux side. It opens /dev/ttyHS1 at 115200 baud, reads TLM lines, and does three things with each one:
1. Computes derived metrics
The raw TLM (Telemetry) line has integer values with fixed scale factors. The bridge converts them:
panel1_ratio = p1_mw / p3_mw      # P3 is the clean reference
panel2_ratio = p2_mw / p3_mw
humidity     = hx_rh / 10.0       # tenths %RH
temp         = hx_t  / 100.0      # centi-degC
aqi          = aq_pm25 / 10.0     # tenths ug/m3
uv_index     = uv_mv / UV_MV_PER_INDEX   # config.py, default 110
battery_soc  = bat_soc / 10.0     # tenths %
The soiling ratio is the core metric. A clean panel gives a ratio near 1.0. Dust pushes it below a threshold. The thresholds are in
2. Serves a TCP JSON stream to LabVIEW
Every update gets serialised to a newline-delimited JSON object and sent to connected LabVIEW clients on port 9000:
{
  "panel1_ratio": 0.92,
  "panel2_ratio": 0.87,
  "uv_index": 6.3,
  "aqi": 24.1,
  "humidity": 68.4,
  "temp": 31.2,
  "battery_soc": 78.3,
  "cleaning_status": "SCHEDULE",
  "ts": 1750497600
}
This is exactly the format the LabVIEW dashboard expects -- unchanged from Part 5. The dashboard does not care whether the data came from a simulated sine wave server or a real sensor chain. It just reads JSON.
3. Feeds Edge Impulse
A background thread maintains a 30-second rolling window of data points. Every 30 seconds it POSTs the window to Edge Impulse's Data Ingestion API, attaching the current classification label derived from the soiling ratio
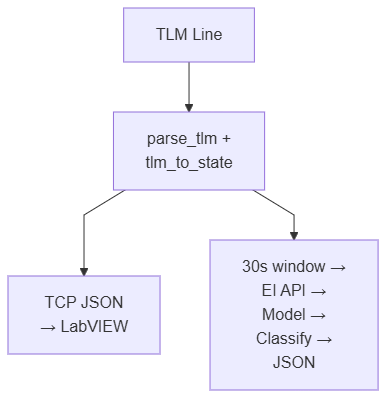
When EI_CLASSIFY_URL is set (the REST endpoint of a deployed EI model), the bridge also calls classify on each new data point and adds the cleaning_status field to the JSON from the model's prediction rather than the threshold rule. That is the point where the system stops being threshold-based and starts being AI-driven.
The six features fed to the classifier: panel1_ratio, panel2_ratio, uv_index, aqi, humidity, temp. These are the same six that showed up as the most discriminating in the POC experiments from Part 1.
The LabVIEW Dashboard
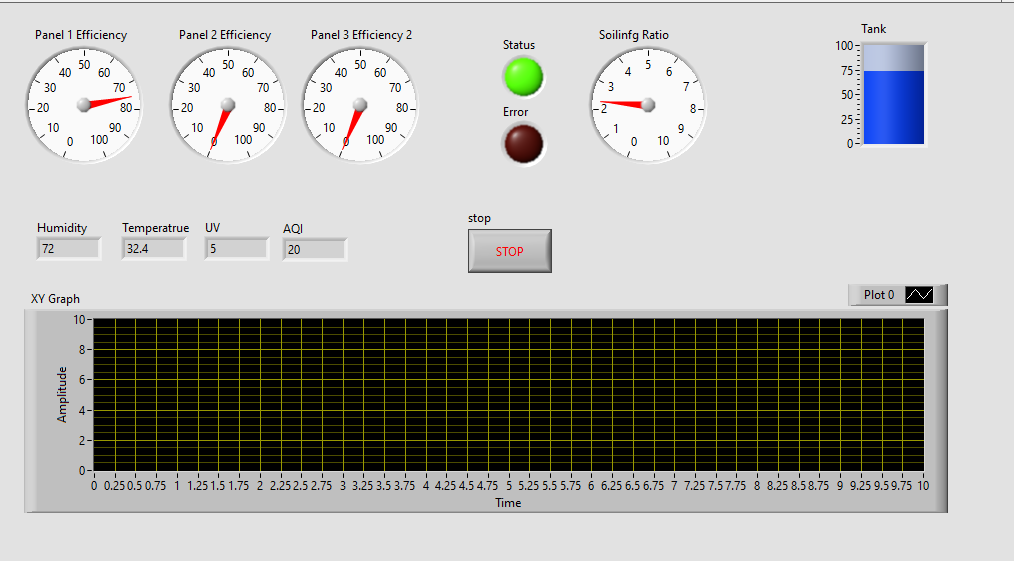
If you read Part 5, you know how the dashboard is wired. TCP Read -> Unflatten from JSON -> distribute values to gauges and LEDs. The dashboard has:
- Two panel ratio gauges (0.0 to 1.0)
- UV index gauge (0 to 12)
- AQI display
- Humidity and temperature numeric indicators
- Battery SOC gauge
- Cleaning status LED (green / amber / red)
- A chart that plots panel1_ratio and panel2_ratio over time
Nothing changed on the LabVIEW side. The format of data was locked in Part 5 and I kept it.
The Sponsored Kit - What all did I use
- Arduino UNO Q
- MAX33041ESHLD# Shield
- OmegaDwyer HX94C
- OmegaDwyer 5SRTC-TT-K-24-72 Type-K Thermocouples
- Emerson NI LabVIEW
The only thing i couldn't use was the PicoBlade connectors, It was a shame, because I am an avid user of JST PH, SR and XH series, and finding some alternative was good but, my plan required 6x4pin variant and 1x3pin variant and the Board connectors though not expensive (not affordable either), the Cable assembly was quite expensive and so i stuck to the affordable JST XH series.
What Remains
Before I reveal to you the final working, I better tell you what is not implemented yet
- Need to implement Sleep options for all sensors and STM32 itself
- Implement the Rain sensor.
- Collect the data for 30~60 more days for more accurate prediction
- Integration of the Final Deployed Device with CAN. The integration was tested on workbench but not at deployed area, I still have to route a cable between the Terrace and my home.
AI Accuracy Results
Here is the accuracy of the model after 1 day of data collection. For reference it was 67.3 in the POC after 30 Days of training. Now this does not seems to be a good increase, but looking at the data, i can confirm that the data coming in with these sensors and the ability to keep it far away from shades due to more data availability over CAN Bus has significantly improved the quality of data that can be used for training.

Now, I could only get one set day of actual data. It' still raining cats and dogs and I am not confident that I've made my casing water proof.
Sensor Data Comparison
One of the important nuance about HX94C is that since it is kept outside the box, it would side variations due to wind, climate etc and is immune to heat generated by the PCB itself. So i ran a comparison between them. with the SEN6X inside the box. (The final mounting has SEN66 fan facing outwards) but still HX94C outperformed. and plotted the candlelight chart.
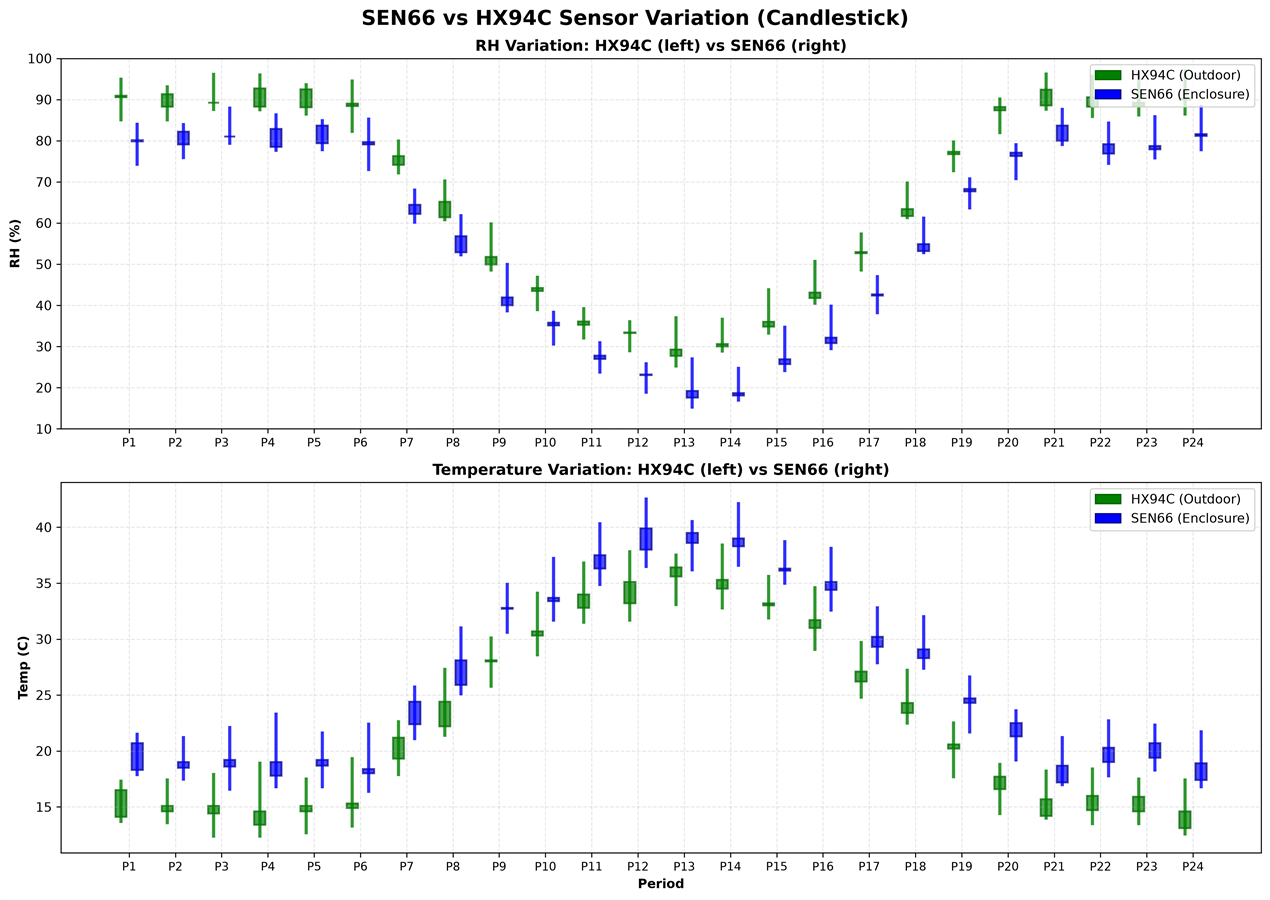
Green (left) is HX94C sensor which is outdoor, mounted on off-board cable. Blue (right) is SEN66 sensor which is inside the enclosure.
HX94C shown in green shows more variation because it is an outdoor sensor exposed to real environmental conditions. SEN66 shown in blue shows less variation because it is inside the enclosure and thermally stable. SEN66 RH is approximately 10 percent lower than HX94C because the enclosure is hot and dry. SEN66 Temperature is approximately 4 deg C higher than HX94C because of PCB self-heating and the internal fan. Both sensors track together which indicates good correlation despite the bias differences.
The Code
Code for the project can be found at https://github.com/arvindsa/solar-sense-e14-challenge
Now, I can't stress enough that the CN3791 tries to overcharge the LiPo Battery and without a Protection circuit, the LiPo battery is at serious Fire Hazard. Also, Even with the Protection circuit, the LiPo does get stressed enough to reduce it's lifespan. So while re-creating this project, do it at your own risk
The Final Device


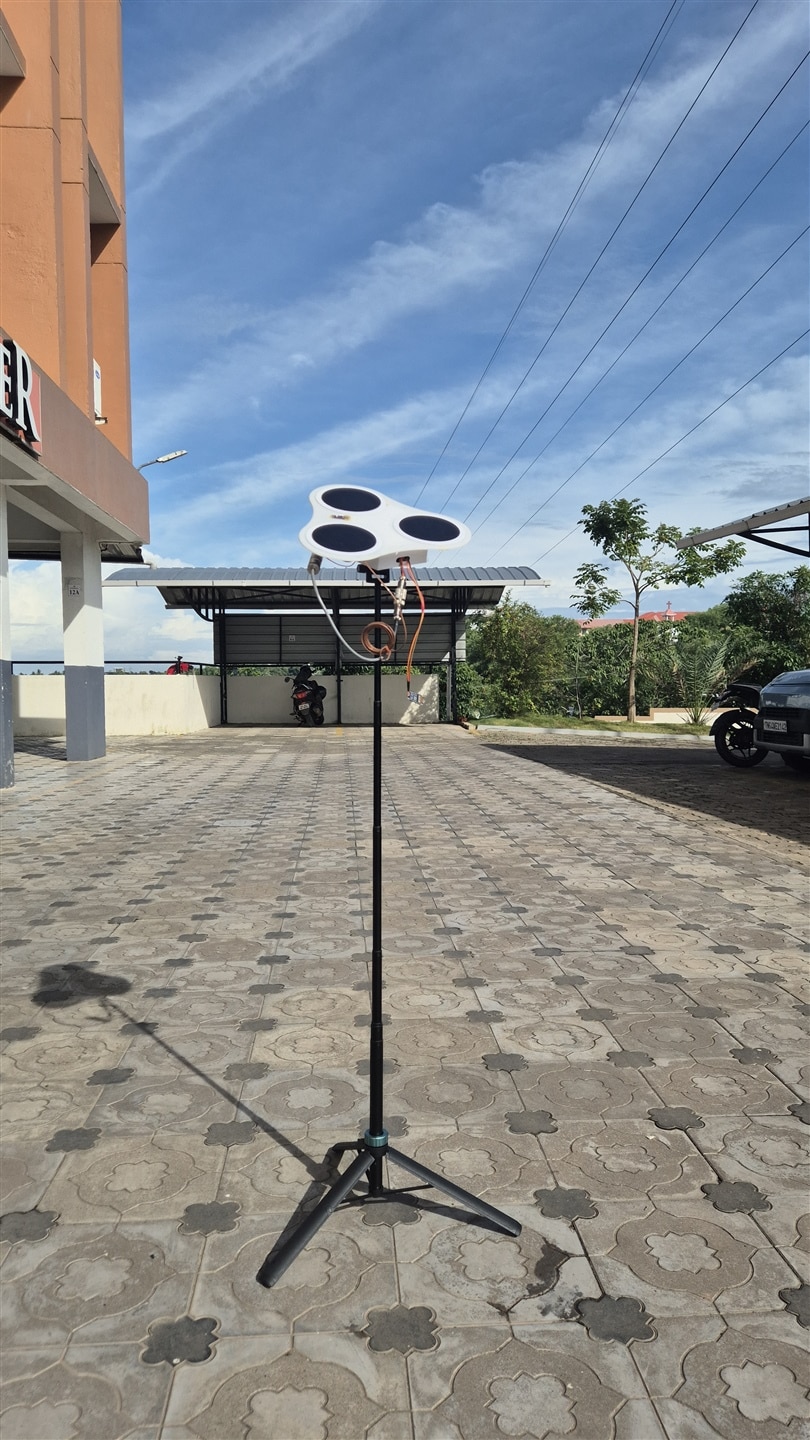
I have fixed the device on the camera tripod using M5 nuts. The enclosure that I currently use has some problems that need to be sorted out. I will be designing a separate enclosure for the CAN shield too. However, before making any changes, it is important for me to make sure that the sensors are made waterproof.
Final Notes
I managed to Frankenstein all the sensors within the timeline and managed to get one day of data. I’m hoping I can find a good sunny day to do a bit more data gathering for better results. I really enjoyed doing this project since it fits perfectly in my area of expertise - working with STM32 HAL libraries, aligning with my field of research, and collecting data which may end up getting published in a journal article. I want to thank the element14 community team as well as their corporate sponsors who have helped in making this build possible.
Update Posted on 22 June 5:30AM (UK Time)
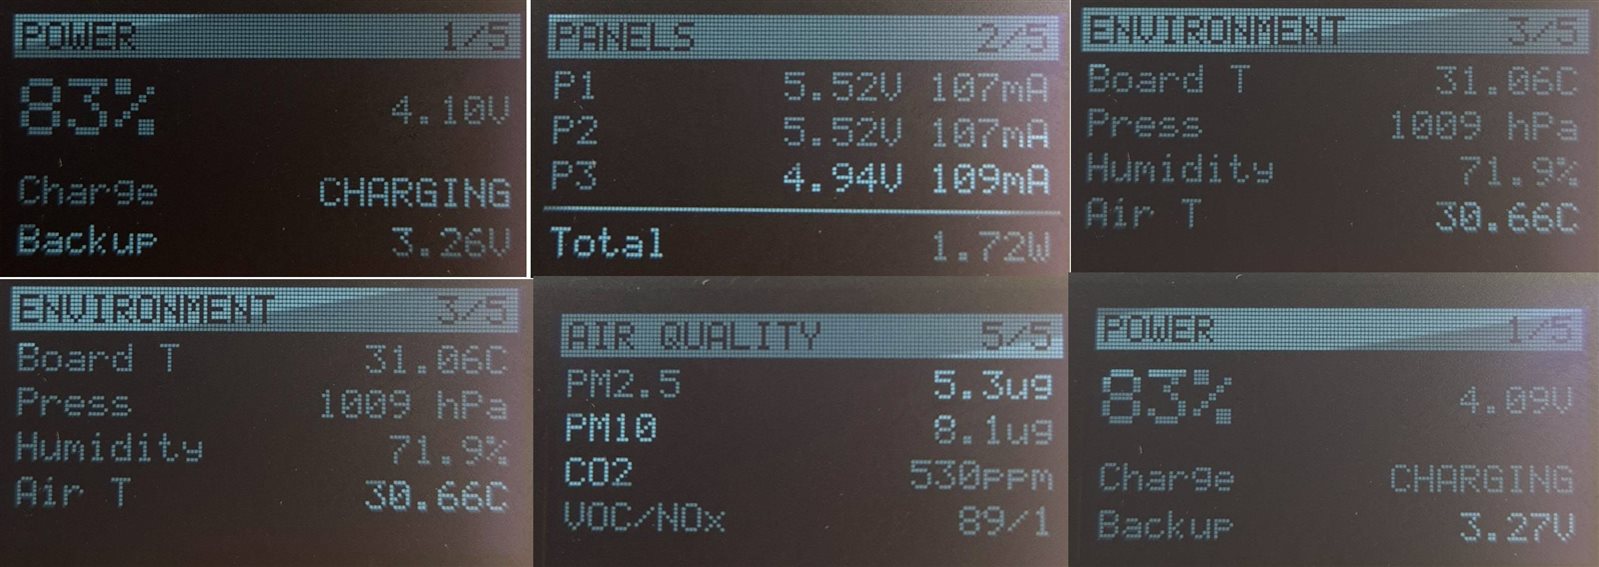
Some photos and Video taken on a Sunny day. In the Morning 9am, i am able to receive 1.72W of power from the panels. Even with one panel fully out, i get more than 1W which is more than sufficient to charge the 1500mAH battery during sun time and make it run though the night till next day, even with basic power saving mode (Turn off SEN66 Fan, turn off 12V boost until next measurement is due, turn off OLED etc). The SEN66 draws around 100mA when turning on the fan but settles at 45mA, this is the largest power consumer in the device. With the SEN66 running 30 s every 5 minutes (10% duty cycle), its average current becomes ~5 mA, bringing the total system draw to ~27 mA including the 22 mA base load (again no CPU sleep and sleep given to other sensors). This results in a battery life of roughly 44 hours (~1.8 days) in ideal conditions at 80% efficiency of battery.
If you are keen eyed, you can see You can see how fast the Panel Temperature (I am showing it as Board T on OLED) rose from 30.4deg C with Air temp 30.5T to panel temperature of 31.6 deg within seconds of being exposed to sunlight, but with marginal air temperature rise to 30.66deg. Sadly the termocouple dislodged from the panel shortly after