While it is acknowledged that instrument performance is perhaps not the primary focus for a cost-sensitive bench targeted at undergraduate-level laboratories, because of changes to the RoadTest plan, I felt that it would be worth running some tests just in case they do uncover something interesting.
I should preface this by saying that I am not an accredited test laboratory – I don’t have stacks of gear with up-to-date calibration certificates and perfect environmental control. I am testing the equipment in order to determine how it performs relative to the datasheet specifications and to see whether those specifications are plausible. Do not rely on these results as absolutely free of error – every unit is different and the comparison equipment may be out-of-calibration (but believed to be accurate based on cross-checking). But these exercises do give us an opportunity to assess how my units fare and to stress them in an automated way through pyvisa scripting. Owing to the constraints of time and equipment, it is not possible to test every single specification, however, I have covered those which I feel are significant and interesting.
Since there are many tests, I have decided to put them all into subheadings for easy access:
Table of Contents
EDU34450A Digital Multimeter
Voltage Measurement Accuracy
The EDU34450A has a very low price and it seems that its basic accuracy specifications does lag behind that of many 5.5-digit DMMs, ranging from 0.015% to 0.027% when traditionally, it would be expected to be closer to 0.012% (e.g. of the Keithley 2110 I previously reviewed). Testing this should reveal how my unit compares to these rather relaxed specifications.
In order to test this, I enlisted the help of my Keithley 2450 SMU which I previously reviewed that has the highest accuracy of all my instruments (0.012% to 0.015% basic accuracy) and only recently just lapsed its calibration by around half a year. I used it to generate voltages, read-back its output and compare that with the measurement taken from the EDU34450A in auto-ranging mode. To simplify the analysis, I have ignored the KE2450 readback error contribution in the following graphs even though it is of a similar magnitude.
The plot indicates the measured error and the EDU34450A’s error limits. The curve remains wholly within these error limits indicating high confidence that the two instruments agree. A closer inspection shows a noticeable jump at the EDU34450A’s range change point, suggesting the DMM may not be so well calibrated at the “edges”. However, also considering that the KE2450’s readback error may be of a similar magnitude, this result shows both instruments agree.
A similar behaviour is seen at each of the EDU34450A’s range change points, however, the error seems to remain wholly within the error limits. Therefore, it should be concluded that the two instruments agree with a high level of confidence, but also that it is not possible to draw conclusions beyond that as to the absolute level of accuracy.
Results for the Keithley SMU’s 200V range are not presented as the data was noisy and appeared to imply the SMU was oscillating or producing an unstable output. As higher voltages are unlikely to be present on most university lab benches (due to safety concerns) and due to time constraints, I did not opt to re-run this test.
Current Measurement Accuracy
Similarly, the DMM has a basic current accuracy of either 0.1% or 0.3%, which is higher than the 0.05% to 0.25% that is normally expected. Testing this should reveal how my unit compares to these rather relaxed specifications.
In order to test this, I performed a similar experiment, sourcing/sinking current, reading back its output and comparing that with the measurement taken from the EDU34450A in auto-ranging mode. To simplify the analysis, I have ignored the KE2450 readback error contribution in the following graphs, but its basic accuracy is around 0.02%-0.03% which is significantly better than the EDU34450A and can often be disregarded.
The current error permitted in the EDU34450A is quite high compared to the actual measured current error, thus it is very likely that the current measurement accuracy of the EDU34450A is significantly better than stated.
The exact same trend is seen even out to a current of 1A, where heating of the SMU and the EDU34450A’s shunt resistance is likely to contribute additional errors. Regardless, the measured values fall well inside the permissible limits for error, suggesting superior current measurement accuracy than that stated on the datasheet.
EDU36311A Triple-Output Power Supply
Voltage Programming & Readback Accuracy
If you have a power supply that has accurate metering, there is no need to arrange external metering. In order to determine the accuracy of the metering on the EDU36311A, I tested it against the EDU34450A which was verified above, by asking the EDU36311A to source all voltages at 1mV increments. Discrepancies in metering between the two instruments were recorded.
For Channel 1 which ranges from 0-6V, the programming and readback error remained within 1-2mV which is far below the specification limits.
For Channels 2 and 3 which range from 0-30V, the programming and readback error remained within 9mV which, again, is far below specification limits. Some perturbation is visible where the EDU34450A changes range, which suggests that the DMM’s accuracy around the range-change point is a little bit dubious.
In all, the voltage programming and readback accuracy of the EDU36311A far exceeds the level implied by the datasheet, which is excellent news for users.
Current Programming & Readback Accuracy
A similar experiment was undertaken for current, however, the maximum test current was limited by the EDU34450A’s 3A limit.
Channel 1’s results show a low current error initially, increasing at higher currents, however this may not be a true reflection of the performance as it may instead be indicative of measurement shunt heating within the EDU34450A, as its measurement error is not considered in this plot. Despite this, the values are still comfortably within the specification limits.
With Channel 2 and 3’s reduced 1A maximum current, the effects of (presumably) measurement shunt heating are reduced and the EDU36311A’s superior current sourcing and measurement are again witnessed.
These results suggest the power supply has excellent current programming and readback accuracy which is beyond that which is implied by the datasheet. Perhaps the datasheet was being conservative to avoid cannibalising sales of higher-end units, or perhaps somehow I’ve got a particularly good unit.
Channel Power Up and Down
Testing the channel output rise and fall times provides some insight into the programming speed of the power supply. In this case, tests were performed with the outputs unloaded which would reflect best-case for switching on and worst-case for switching off channels. In all cases, channels were configured to output 1V and measurements were made with the Rohde & Schwarz RTM3004 Oscilloscope that I previously reviewed.


Testing Channel 1 resulted in a rise time of 4.94ms and a fall time of 21.4ms which is fairly speedy considering this is a general-purpose power supply.


Channel 2 has a lower current rating, so it was not surprising to see that it had a slower rise time of 7.77ms and a fall time of 45.79ms. This is still pretty good for a general-purpose power supply and suggests there is no oversizing of output capacitors to compensate for lax regulation.
Unexpected Shutdown
Testing unexpected power-down behaviour is important, as in an emergency, users are likely to either yank the power cord from the socket or push the hardware power button that cuts power to the power supply. A loss of regulation under this condition could result in an unexpected transient that could damage a connected load.

Without any load connected, I configured Channel 1 to output 1V and then shut down the power supply unexpectedly. No upward transient was recorded (the short spike is likely due to probe microphonics) and the output fell monotonically, first nearly linearly, then more steeply mirroring the discharging of an output capacitor.

Repeating the test with Channel 2 provided this result which was a nearly-perfect 110ms hold-up at no-load, followed by an exponential decay. This implies that unexpected shutdowns should not cause any damage to connected devices.
Overshoot into CC
Powering up a channel into a load which you expect to be regulated in constant current mode is a good test of the regulation performance of a power supply and gives an idea of the likelihood that the supply may inadvertently cause damage to current-sensitive components with poorly chosen voltages.
For this test, I chose to use a non-inductive 1-ohm resistor with a current setpoint of 0.5A which we would expect to operate around 0.5V. The voltage is set to the maximum for the range to provoke overshoot behaviour, if present.
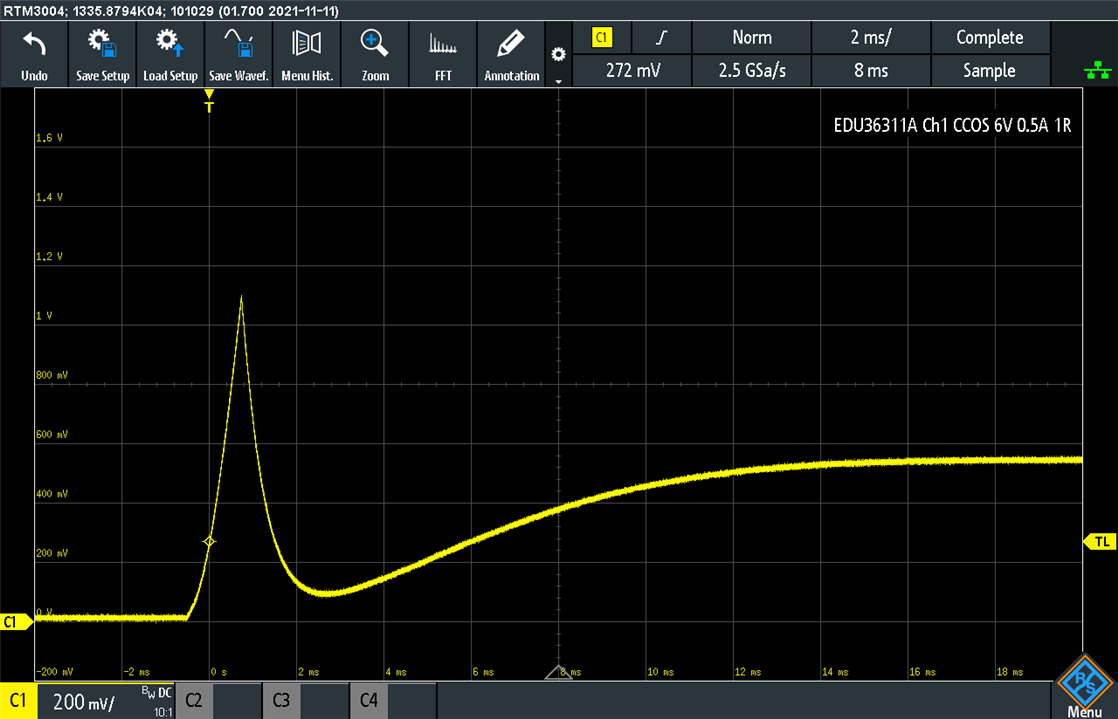
Testing Channel 1, it seems that overshoot is present, reaching a peak of 1.1A and having a transient above 0.5V of about 1.2ms. It seems the regulation loop is a little “behind” at the power up, but it falls into regulation by about 16ms after channel activation. This is not ideal behaviour, but there are much worse examples for power supplies in this class, so I’d have to give it a pass.

The other two channels seem to be much better tuned, smoothly coming up to the load without any overshoot. I suppose with a more limited current range, it can be a bit more conservative with rise time which allows enough time for the regulation loop to smoothly adjust the output. This is what I would expect from a good power supply – so if students are doing experiments with LEDs, perhaps using Channel 2 or Channel 3 is advisable.
Transient Response
Testing how well the power supply handles a change of load, I used my B&K Precision Model 8600 DC Electronic Load (which I previously reviewed) to generate repetitive 10/90% load sequences at 100Hz with the voltage of the output set to mid-range. The output voltage and current monitor output was monitored on the Rohde & Schwarz RTM3004 Oscilloscope with 20MHz bandwidth limiter engaged.


For Channel 1, on an upward load transition from 0.5A to 4.5A with a rise time of 15.3µs, the output deviated by 524mV on average (peak-to-peak). From the oscilloscope plot, it seems that the excursion was nearly fully recovered by 35µs.
In the downward direction with a fall time of 13.1µs, the output deviated by 508mV on average (peak-to-peak) which is a similar result. In this case, the voltage fully recovered by about 50µs. This performance is consistent with the datasheet and is excellent for a cost-sensitive general-purpose power supply – many switching supplies are not this fast and we’re getting close to SMU-territory.


For Channel 2, performing a similar transition from 0.1A to 0.9A with a rise time of 13.7µs, the output deviated by an average of 126.7mV peak-to-peak. Settling time seems to be mostly complete by 50µs with slower settling out to 150µs.
In the downward direction, the fall time averaged 11.2µs and the deviation averaged 197.5mV peak-to-peak. In this case, settling time was about 30µs with additional ringing bringing the output to stability by about 80µs. Given the “settling band” consideration of the datasheet specification, these findings are consistent with the specification and show excellent transient response behaviour.
OCP Response
Overcurrent protection (OCP) is a feature of most serious power supplies which allows for tripping off an output if it becomes current limited for longer than a certain time. Testing was done by using the B&K Precision Model 8600 DC Electronic Load to sink greater current than the CC setting on the power supply.

Testing with Channel 1 set to the default 20ms trip time shows that initial power-up has a 1.2ms of current overshoot (as previously discovered), followed by about 21ms of regulated operation and then slow decay as the channel is tripped off. This performance is within expectations and demonstrates functional OCP.

To ensure OCP does not trip when it is not expected to trip, I generated a 100Hz transient waveform that resulted in the supply popping into and out of CC mode repeatedly. In this case, no trip was experienced which is the correct behaviour. However, I did note that adjusting the OCP time to short values (below 5ms) appear to result in nuisance trips on enabling the channel.

Testing with Channel 2 and 100Hz transient waveform with 30ms OCP time seemed to result in a trip as the output was folding back after hitting CC but did not fully recover. As a result, it seems the frequency and duty cycle of the load profile may have an effect on the effectiveness of the OCP. In this case, it probably should not have tripped in an ideal world, but instead, it did after four or so load transient cycles. However, perhaps an OCP that is a little more conservative is more valuable than one that is too lax, but it should be noted that it doesn’t have the sophistication of customisable delay times for initial switch-on inrush that you may find in more advanced power supplies.
Ripple and Noise
Ripple and noise was measured with a constant-current load of the maximum rating for the channel, at half the rated channel voltage, generated from the B&K Precision Model 8600 DC Electronic Load. Measurements were made using a passive 10:1 probe on the Rohde & Schwarz RTM3004 Oscilloscope with 20MHz bandwidth limit engaged.
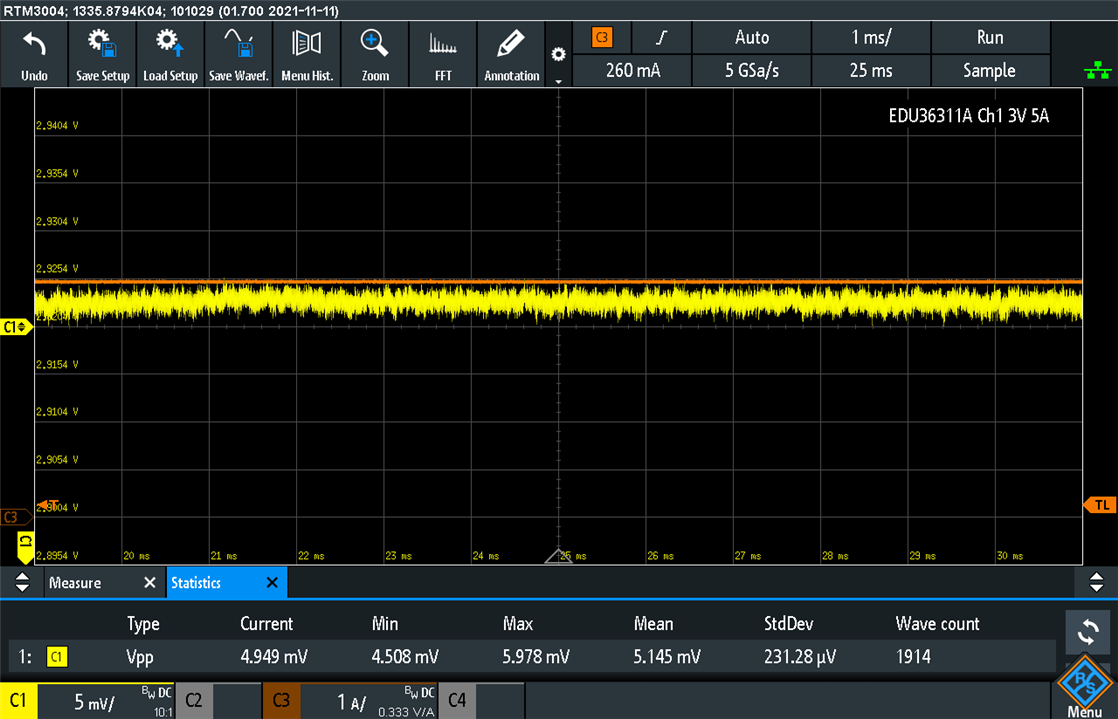
The ripple and noise figure measured for Channel 1 an average of 5.145mV peak-to-peak which is good and is fairly close to the noise floor of the channel input. This is practically spot-on with the 5mV peak-to-peak rating in the datasheet.

Repeating the same for Channel 2 resulted in an average of 5.831mV peak-to-peak, which is again a good result and fairly close to the noise floor of the equipment. It is very much within the same ballpark as the 5mV peak-to-peak claim in the datasheet – the discrepancy may be due to the frequency range of the datasheet measurement (20Hz – 20MHz) as this includes the DC “drift” element as well (0Hz – 20MHz).
Channel Leakage Current
Channel leakage current was tested by performing an I-V curve sweep using a Keithley 2450 SMU and KickStart 2 software with the EDU36311A in both the powered-up and powered-down condition. As the power supply does not have a relay isolated stage, it was my expectation to see significant leakage into the channels even when they are supposedly powered off.
The results show lower level of leakage when the power supply is powered off, with Channel 1 reaching about 22mA at 6V and Channel 2/3 reaching 24mA at 30V (the full rated voltage). When the power supply is turned on, with the outputs turned off, the leakage reached 250mA on Channel 1 at 6V and around 148mA on Channel 2/3 at 21V (due to SMU limits). The behaviour shows a noticeable “kink” in the curves for Channel 2/3 which suggests there is some active limiting occurring.
This suggests to me that the power supply does have an active down-programmer circuit of some sort and it seems to have a sinking limit. No damage occurred as a result of the test, thus it is safe to connect batteries or other (reasonable) power sources to the channel outputs, however they will consume a noticeable amount of current from the power source despite being switched off.
EDU33212A Arbitrary Waveform Generator
Time-Domain Parameters
An easy test of a waveform generator is simply to hook it up to an oscilloscope and look at the quality of its output. I tested a few things with the Rohde & Schwarz RTM3004 Oscilloscope before moving onto more stringent tests.
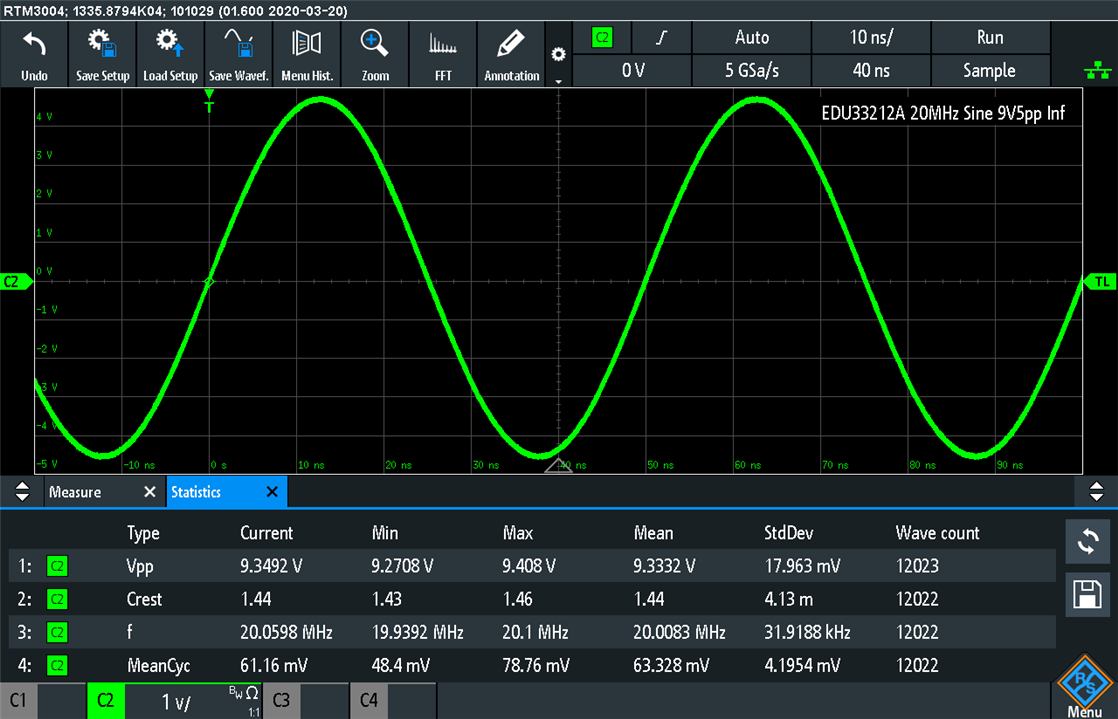
Asking the EDU33212A to generate a 20MHz (maximum) sine wave with an amplitude of 9.5V peak-to-peak (near the maximum of 10V) into a 50-ohm termination of the oscilloscope is just about the worst-case scenario. Regardless, the output seemed nice and stable and the measured parameters are within range, especially considering both the EDU33212A and RTM3004’s accuracy specifications.
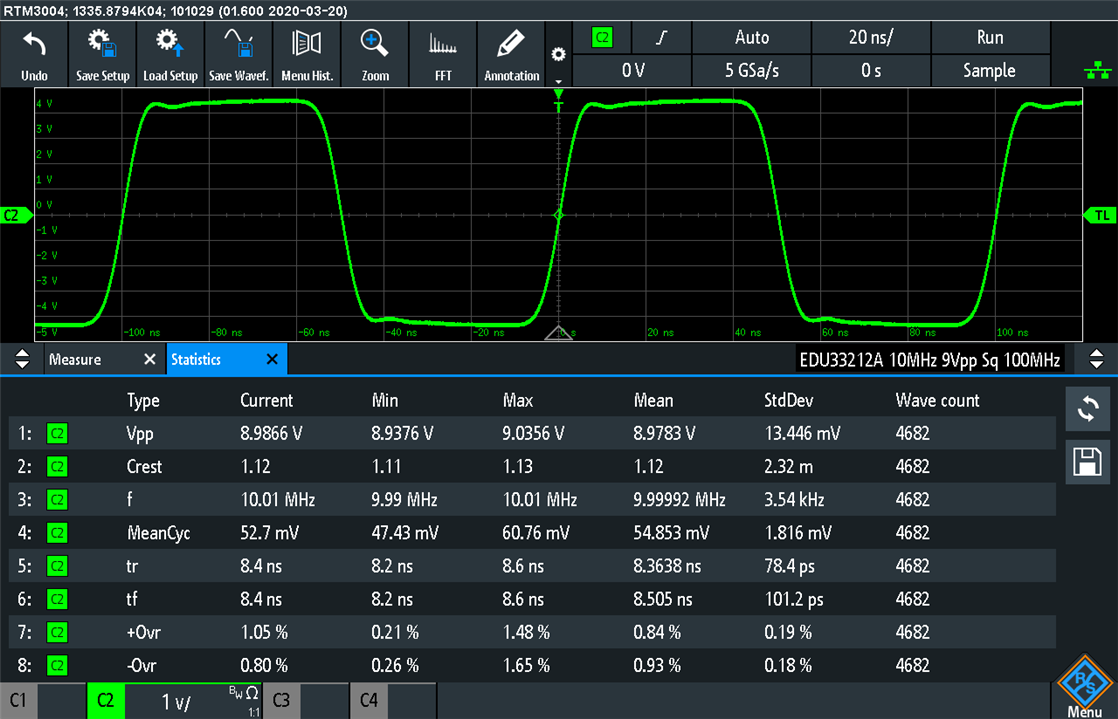
A more challenging test is to generate a square wave. The EDU33212A limits this to 10MHz, but the resulting waveform is still pleasingly near-square without significant ringing at the transitions. I think this is a pretty good result overall.

I also tested the synchronisation between channels – the RTM3004 said they were within about 1.09° or 303.8ps, well within the <800ps specification.
1kHz Sine Wave Amplitude Error
For automated testing, I decided to generate a 1kHz AC sine wave using the EDU33212A and measure this using the AC Volts capability of the EDU34450A DMM.
The measured results show both output channels had errors well within the specification limit even when neglecting the contribution of the EDU34450A DMM’s measurement error. The maximum error reached -100mV RMS at 10V peak-to-peak output. This suggests to me that Keysight has, again, been very conservative with its specifications for amplitude error (or my unit is exceptional).
DC Offset Error
Automated testing continued with testing the accuracy of generated DC offset voltage using the EDU34450A DMM.
The results were again, very much within the specification limits suggesting the specifications are very conservative. The maximum offset was about 40mV at an offset of -10V.
Output Amplitude Flatness
Due to the large dynamic range expected for the remaining tests, an oscilloscope would not be sufficient. As a result, I switched over to the Tektronix RSA306 USB Real-Time Spectrum Analyser (which I’ve also previously reviewed) for the remainder of the experiments to get a better view into the frequency domain.
To test the output amplitude flatness, I set the output of the AWG to sweep across the full range while the RSA306 kept a peak-hold. I set the RBW at 1kHz to maintain a high level of resolution.

The result within the 0-20MHz band shows a small bump in the low frequency which is something I’ve seen before and suspect is an RSA306 artifact, but overall, the values are well within 0.2dB across the range excluding the hump and that is within the specifications.

There are out-of-band noise emissions which seems to be about 50-60dB down compared to the signal. This seems reasonable and at a level which is expected.
Harmonic/Noise Emissions
To test harmonic and non-harmonic noise emissions, I first tested the background noise with the AWG powered down.

The spectra reads about -99dBm across the range and is relatively flat.

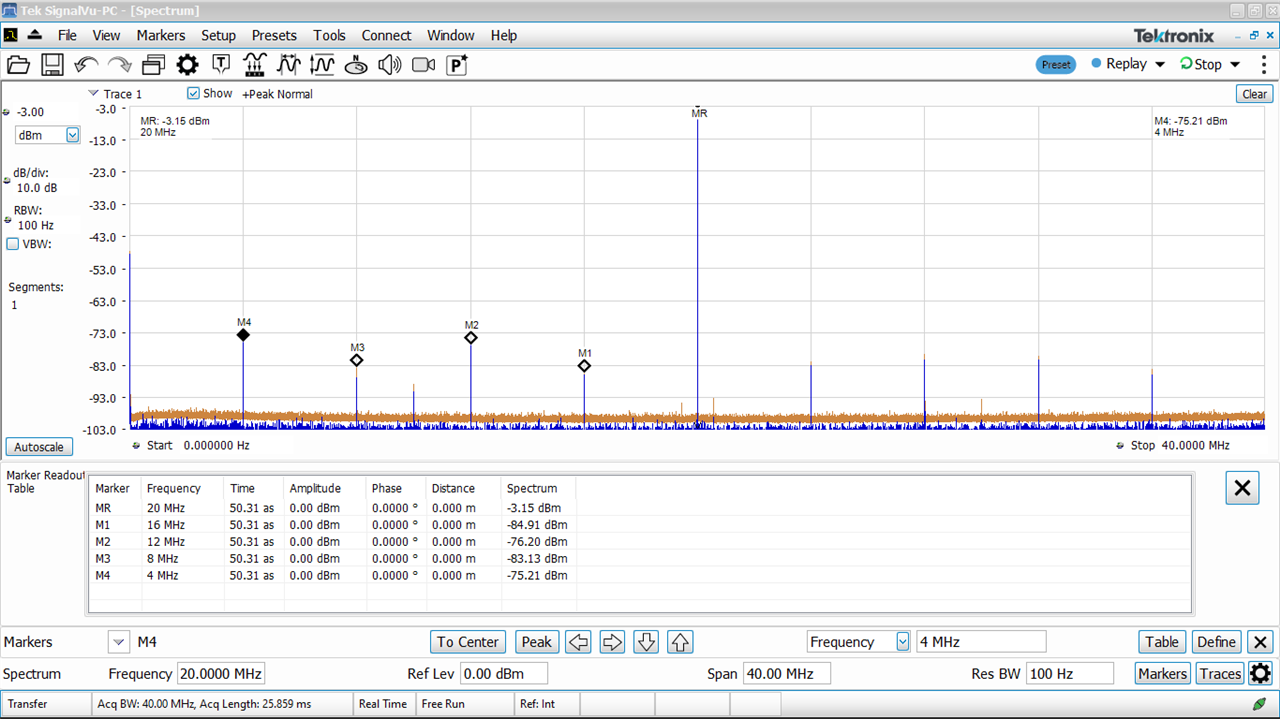
Generating a sine wave at 20MHz, the (sub-)harmonic components were measured at 4MHz intervals, peaking about -72dBc which is very good and slightly better than the specifications would imply.

Non-harmonic components were identified and were at an even lower level of about -85dBc which is excellent.
Intermodulation Test
I tested intermodulation by having a 10MHz sine wave and a 7.5MHz sine wave generated by the two channels using the combine mode.
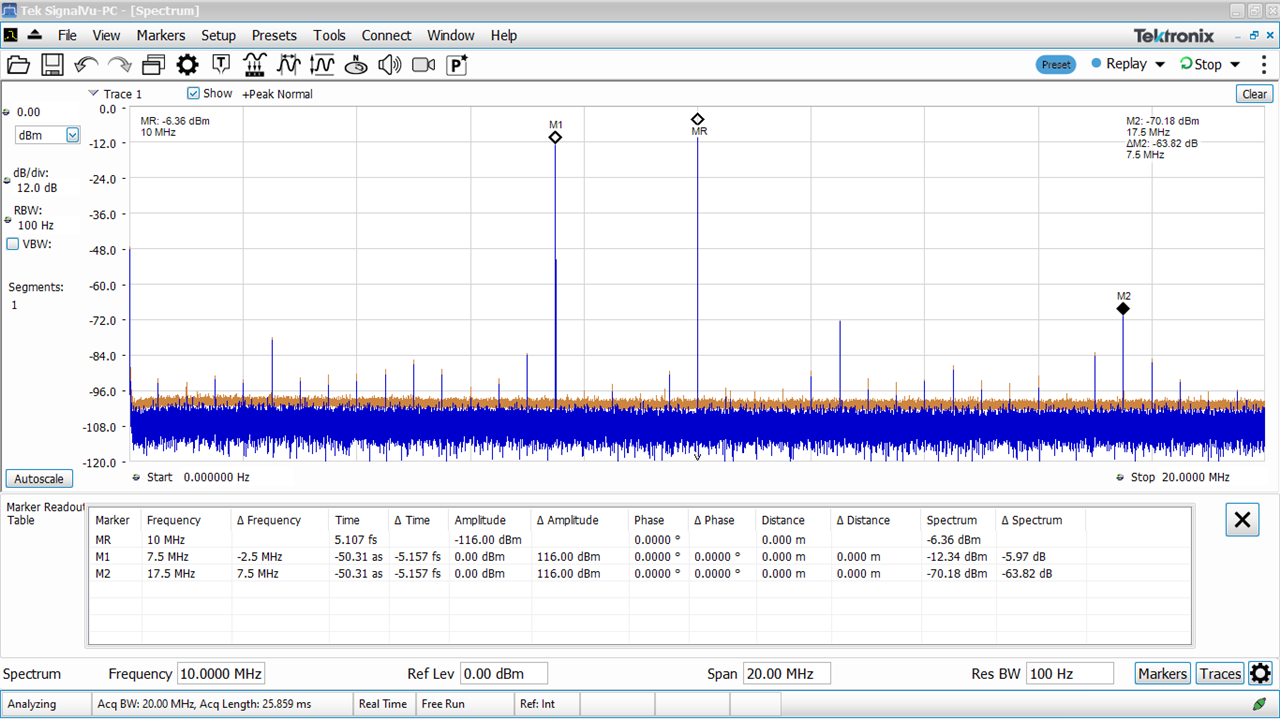
The output looked as above, with the highest spurious measurement at 17.5MHz measuring about -64dBc. This is not as impressive, but given the equipment I am measuring with, still suggests good performance overall from the AWG.
Crosstalk Test
Crosstalk represents signal “leakage” from one output to another. In this case, I set a 10MHz sine wave on 24dBm output on Channel 1 with Channel 2 switched off.

The peak signal measured on the second channel was -100dBm, implying the cross-talk level was an impressive -124dB under this measurement setting. I suspect a change in loading or frequency may change the measured cross-talk figure.
EDUX1052G Digital Storage Oscilloscope
Input Noise Floor
Input noise floor was measured with the inputs disconnected and the inputs set to the most sensitive vertical scale with the horizontal scale backed out to the longest timebase that would maintain the full 1GSa/s sample rate. The input probe type was set to 1:1 and measurements with statistics were used to determine the noise floor. The bandwidth limit function is not switchable on the EDUX1052G.
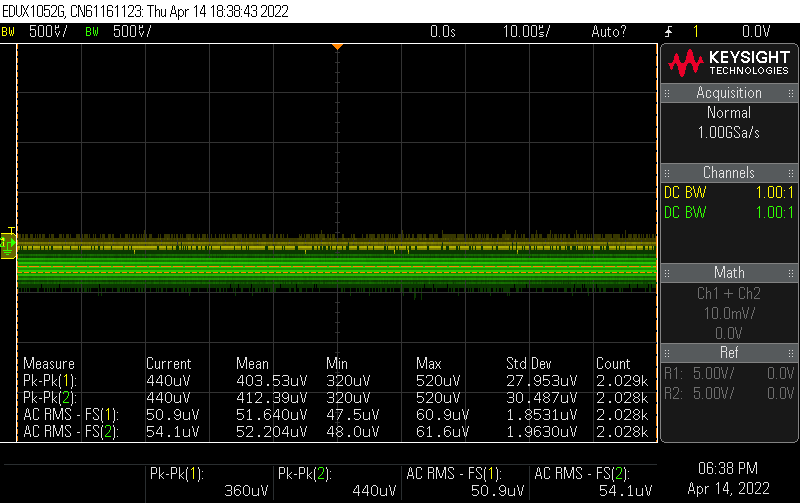
The input noise level averaged 403.53µV peak-to-peak and 412.39µV peak-to-peak across Channel 1 and Channel 2 respectively, corresponding to 51.640µV RMS and 52.204µV RMS respectively. This value would be 10x higher in the case of using probes in the 10:1 configuration, thus putting the noise floor in the 4mV peak-to-peak region. For an oscilloscope of this class, it is a good result.
Standby/Idle Power Consumption
The power consumption of the Smart Bench Essentials kit may be of interest, as more efficient instruments will lower power costs in both direct consumption and potentially air-conditioning in warmer climates.
In order to measure this, I used my Tektronix PA1000 Power Analyser with a pure-sine-wave inverter source trimmed through a variac to meet the tight voltage requirements for testing to IEC 62301 Standby Power standard.
I am happy to report, owing to the use of hardware power switching on almost all models, standby power consumption for all instruments except the power supply was measured as practically zero (<1mW, instrument error level). The exception was the power supply which measured 100mW which is an excellent result.
Therefore, with the power switched off on the instrument, standby power consumption is very much negligible for the complete set of instruments.
I re-ran the test with the instruments idling, as I can foresee the use of instruments at a lab bench where they are left on during the day. The results are as follows –
- DSO – 26.1W
- DMM – 5.7W
- FG – 16.5W
- PSU – 15.5W
- Total – 63.8W
The instrument-idle power consumption is not as friendly with the full bench consuming just shy of 64W at idle, but is still reasonably in-line with expectations.
SCPIBenchv1 Test Results
In order to gauge remote control performance, I wrote a small benchmark which I call SCPIbenchv1 which measures the average time to execute certain SCPI instructions. As not all instruments support all commands, some of these graphs will have no result recorded.
These commands involve some instrument action, including setting values or returning values. In general, it seems that USB connectivity usually provides the best results for speed, with VXI-11 Ethernet usually performing second-best and Ethernet SOCKET connectivity lagging behind. The results may be somewhat difficult to interpret, however, as some of these commands (READ? with the DMM and *RST) may involve physical operations which consume time and mask the difference in latency.
These commands usually expose the instrument’s raw speed as these cause the instrument to respond with values and require no actions to be undertaken. In this case, it seems that USB is still ahead mostly, but VXI-11 Ethernet is now behind with Ethernet SOCKET connectivity slotting in-between. The DSO seems to buck this trend, showing slightly better performance on HiSLIP and SOCKET Ethernet connectivity compared to USB. The values range from about 2-20ms, which show that the instruments generally are very quick to respond, approaching the speed seen from high-end SMUs for example, compared with older instruments which usually had 30-120ms response times.
However, some operations can take a veritable age to process because they involve an auto-ranging process which may involve relay switching, settling times and additional ADC conversions. Measurement requests for the DMM with the inputs open-circuited show rather long delays of 2-4 seconds which may be long enough to cause timeouts depending on the VISA configuration. Power supply measurements take around 100-200ms which may be due to the time taken to perform an ADC conversion which is more reasonable, but places an upper bound to the number of readings that can be made onto the bus.
Conclusion
Testing the EDU34450A’s voltage measurement accuracy showed that it agreed well with the Keithley 2450 SMU up to 20V indicating that the specifications are likely to be valid. Results from the 200V range showed noise indicative of oscillations, thus the data was not reported and the experiment was not re-run due to a lack of time and the unlikely scenario of encountering high-voltages on university lab benches. Testing the current accuracy revealed that the specification is perhaps a bit on the conservative side, with measured errors falling well-inside the error limits. Given its price, the performance is very acceptable.
Moving the microscope over to the EDU36311A power supply, it was shown to have significantly better voltage and current programming and readback accuracy compared to its datasheet specifications. Either I got a very good unit or they were being conservative with specifications to avoid cannibalising sales of higher-end units, but the performance continued to impress with regards to output rise and fall times of 4.95ms and 21.4ms for Channel 1 and 7.77ms and 45.79ms for Channel 2 respectively. Unexpected power-downs did not result in the output becoming unregulated, and OCP was found to be functioning as expected for the most part, thus devices under test are protected. Transient response performance was tested and found to be consistent with the 50µs claim, putting this cost-sensitive general-purpose power supply near performance/SMU territory. Ripple and noise also measured favourably at 5.145mV and 5.831mV peak-to-peak on Channel 1 and Channel 2 respectively, matching datasheet specifications. The only downsides seems to be a “lagging” regulation loop that allows about 1.2ms of overshoot on Channel 1 and non-relay isolated outputs that have significant leakage current in case they are connected to energy sources (e.g. batteries). In all, this seems to be a superb power supply.
The EDU33212A arbitrary waveform generator also impressed, with tests of the DC offset error, 1kHz AC amplitude error, channel-to-channel skew and cross-talk besting the specifications by a significant margin. Output amplitude flatness across the range of frequencies, harmonic/non-harmonic noise output and intermodulation tests recorded results consistent with the datasheet.
For the EDUX1052G, the input noise level averaged 403.53µV peak-to-peak and 412.39µV peak-to-peak across Channel 1 and Channel 2 respectively, corresponding to 51.640µV RMS and 52.204µV RMS respectively. This is a solid result for an oscilloscope of this class/bandwidth and would mean a noise level of about 4mV peak-to-peak with a 10:1 probe, making basic ripple-and-noise measurements possible.
Standby power-consumption was virtually non-existent with hardware power switching on all instruments, except for the power supply which had a tiny 100mW standby draw. Idle power consumption measured 26.1W for the DSO, 5.7W for the DMM, 16.5W for the AWG and 15.5W for the PSU, totalling 63.8W. This is significant, but is comparable to the draw of other instruments and is not unexpected.
The SCPIBenchv1 results show the instruments all have the potential to be high-performers when it comes to remote control, but the results with VXI-11 and SOCKET connectivity show mixed latencies and USB typically excels with consistently fast responses. The DSO seems especially consistent, regardless of the connectivity, but unlike the others, shows marginally better performance on HiSLIP and SOCKET connectivity. Some operations, especially with the DMM which involve auto-ranging, can result in long delays of 2-4 seconds which may result in VISA timeouts depending on the configuration.
While the performance of such cost-sensitive instruments intended for university benches is not a prime consideration, this exploration of instrument performance seems to turn up favourable results which reinforce the impression that Keysight have delivered solid, serious test equipment for the price. This, indirectly, would translate into better quality measurements, better protection for devices under test, less test-equipment-induced errors, but also perhaps increases the instrument appeal beyond the education market into the hobbyist market.
---
This post is part of the Keysight Smart Bench Essentials RoadTest Review.
Direct links to detailed blogs:
- Keysight SBE In-Depth – Ch1: The Need for Smarter Benches?
- Keysight SBE In-Depth – Ch2: Unboxing^4 & Design Features
- Keysight SBE In-Depth – Ch3: Initial Setup & Documentation
- Keysight SBE In-Depth – Ch4: On-the-Bench User Experience
- Keysight SBE In-Depth – Ch5: Connected to the LAN
- Keysight SBE In-Depth – Ch6: PathWave BenchVue Oscilloscope, Power Supply, Digital Multimeter & Function Generator
- Keysight SBE In-Depth – Ch7: Keysight BenchVue Test Flow Automation
- Keysight SBE In-Depth – Ch8: Instrument Performance Tests
- Keysight SBE In-Depth – Ch9: Peeking Under the Covers

