In the previous blog, I was able to get a particulate monitor that requires 5V to operate just fine from a battery and in a way which is rather efficient enough that solar power was not an immediate requirement. Nevertheless, to transition the system to the great outdoors requires making it self-sufficient and this means testing out the solar input.
Table of Contents
Giving it Life
The first part of giving the system life is to supply it with a source of power. Not having the means to procure solar panels at the drop of a hat, I was relegated to the panels I had in stock. I found this rather cute little panel that was left over from my PhD days and has been part of a bank of cells which trickle-charge some old sealed lead-acid cells.
The area of the cell is about three-quarters that of an A4 sheet of paper, so this is a pretty dinky little thing. In fact, it is perhaps a little underpowered for my liking, knowing that the TP4056 may well be able to charge at 1A, thus requiring about 5W input. Add to this, the boost converter’s inefficiency and the non-matched operating power point, and given a discharged battery you may well need about 7.5W to maximise the charging process.
This cell, from Sundaya, is only capable of about 3.6W peak and also has a rather frighteningly high open-circuit voltage of 21.3V which is starting to get close to the 28V maximum of the boost module. The less-than-ideal peak power rating will mean that the switching converter will operate in a “hiccup” mode, essentially over-loading the input and causing it to collapse, stopping to give the input capacitor a bit of time to recharge until the voltage recovers, then running and causing this cycle to repeat itself. While not ideal in the sense that the TP4056 is constantly being reset, this should still allow the batteries to receive some charge.
The module has a long length of waterproof flexible cable terminating in a special 2.1mm DC plug that is intended to lock and be weatherproof with a specific mating connector. Not having one of those, I used a general 2.1mm DC socket, a bit of heatshrink and wire to get this connected to the breadboard. Et voila – solar input has been established.
You Want to Leave a Breadboard … OUTSIDE?
The next step is to subject the system to a realistic situation which mimics the hive environment. While breadboards are famously finnicky and flimsy and will never be the final construction method, along with the fact that these are but merely prototypes, it is still important to validate its capabilities in situ. For this, I went scrounging around the house for ways to make my breadboard systems resilient to the weather, whilst allowing enough of the weather to get in so as to be measured.
Cue the inner contraption. Two breadboards rest on an upturned food-saver tub. The downwards facing tub provides a lip by which it restricts splashes from travelling upward and directly impacting on the breadboards and may stop larger vermin from exploring the devices. This tub is then placed on top of two up-turned yoghurt tubs to provide elevation over the ground, isolating the measurements slightly from the influence of the ground and allowing rainwater to run freely.
Some smaller insects are repelled by the use of spare fly-screen mesh, folded haphazardly over the devices and secured in place with magnets. Spaces in the screen allow for the solar cable to enter. The breadboards are unmodified, with the Omron-based sensors still running from batteries alone while the Sensirion-based particulate monitor is running from batteries and solar.
To complete the hive-simulation, I used an upturned Sistema plastic tub over the top. However, such a tub cannot simply be put over the devices – I have used a set of tiles to elevate it over the concrete slightly to allow airflow underneath the box, then a second set of tiles on the side to weigh down the tub without impeding the top, allowing the light sensor to operate without the risk of the tub flying away in the wind.
Nearby, the solar panel is angled to catch the morning sun and is screwed down to a retaining wall for support.
A positive sign is the charging LED on the TP4056 module visibly lighting up with the exposure to the relatively overcast day. In fact, I had to find a break in the rain to put the system out …
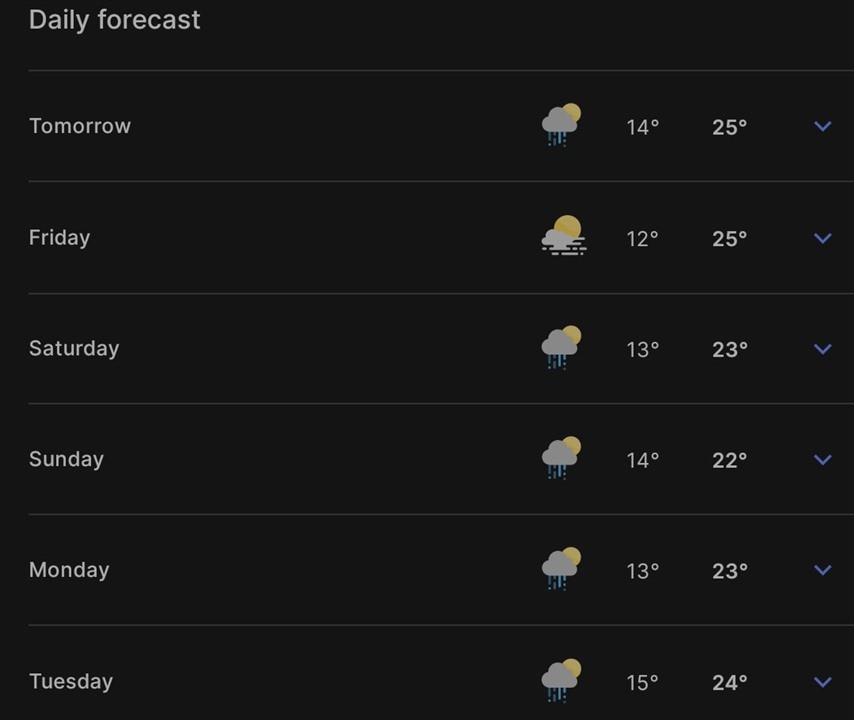
… as Sydney has been experiencing consecutive days of rainy weather. Eugh.
I went out several days later and the rain was still pelting down, but the system was still operating and had not blown away. Great success!
Logging Some Data & Processing It
What good is collecting sensor data through LoRaWAN and The Things Network when it’s not being recorded? In some good news, during prior portions, I was already working on this problem.
The first is to activate the MQTT integration and generate an API key to allow an MQTT client to access the data. This is rather simply achieved in the Application -> Integrations -> MQTT menu.
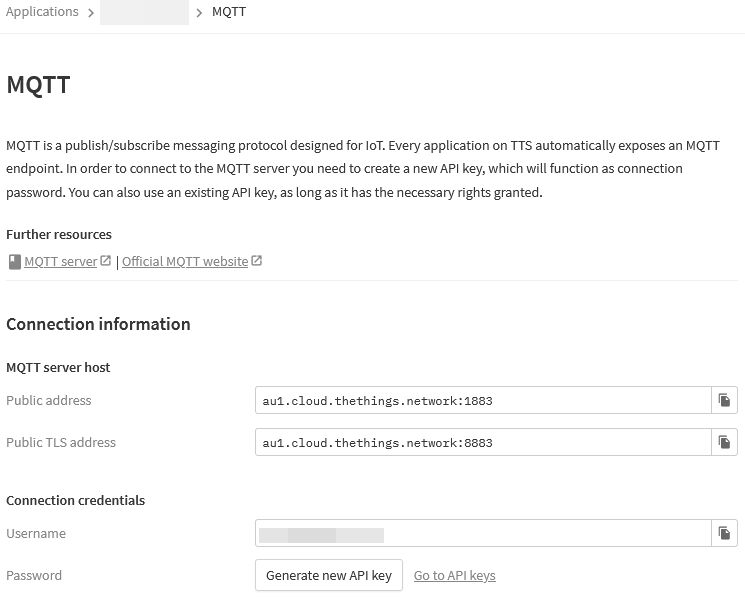
From there, I repurposed some old Python MQTT code that relies on the paho-mqtt library to connect to the MQTT server and dump all the recorded responses into a text log file.
# Quick and Dirty MQTT Logger V1.0
# by Gough Lui for Save the Bees - April 2023

import paho.mqtt.client as mqtt
import time
import string
import ssl

def on_message(client, userdata, message):
  print(str(time.time())+","+str(message.payload.decode("utf-8")))
  f.write(str(message.payload.decode("utf-8"))+"\r\n")
  f.flush()

servername = "MQTT_SERVER_NAME"
serverport = 8883
mqttusername = "APP_NAME@TENANT_ID"
mqttpassword = "API_KEY_PASSWORD"

f = open("logfile.csv",'a')

print("Connecting ...")
client = mqtt.Client("loggerbee1") #create new instance
client.username_pw_set(mqttusername,mqttpassword)
if serverport != 1883 :
  client.tls_set(ca_certs=None,certfile=None,cert_reqs=ssl.CERT_REQUIRED,tls_version=ssl.PROTOCOL_TLSv1_2)
  client.tls_insecure_set(True)
client.connect(servername,serverport,60)
client.subscribe("#")
client.on_message=on_message
client.loop_start()

while True :
  time.sleep(1)
This is a great way to collect data assuming you have a system that is always running and is connected to a reliable connection. Unfortunately, being on an LTE link, I didn’t notice that the modem had rebooted one day and the NAT connection got stale, resulting in no MQTT messages being logged. Whatever was not stored at the time is ultimately lost. Perhaps I should refactor the code to automatically re-connect if no message is received after a while or there is a keepalive setting I am missing.
This is where a different type of integration is perhaps useful – this one is known as Storage.
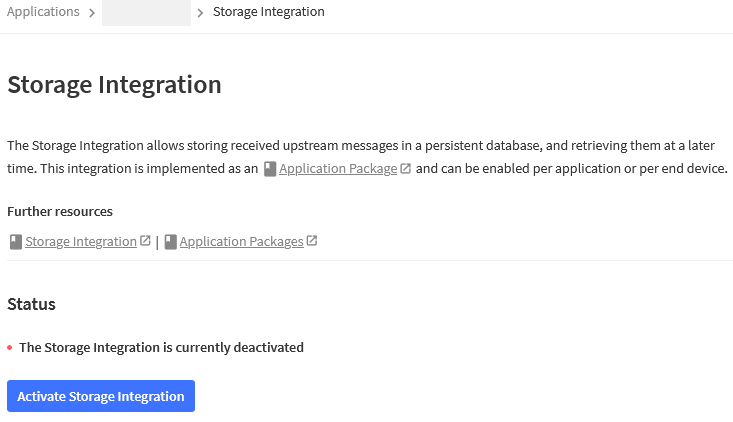
The Storage API is a basic database which stores all the relevant messages for a certain time window (up to 30-days for paid plans) against which you can use an HTTPS-based API to query it. Unfortunately for free plans, the storage API only offers 24-hours of storage which is not that much, but was enough to patch over one hole in my data. All you have to do is enable it!
From there, you can query the API to get the stored messages based on some criteria (or none at all). This can be done using cURL if you don’t have anything more sophisticated – e.g.
curl -G "https://au1.cloud.thethings.network/api/v3/as/applications/YOUR_APPLICATION_NAME/packages/storage/uplink_message" \
    -H "Authorization: Bearer YOUR_API_KEY" \
    -H "Accept: text/event-stream" \
    -d "after=2023-03-30T14:24:00Z"
Now, we are left with a log file with JSON lines in it that look like this:
{"end_device_ids":{"device_id":"eui-[REDACTED]","application_ids":{"application_id":"[REDACTED]"},"dev_eui":"[REDACTED]","join_eui":"[REDACTED]","dev_addr":"[REDACTED]"},"correlation_ids":["as:up:[REDACTED]","gs:conn:[REDACTED]","gs:up:host:[REDACTED]","gs:uplink:[REDACTED]","ns:uplink:[REDACTED]","rpc:/ttn.lorawan.v3.GsNs/HandleUplink:[REDACTED]","rpc:/ttn.lorawan.v3.NsAs/HandleUplink:[REDACTED]"],"received_at":"2023-03-19T10:00:41.430732980Z","uplink_message":{"session_key_id":"[REDACTED]","f_port":2,"f_cnt":11,"frm_payload":"OxZ0DcBpDwAAAA==","decoded_payload":{"humidity":56.91,"lux":0,"pressure":1010.112,"temp":34.44,"time":1679220041},"rx_metadata":[{"gateway_ids":{"gateway_id":"[REDACTED]","eui":"[REDACTED]"},"time":"2023-03-19T10:00:41.197946Z","timestamp":1339124308,"rssi":-53,"channel_rssi":-53,"snr":7.5,"uplink_token":"[REDACTED]","channel_index":2,"received_at":"2023-03-19T10:00:41.188789830Z"}],"settings":{"data_rate":{"lora":{"bandwidth":125000,"spreading_factor":7,"coding_rate":"4/5"}},"frequency":"917200000","timestamp":1339124308,"time":"2023-03-19T10:00:41.197946Z"},"received_at":"2023-03-19T10:00:41.222272441Z","consumed_airtime":"0.061696s","version_ids":{"brand_id":"arduino","model_id":"mkr-wan-1310","hardware_version":"1.0","firmware_version":"1.2.3","band_id":"AU_915_928"},"network_ids":{"net_id":"000013","tenant_id":"ttn","cluster_id":"au1","cluster_address":"au1.cloud.thethings.network"}}}
There’s a lot of interesting data in there, but it’s a nested JSON mess and I’m not particularly good at parsing JSON just yet. Instead, I made my own quick-and-dirty Python parser that reads a line and looks just for the key payload data and some radio metrics too. This extracts it into a CSV I can then more easily analyse.

The parser is not particularly sophisticated, but the code is as follows:
# Quick and dirty JSON log parser V1.1
# by Gough Lui for Save the Bees - Apr 2023

def getval (var,txline) :
  loc = txline.find("\""+str(var)+"\":")
  if loc < 0 :
    return None
  else :
    i = 0
    while txline[loc+len(var)+3+i] != "," and txline[loc+len(var)+3+i] != "}" :
      i=i+1
    return txline[loc+len(var)+3:loc+len(var)+3+i]

print("Gough JSON Log Processor")
fn=input("File to process: ")
fp=open(fn,"r")

print("Opening "+str(fn))
lines = fp.readlines()

fx=open(fn+"processed.csv","a")
fx.write("time,port,humidity,lux,pressure,temp,pm10,pm25,volt,rssi,snr\r\n")

for index, line in enumerate(lines):
  print("Line count: "+str(index)+"\r",end="")
  portindex = getval("f_port",line)
  if portindex != None :
    if portindex == "2" : # Packet Type 2
      humidity = getval("humidity",line)
      lux = getval("lux",line)
      pressure = getval("pressure",line)
      temp = getval("temp",line)
      time = getval("time",line)
      rssi = getval("rssi",line)
      snr = getval("snr",line)
      fx.write(str(time)+",2,"+str(humidity)+","+str(lux)+","+str(pressure)+","+str(temp)+","+",,,"+str(rssi)+","+str(snr)+"\r\n")
    elif portindex == "3" : # Packet Type 3
      pm10 = getval("pm10",line)
      pm25 = getval("pm25",line)
      volt = getval("voltage",line)
      time = getval("time",line)
      rssi = getval("rssi",line)
      snr = getval("snr",line)
      fx.write(str(time)+",3,,,,,"+str(pm10)+","+str(pm25)+","+str(volt)+","+str(rssi)+","+str(snr)+"\r\n")
fp.close()
fx.close()
print("")
print("Done!")
Preliminary Data Results
What was I able to find out? Quite a bit in fact …
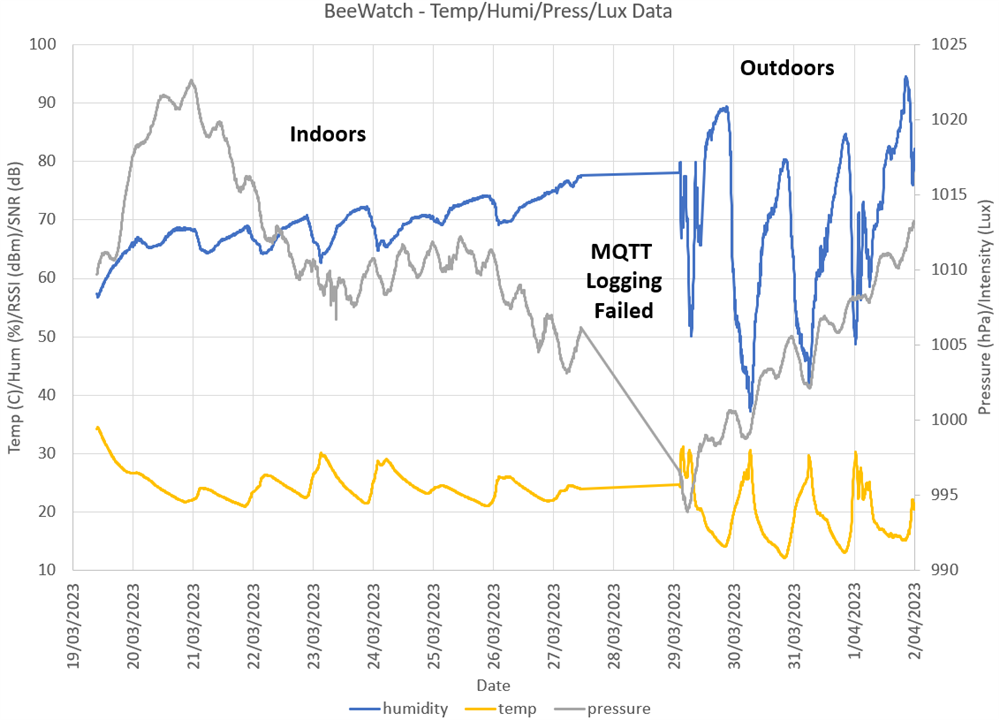
For a start, we can see the Omron board which has been running the longest. About eight of ten days indoors had the data captured correctly, with nearly two days data lost because I didn’t notice the MQTT connection going belly up. In that time, the indoor temperature was a very nice and comfortable 21 to 30 degrees Celsius. Taking it outside, the temperature fluctuations are much more severe, reaching about 12 to 30 degrees Celsius and yet … the breadboard continues to operate. The same behaviour can be seen regarding the humidity which cycles on a daily basis but only by about 5-10%. When outside, especially in the rainy period, the humidity can swing by 50% in a day! The pressure curve is, as expected, given the type of weather systems rolling around here.
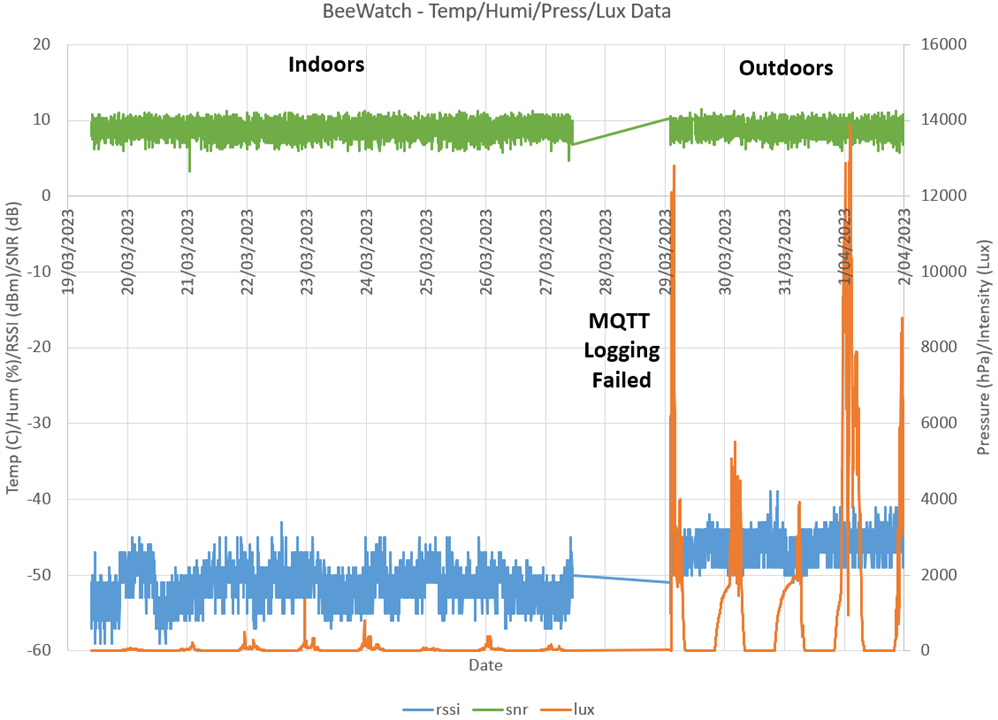
The brightness inside is very limited with the curtains drawn, with an occasional spike when the sun makes it directly through the gap in the curtain. Put outside, however, the brightness does spike quite a bit higher – although since they are individual time samples, this may be spiky due to breaks in the clouds and direct solar exposure as early and late in the day, the sun is shadowed by the building itself resulting in a slower change in temperature.
Radio-based metrics show that signal levels are strong (to be expected), although the outside positioning seems better than my indoors position. The SNR is a fairly consistent 8-10dB with no diurnal trend, suggesting no major sources of interference despite an occasional dip as low as 3dB.
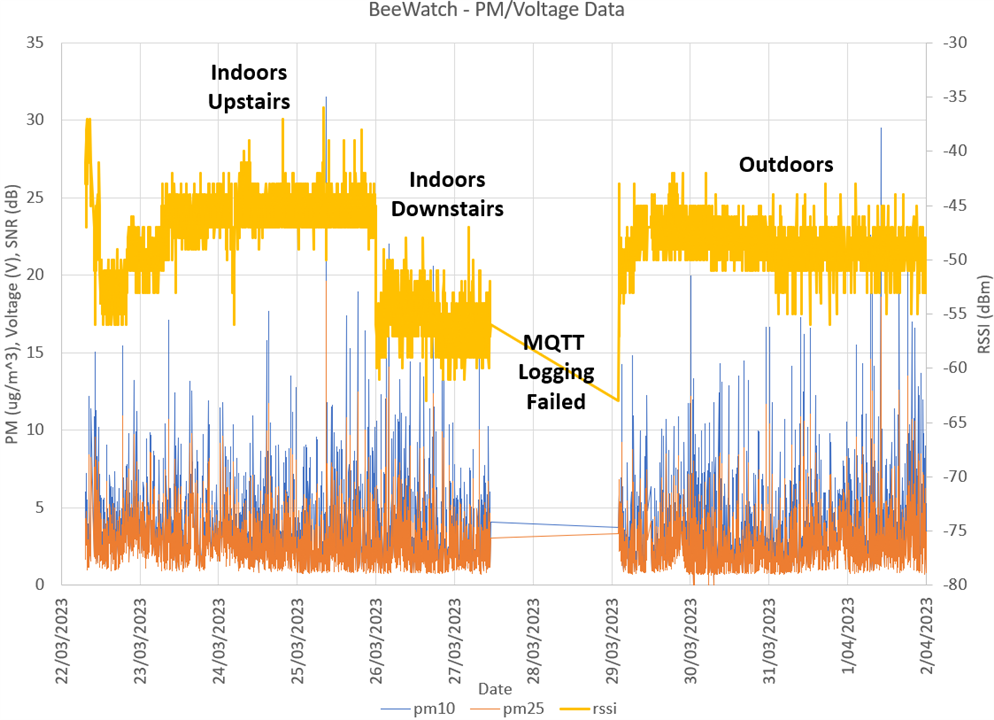
The particulate monitor started a few days later, so there was less data. In this case, the radio data can determine my repositioning of the board from upstairs to downstairs and outdoors. The particulate values are very spiky – single samples show quite a bit of variation and this may be expected as short term air events occur (e.g. a car drives by, someone fires up a barbecue, etc.) The baseline does have some trend, but it is hard to see and generally air quality is good (which is no surprise – I’m on a hill in a suburban relatively low-density area).
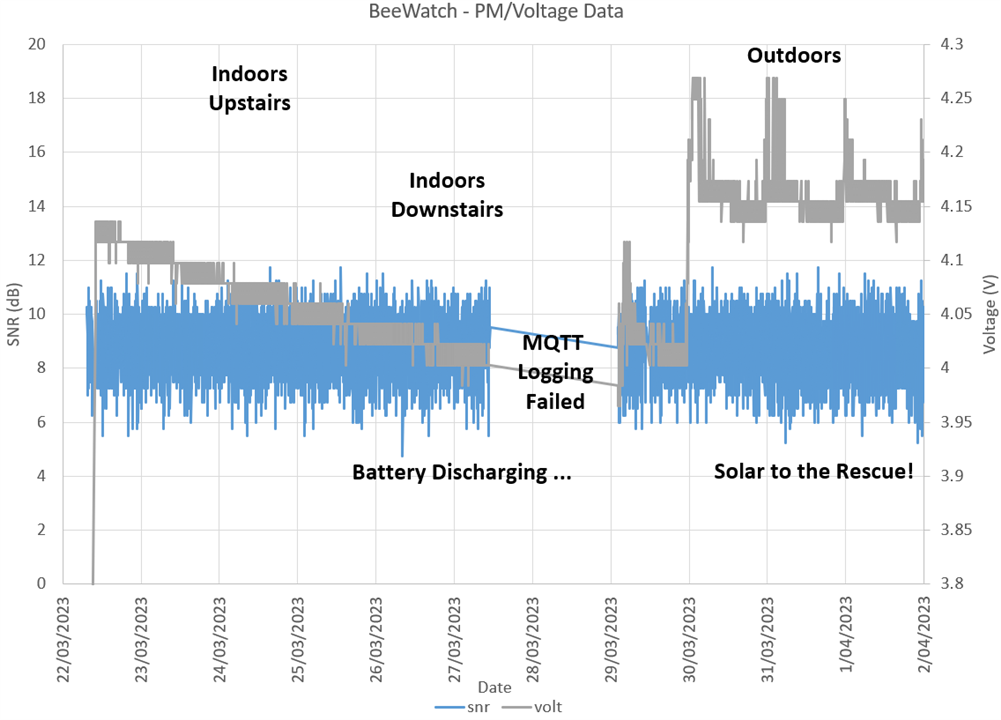
But most importantly, is to see the battery voltage trend. I let the system run for days initially with no power input so the fully-charged cells can have a chance to discharge a little. If not for this, we would never be able to see the battery ever charge!
In the trace, it is quite clear that I had deployed the system outside rather late in the day on the first outdoor day, resulting in an incomplete charge. However, by the second day, it was able to reach and (perhaps) slightly overshoot 4.2V full-charge point but not in a dangerous way (although this is more likely just a measurement anomaly due to non-precision resistors and ADC). Losing the sun, the battery voltage can be seen to decline a little but it has a stable grend staying above 4.1V, meaning that the board is well and truly self-sustaining. Similarly, the SNR is seen to be mostly between about 8-10dB, meaning an excellent radio link.
Conclusion
In the end, it is shown that the system can run from solar – or at least, the particulate monitor board is at present. It is possible to tie the DC buses together and remove three of the four 18650 cells by my calculations without any issue, making it truly self-sustaining. Of course, by then, I’d probably want to integrate both the Omron sensors and the particulate monitor onto a single MKR WAN 1310 (even if that means making the board pretend to be two devices) as the overhead of having two boards is unjustified. That being said, my original goal was not to build a final device, so I won’t be investigating this.
The ability to log data through MQTT has been demonstrated, along with the use of the Storage API although in free plans this is limited to just 24 hours of data. A crude parser is used to extract data values out of the JSON dumps and this was enough to show preliminary trends in sensor data and validate operation of the solar charging.
Instead, I should really get a move-on with AI and the Nicla Vision board, as I have no prior experience with it. After that, I should focus on some form of integration to create some sort of visualisation, as offline data analysis from logs is hardly ideal. But it does prove that the system works!
In the meantime, this weekend, I’ve been working on something else entirely …
[[BeeWatch Blog Index]]
- Blog 1: README.TXT
- Blog 2: Unboxing the Kit
- Blog 3: LoRa vs. LoRaWAN & Getting Started with MKR WAN 1310
- Blog 4: LoRaWAN Gateway Set-Up & MKR WAN 1310 Quirks
- Blog 5: Power, State Saving, Using Sensors & Battery
- Blog 6: Particulate Monitoring & Solar Power Input
- Blog 7: Powered by the Sun & Initial Data
- Blog 8: Getting Started with Nicla Vision
- Blog 9: Nicla Vision IR ToF & Audio Sensing, Data Dump
- Blog 10: Nicla Vision Power, Saving B’s & Dashboard Woes
- Blog 11: Summary Conclusion

